| Param | Original file | Final file |
|---|---|---|
| Filename | modeM0/AS1C04_001T01_9000002984_20020cztM0_level2.evt | modeM0/AS1C04_001T01_9000002984_20020cztM0_level2_quad_clean.evt |
| Size (bytes) | 638,311,680 | 104,840,640 |
| Size | 608.7 MB | 100.0 MB |
| Events in quadrant A | 6,840,752 | 640,984 |
| Events in quadrant B | 3,137,354 | 723,890 |
| Events in quadrant C | 3,097,681 | 715,430 |
| Events in quadrant D | 5,835,288 | 660,701 |
| Mode SS | |||
|---|---|---|---|
| Quadrant | BADHDUFLAG | Total packets | Discarded packets |
| A | 0 | 128 | 0 |
| B | 0 | 128 | 0 |
| C | 0 | 128 | 0 |
| D | 0 | 128 | 0 |
| Mode M9 | |||
|---|---|---|---|
| Quadrant | BADHDUFLAG | Total packets | Discarded packets |
| A | 0 | 11 | 0 |
| B | 0 | 11 | 0 |
| C | 0 | 11 | 0 |
| D | 0 | 11 | 0 |
| Mode M0 | |||
|---|---|---|---|
| Quadrant | BADHDUFLAG | Total packets | Discarded packets |
| A | 0 | 24446 | 1 |
| B | 0 | 13292 | 1 |
| C | 0 | 12945 | 1 |
| D | 0 | 21611 | 1 |
| Quadrant | Total seconds | Saturated seconds | Saturation percentage |
|---|---|---|---|
| A | 6200 | 1274 | 20.548387% |
| B | 6200 | 42 | 0.677419% |
| C | 6201 | 72 | 1.161103% |
| D | 6201 | 922 | 14.868570% |
Noise dominated data is calculated using 1-second bins in cleaned event files. If a bin has >2000 counts, and if more than 50% of those come from <1% of pixels, then it is considered to be noise-dominated and hence unusable.
| Quadrant | # 1 sec bins | Bins with >0 counts | Bins with >2000 counts | High rate bins dominated by noise | Noise dominated (total time) | Noise dominated (detector-on time) | Marked lightcurve |
|---|---|---|---|---|---|---|---|
| A | 7350 | 6201 | 1131 | 1131 | 15.39% | 18.24% |  |
| B | 7350 | 6201 | 4 | 4 | 0.05% | 0.06% |  |
| C | 7351 | 6202 | 0 | 0 | 0.00% | 0.00% | 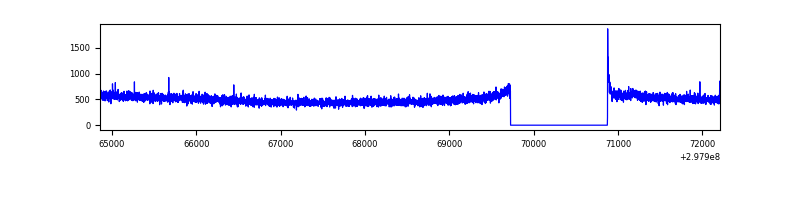 |
| D | 7351 | 6202 | 925 | 925 | 12.58% | 14.91% | 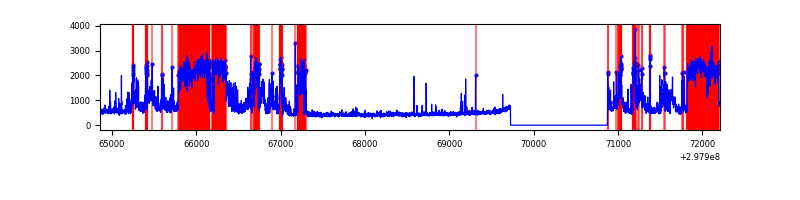 |
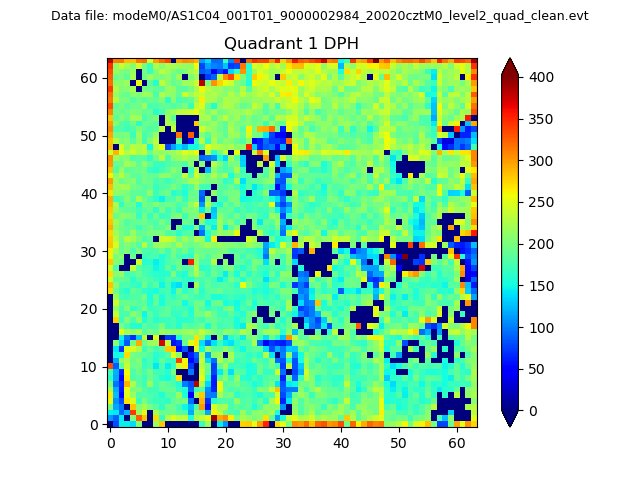
Top three noisy pixels from each quadrant. If the there are fewer than three noisy pixels in the level2.evt file, extra rows are filled as -1
| Pixel properties | Quadrant properties | ||||||
|---|---|---|---|---|---|---|---|
| Quadrant | DetID | PixID | Counts | Sigma | Mean | Median | Sigma |
| A | 14 | 238 | 3768193 | 26985.38 | 702 | 688 | 139.6 |
| A | 14 | 254 | 290057 | 2072.65 | 702 | 688 | 139.6 |
| A | 5 | 16 | 72998 | 517.93 | 702 | 688 | 139.6 |
| B | 0 | 189 | 53716 | 373.1 | 758 | 738 | 142.0 |
| B | 0 | 197 | 38142 | 263.42 | 758 | 738 | 142.0 |
| B | 0 | 190 | 36374 | 250.97 | 758 | 738 | 142.0 |
| C | 14 | 238 | 116801 | 673.4 | 745 | 751 | 172.3 |
| C | 3 | 233 | 60865 | 348.82 | 745 | 751 | 172.3 |
| C | 0 | 207 | 10561 | 56.92 | 745 | 751 | 172.3 |
| D | 7 | 238 | 1596564 | 9031.8 | 731 | 709 | 176.7 |
| D | 7 | 38 | 1041932 | 5892.84 | 731 | 709 | 176.7 |
| D | 12 | 218 | 116679 | 656.34 | 731 | 709 | 176.7 |
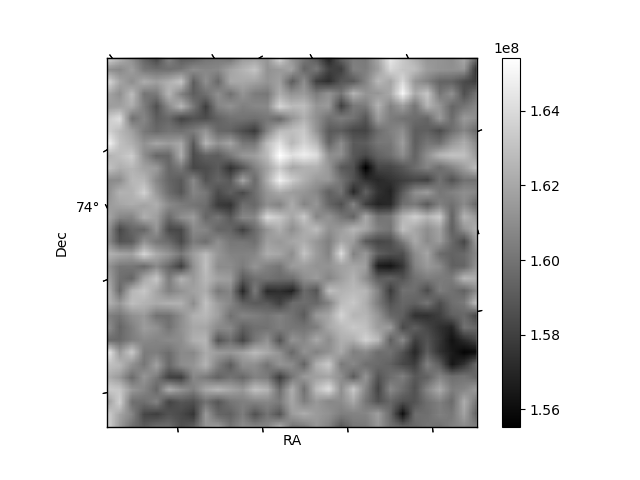
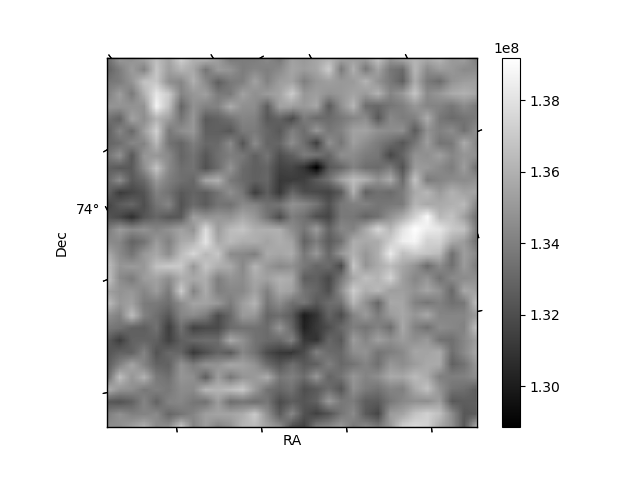
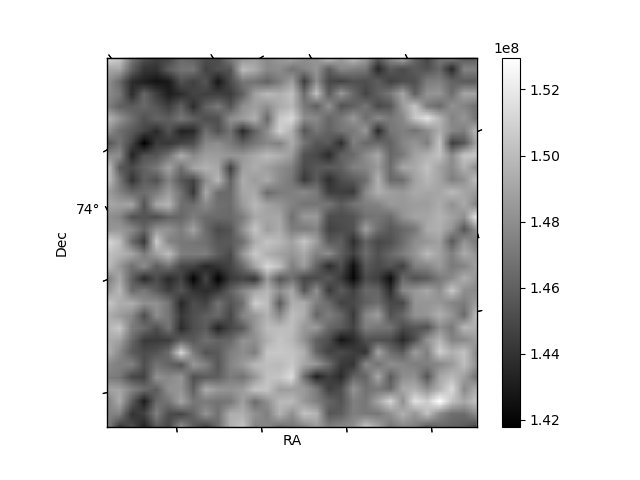
Histogram calculated using DETX and DETY for each event in the final _common_clean file
| Quadrant A | 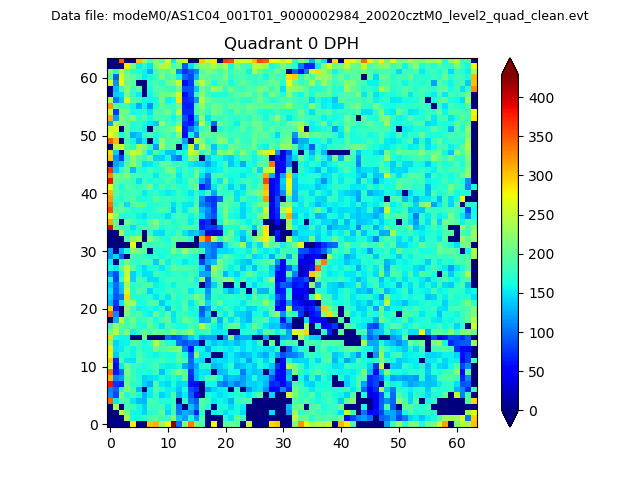 |
 |
Quadrant B |
|---|---|---|---|
| Quadrant D | 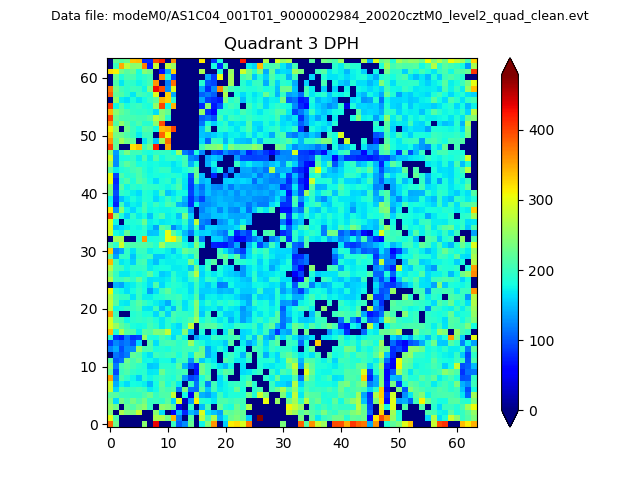 |
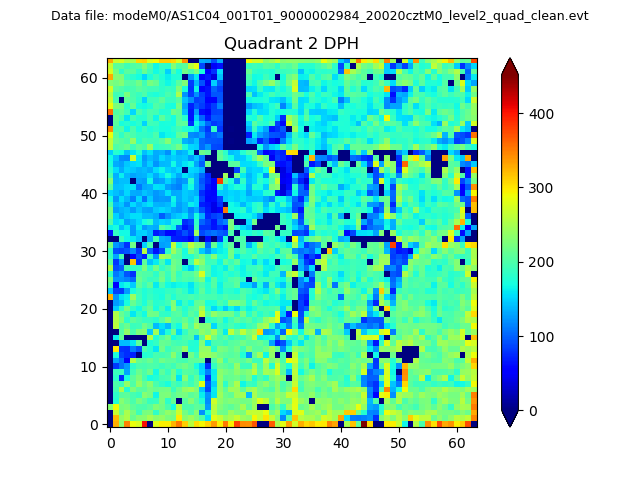 |
Quadrant C |
| Plot type | Count rate plots | Images |
|---|---|---|
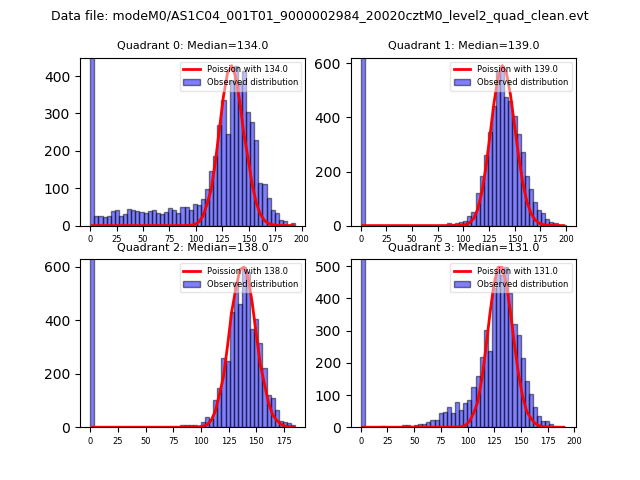
| Comparison with Poisson distribution Blue bars denote a histogram of data divided into 1 sec bins. Red curve is a Poisson curve with rate = median count rate of data. |
 |
 |
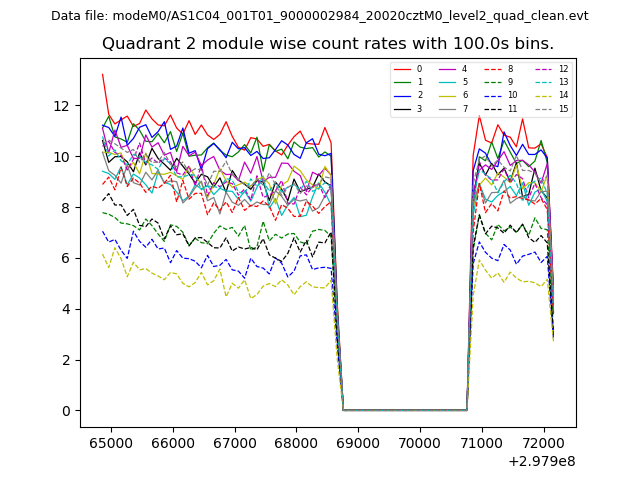
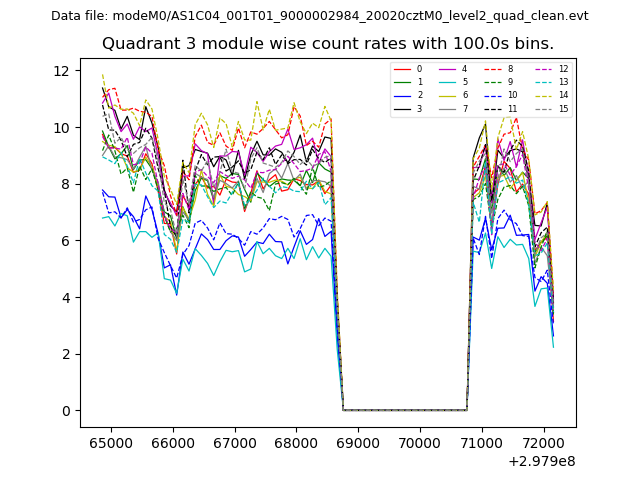
| Quadrant-wise count rates Data is divided into 100 sec bins |
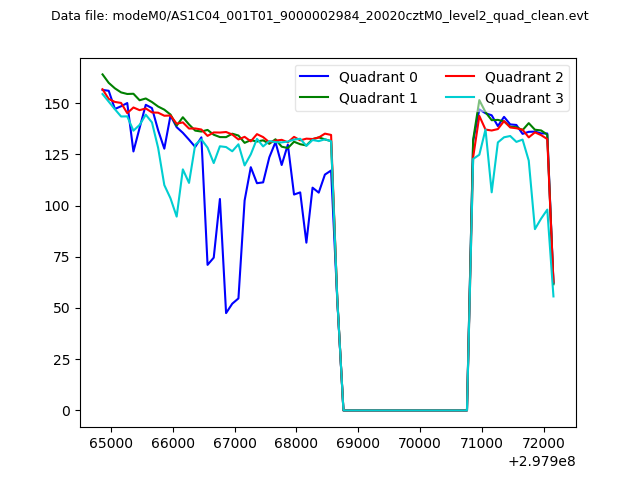 |
|
| Module-wise count rates for Quadrant A Data is divided into 100 sec bins |
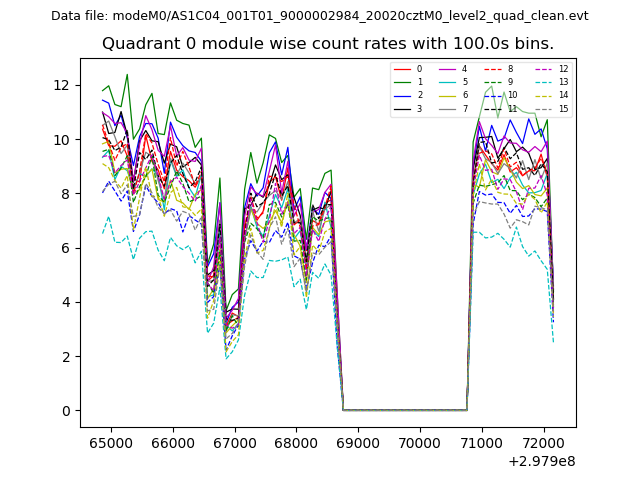 |
 |
| Module-wise count rates for Quadrant B Data is divided into 100 sec bins |
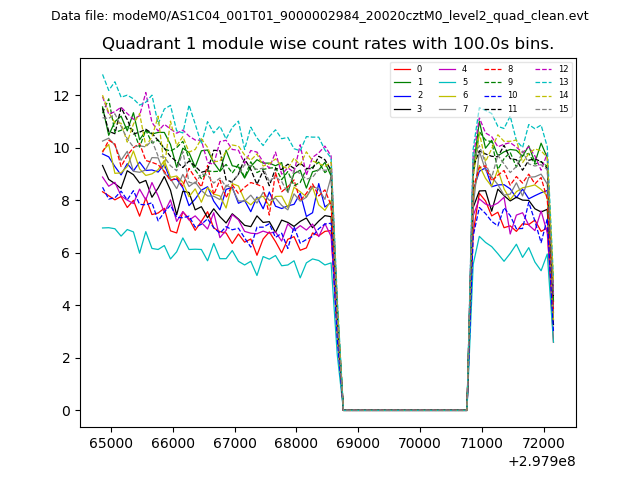 |
 |
| Module-wise count rates for Quadrant C Data is divided into 100 sec bins |
 |
 |
| Module-wise count rates for Quadrant D Data is divided into 100 sec bins |
 |
 |
| Parameter | Plot |
|---|---|
| CZT HV Monitor | 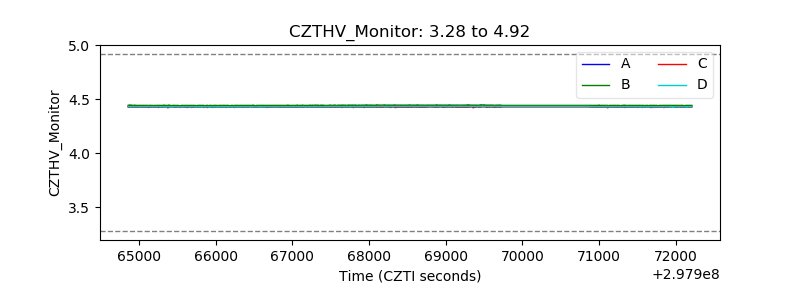 |
| D_VDD | 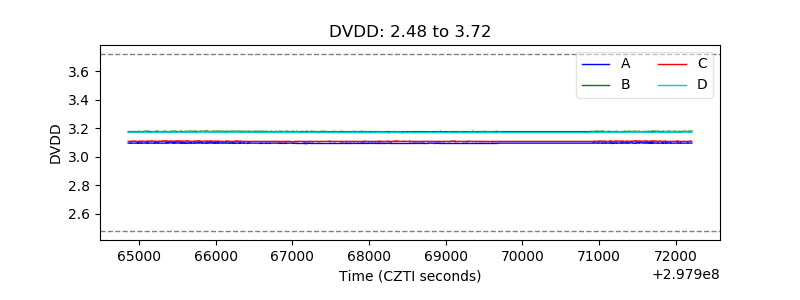 |
| Temperature 1 | 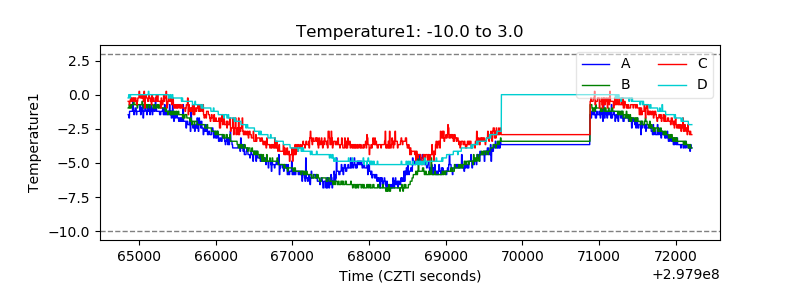 |
| Veto HV Monitor | 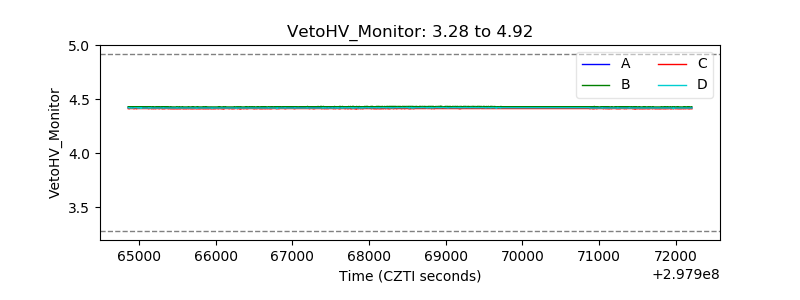 |
| Veto LLD | 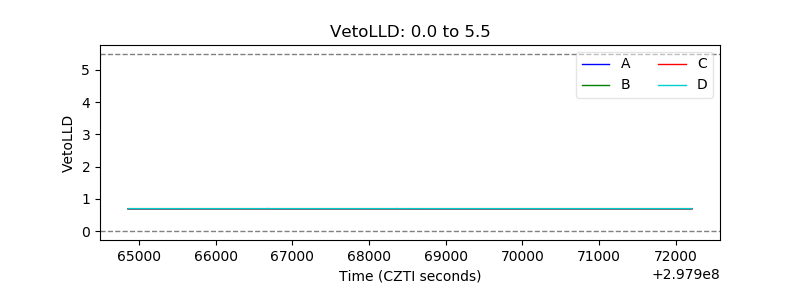 |
| Alpha Counter | 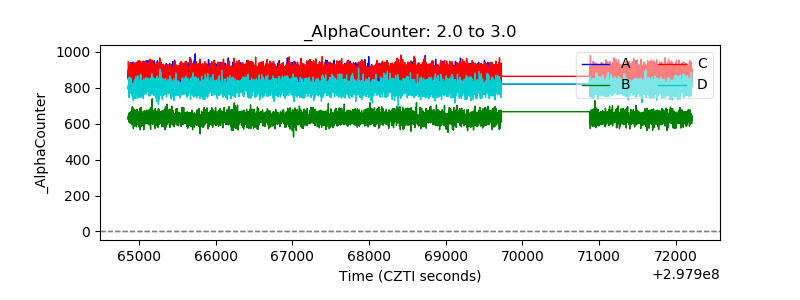 |
| _CPM_Rate | 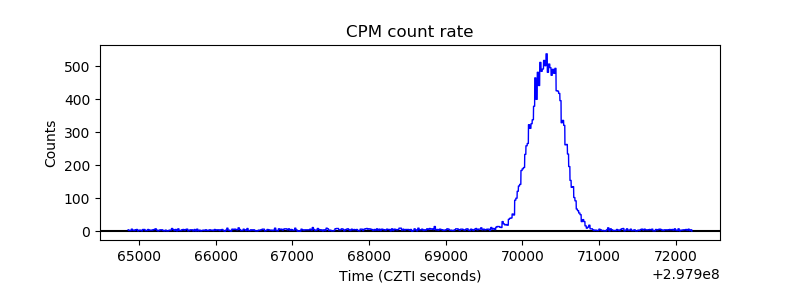 |
| CZT Counter | 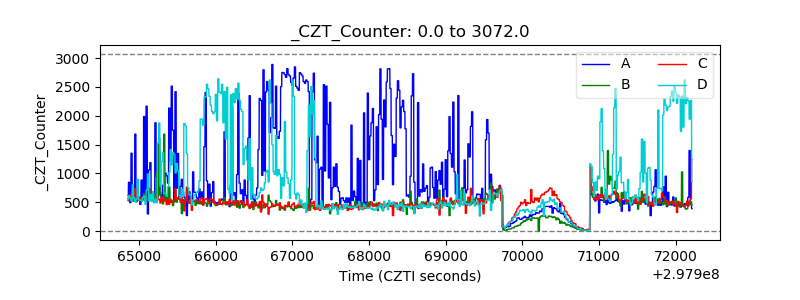 |
| +2.5 Volts monitor | 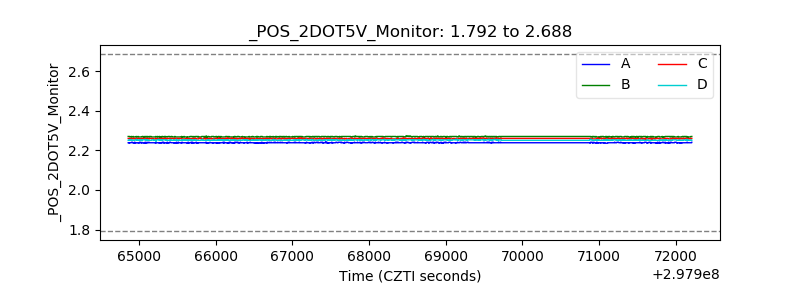 |
| +5 Volts monitor |  |
| _ROLL_ROT | 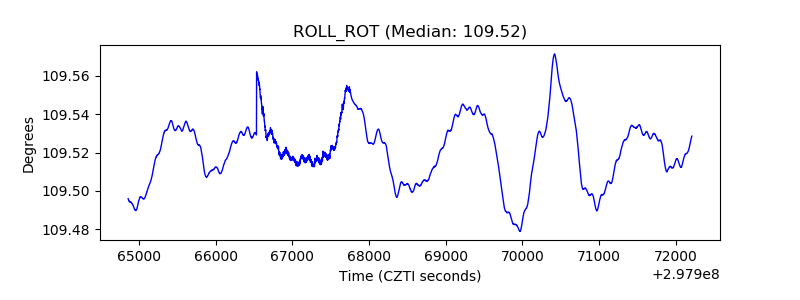 |
| _Roll_DEC | 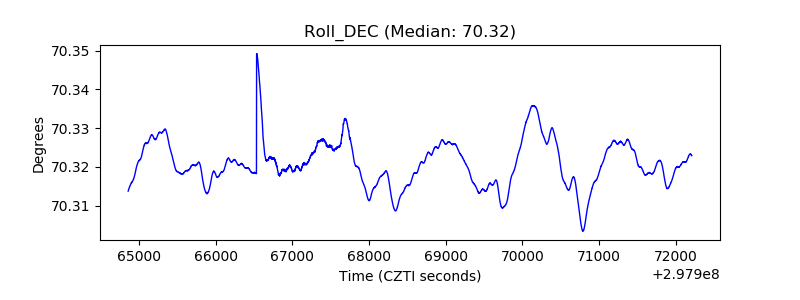 |
| _Roll_RA | 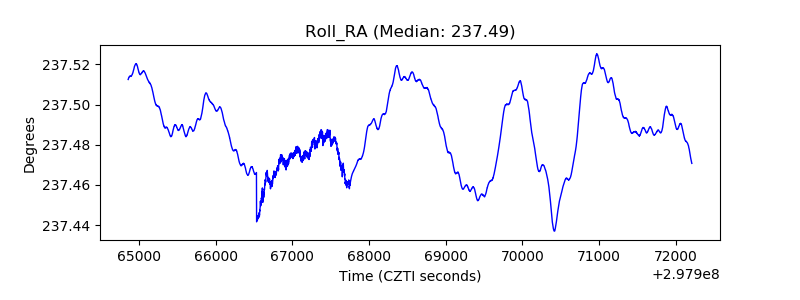 |
| Veto Counter | 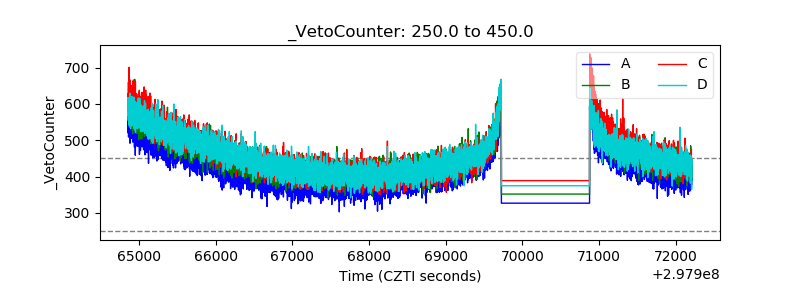 |