| Param | Original file | Final file |
|---|---|---|
| Filename | modeM0/AS1C04_001T01_9000002984_20021cztM0_level2.evt | modeM0/AS1C04_001T01_9000002984_20021cztM0_level2_quad_clean.evt |
| Size (bytes) | 599,578,560 | 109,797,120 |
| Size | 571.8 MB | 104.7 MB |
| Events in quadrant A | 5,028,067 | 719,825 |
| Events in quadrant B | 3,471,621 | 734,843 |
| Events in quadrant C | 3,338,501 | 727,597 |
| Events in quadrant D | 5,862,993 | 672,384 |
| Mode SS | |||
|---|---|---|---|
| Quadrant | BADHDUFLAG | Total packets | Discarded packets |
| A | 0 | 138 | 0 |
| B | 0 | 138 | 0 |
| C | 0 | 138 | 0 |
| D | 0 | 138 | 0 |
| Mode M9 | |||
|---|---|---|---|
| Quadrant | BADHDUFLAG | Total packets | Discarded packets |
| A | 0 | 7 | 0 |
| B | 0 | 7 | 0 |
| C | 0 | 7 | 0 |
| D | 0 | 7 | 0 |
| Mode M0 | |||
|---|---|---|---|
| Quadrant | BADHDUFLAG | Total packets | Discarded packets |
| A | 0 | 19263 | 1 |
| B | 0 | 14682 | 1 |
| C | 0 | 14202 | 2 |
| D | 0 | 22047 | 1 |
| Quadrant | Total seconds | Saturated seconds | Saturation percentage |
|---|---|---|---|
| A | 6743 | 427 | 6.332493% |
| B | 6744 | 85 | 1.260380% |
| C | 6743 | 94 | 1.394038% |
| D | 6743 | 852 | 12.635326% |
Noise dominated data is calculated using 1-second bins in cleaned event files. If a bin has >2000 counts, and if more than 50% of those come from <1% of pixels, then it is considered to be noise-dominated and hence unusable.
| Quadrant | # 1 sec bins | Bins with >0 counts | Bins with >2000 counts | High rate bins dominated by noise | Noise dominated (total time) | Noise dominated (detector-on time) | Marked lightcurve |
|---|---|---|---|---|---|---|---|
| A | 7488 | 6744 | 346 | 346 | 4.62% | 5.13% | 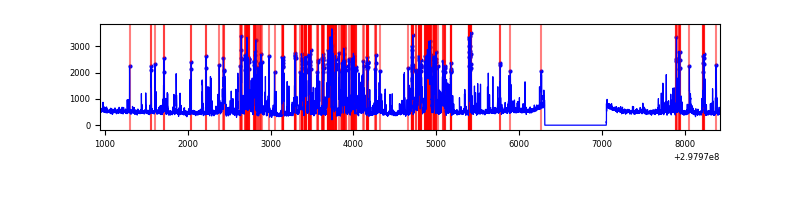 |
| B | 7489 | 6745 | 9 | 9 | 0.12% | 0.13% | 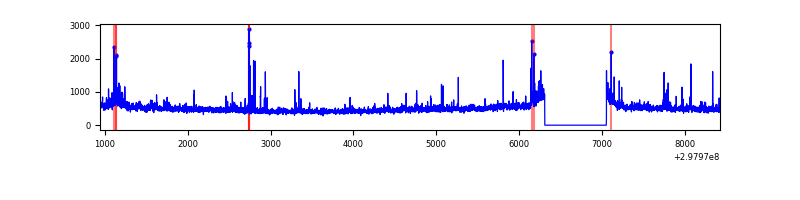 |
| C | 7488 | 6744 | 0 | 0 | 0.00% | 0.00% |  |
| D | 7488 | 6744 | 819 | 819 | 10.94% | 12.14% | 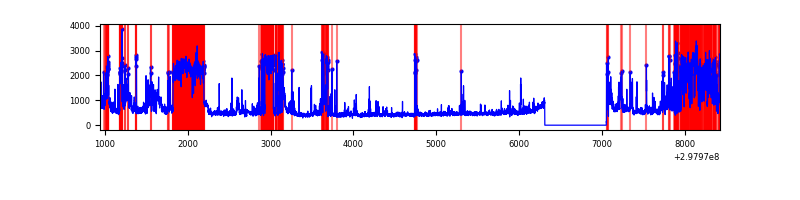 |
Top three noisy pixels from each quadrant. If the there are fewer than three noisy pixels in the level2.evt file, extra rows are filled as -1
| Pixel properties | Quadrant properties | ||||||
|---|---|---|---|---|---|---|---|
| Quadrant | DetID | PixID | Counts | Sigma | Mean | Median | Sigma |
| A | 14 | 238 | 1584215 | 9949.1 | 790 | 773 | 159.2 |
| A | 14 | 254 | 296132 | 1855.8 | 790 | 773 | 159.2 |
| A | 5 | 16 | 95079 | 592.54 | 790 | 773 | 159.2 |
| B | 0 | 189 | 120733 | 795.76 | 806 | 786 | 150.7 |
| B | 7 | 220 | 63297 | 414.71 | 806 | 786 | 150.7 |
| B | 0 | 197 | 45862 | 299.05 | 806 | 786 | 150.7 |
| C | 14 | 238 | 122085 | 666.84 | 787 | 793 | 181.9 |
| C | 3 | 233 | 90303 | 492.11 | 787 | 793 | 181.9 |
| C | 0 | 207 | 52879 | 286.36 | 787 | 793 | 181.9 |
| D | 7 | 38 | 1231065 | 6583.39 | 771 | 750 | 186.9 |
| D | 7 | 238 | 940253 | 5027.26 | 771 | 750 | 186.9 |
| D | 12 | 218 | 298815 | 1594.94 | 771 | 750 | 186.9 |
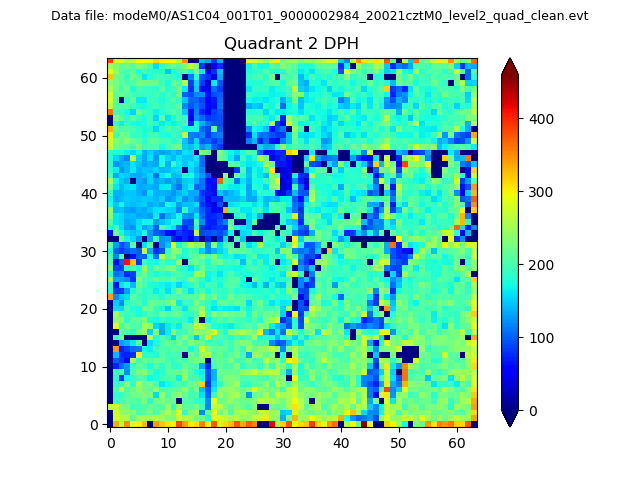
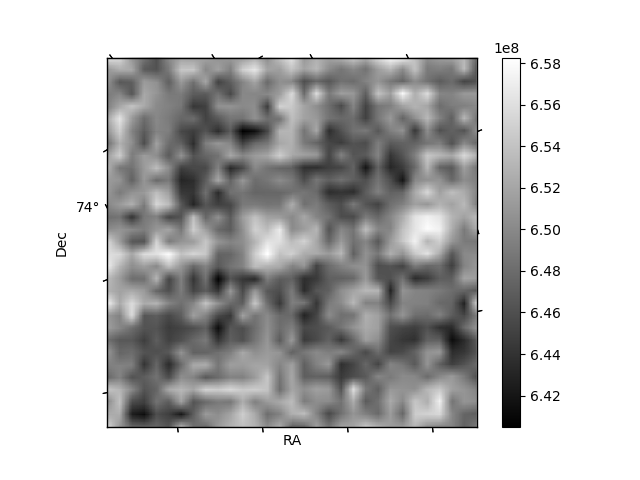
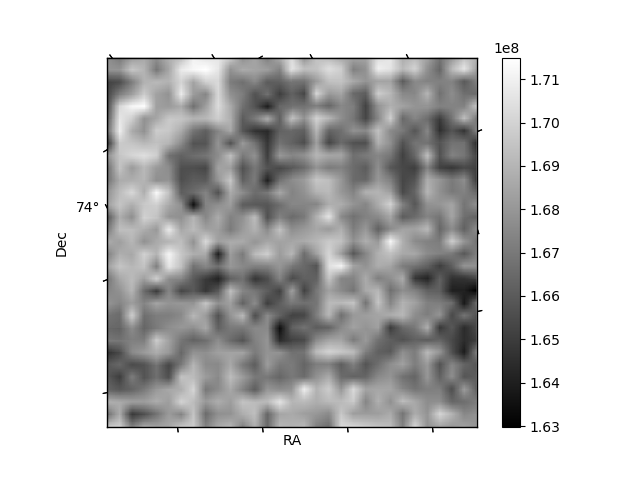
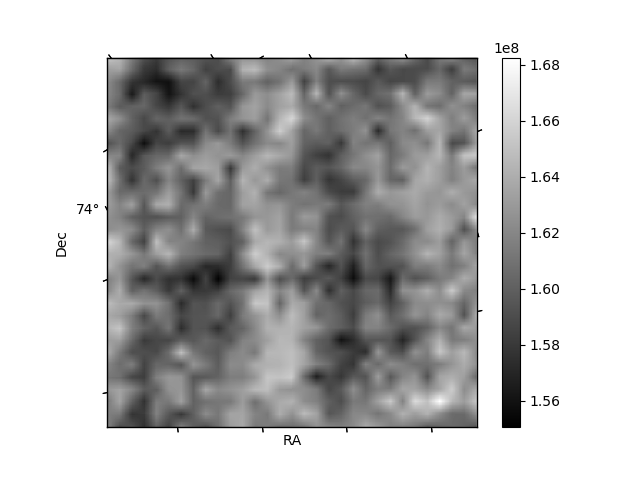
Histogram calculated using DETX and DETY for each event in the final _common_clean file
| Quadrant A | 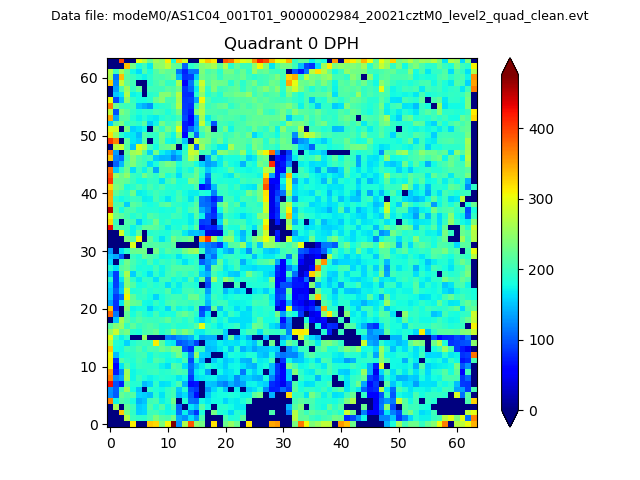 |
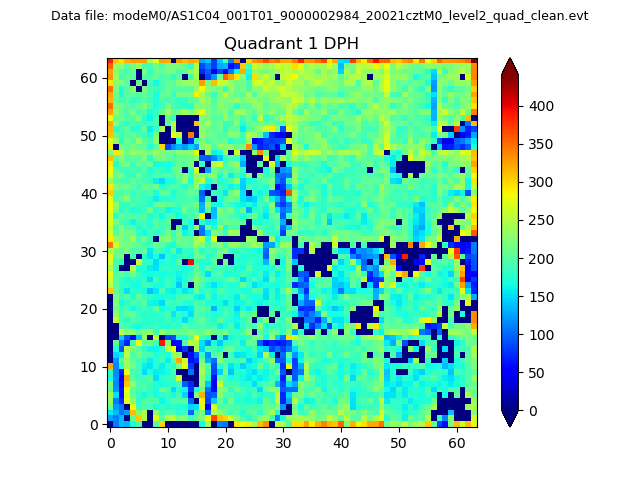 |
Quadrant B |
|---|---|---|---|
| Quadrant D | 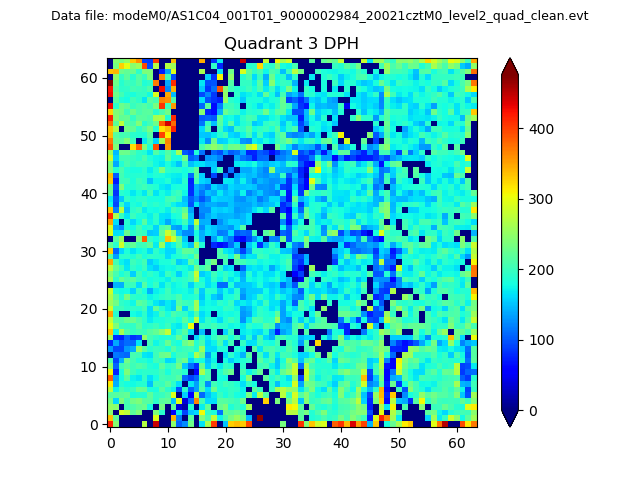 |
 |
Quadrant C |
| Plot type | Count rate plots | Images |
|---|---|---|
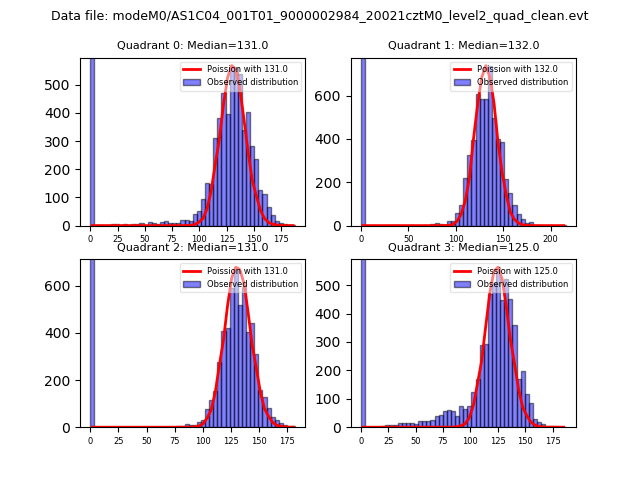
| Comparison with Poisson distribution Blue bars denote a histogram of data divided into 1 sec bins. Red curve is a Poisson curve with rate = median count rate of data. |
 |
 |
| Quadrant-wise count rates Data is divided into 100 sec bins |
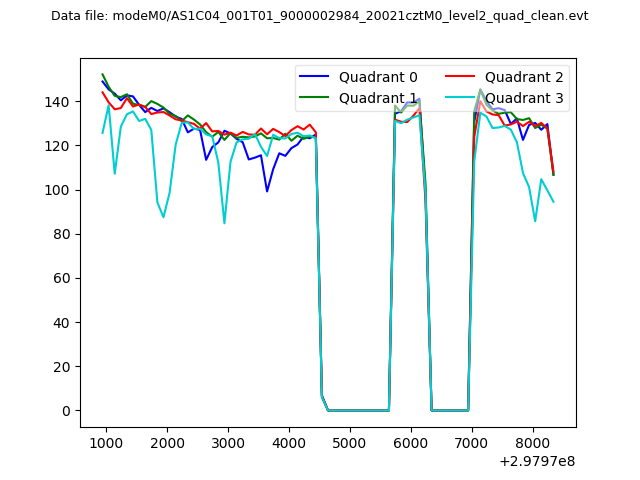 |
|
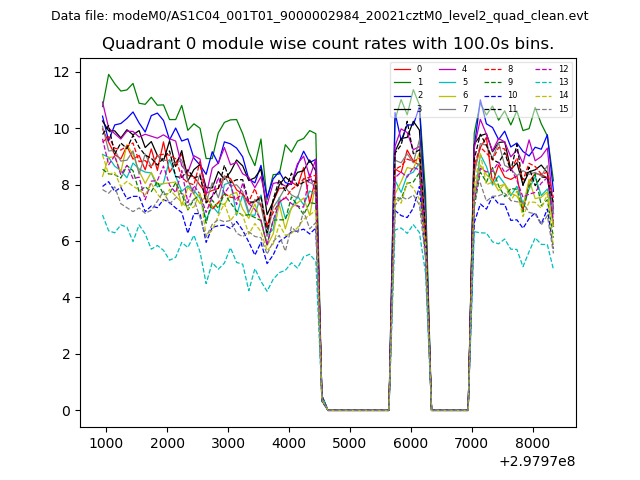
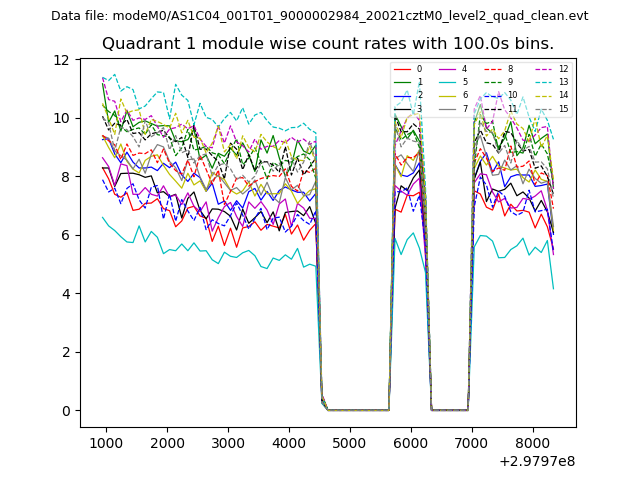
| Module-wise count rates for Quadrant A Data is divided into 100 sec bins |
 |
 |
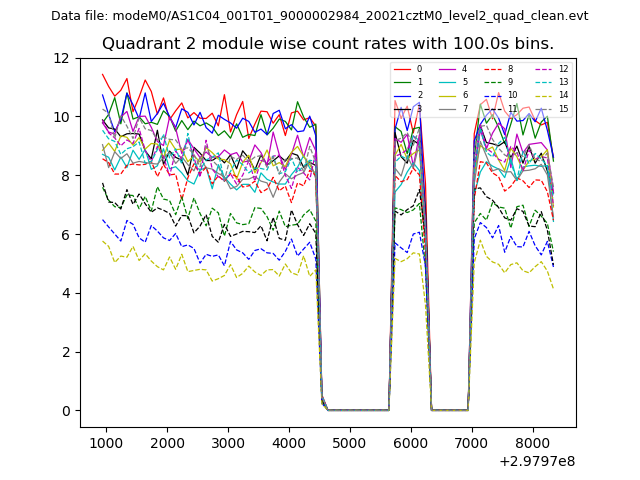
| Module-wise count rates for Quadrant B Data is divided into 100 sec bins |
 |
 |
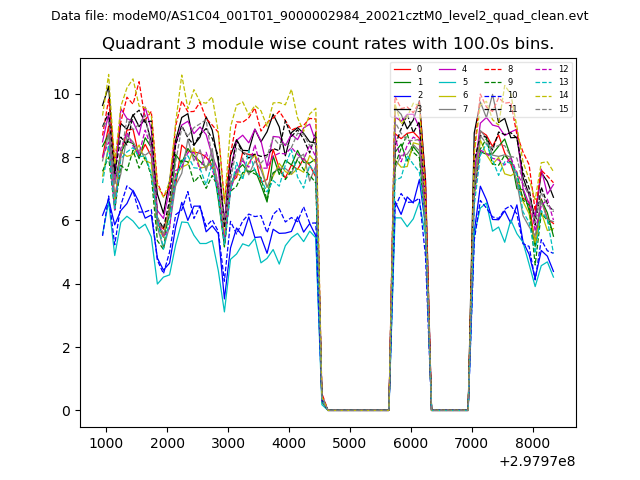
| Module-wise count rates for Quadrant C Data is divided into 100 sec bins |
 |
 |
| Module-wise count rates for Quadrant D Data is divided into 100 sec bins |
 |
 |
| Parameter | Plot |
|---|---|
| CZT HV Monitor | 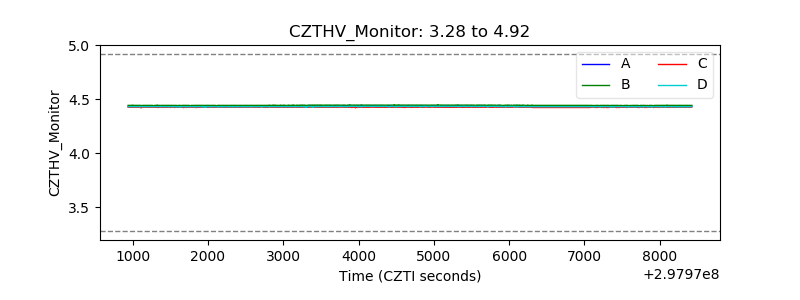 |
| D_VDD | 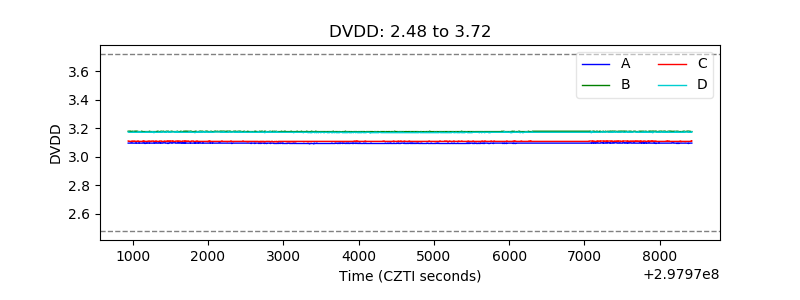 |
| Temperature 1 | 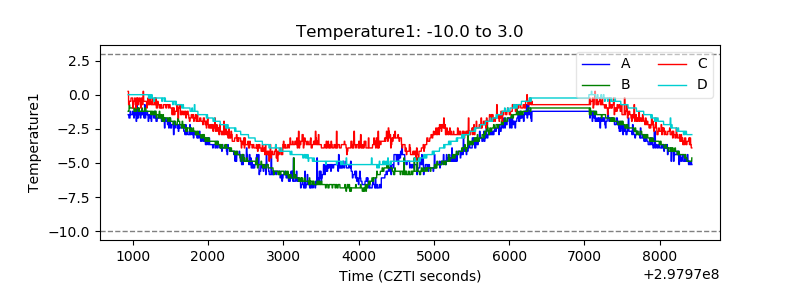 |
| Veto HV Monitor | 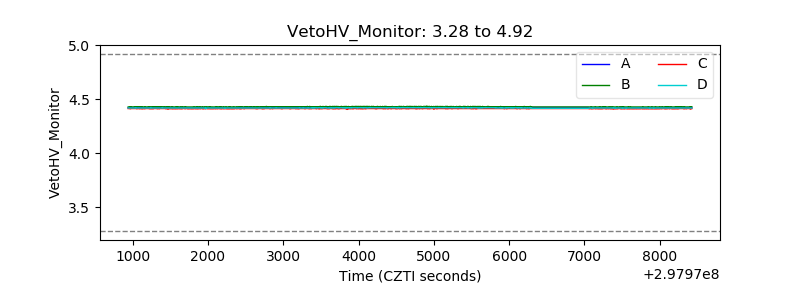 |
| Veto LLD | 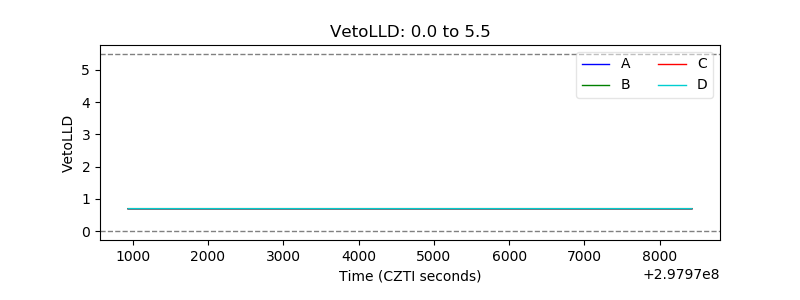 |
| Alpha Counter | 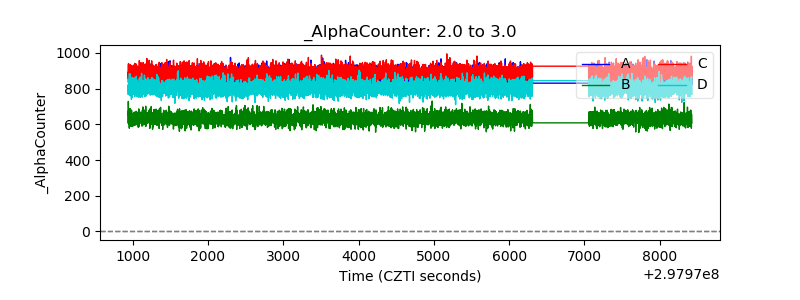 |
| _CPM_Rate | 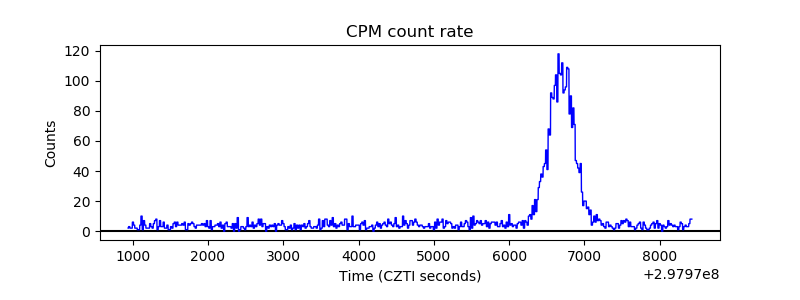 |
| CZT Counter | 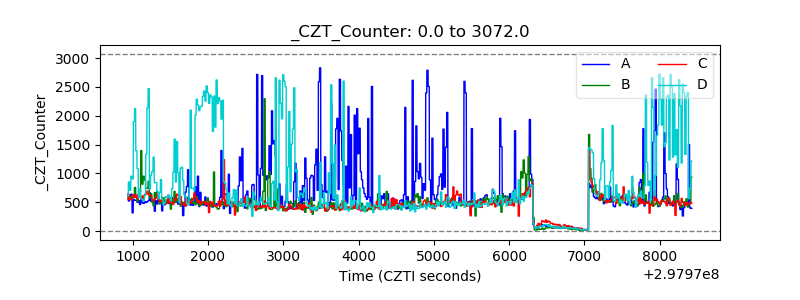 |
| +2.5 Volts monitor |  |
| +5 Volts monitor |  |
| _ROLL_ROT | 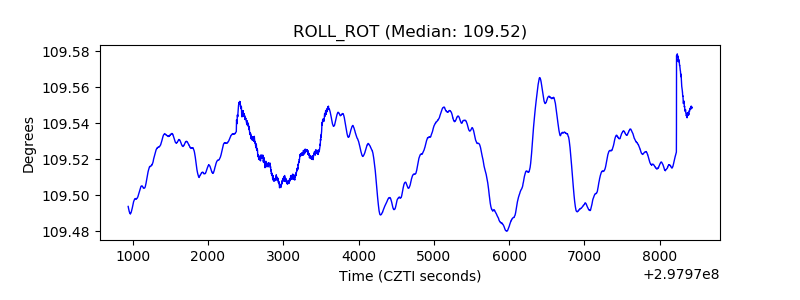 |
| _Roll_DEC | 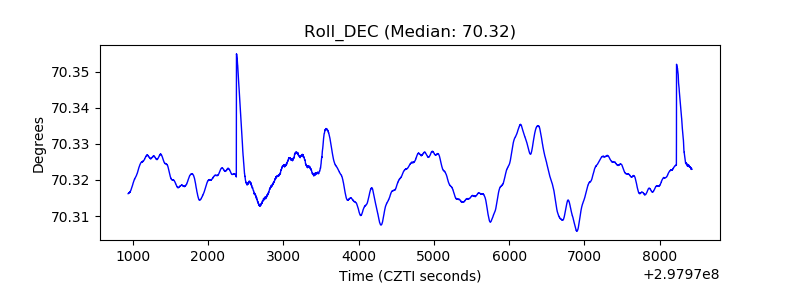 |
| _Roll_RA | 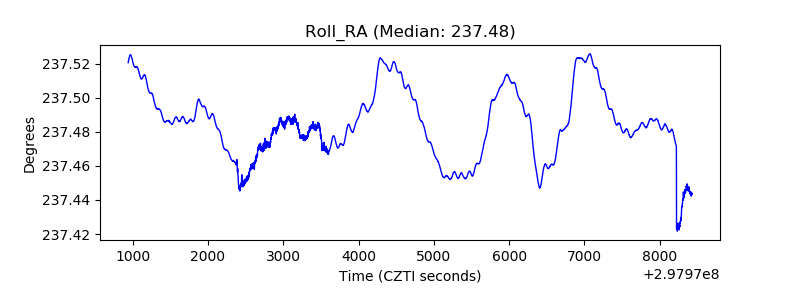 |
| Veto Counter | 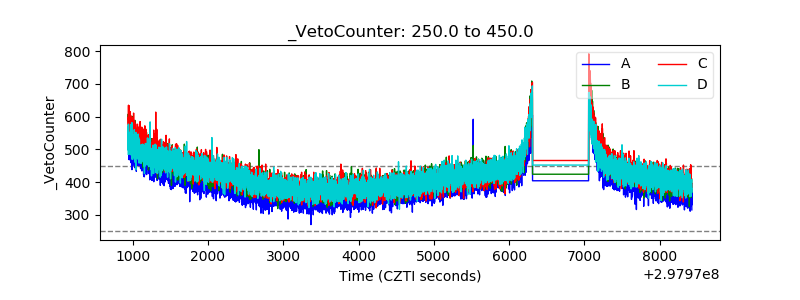 |