| Param | Original file | Final file |
|---|---|---|
| Filename | modeM0/AS1C04_001T01_9000002984_20023cztM0_level2.evt | modeM0/AS1C04_001T01_9000002984_20023cztM0_level2_quad_clean.evt |
| Size (bytes) | 681,768,000 | 121,645,440 |
| Size | 650.2 MB | 116.0 MB |
| Events in quadrant A | 4,494,277 | 816,541 |
| Events in quadrant B | 4,074,853 | 817,217 |
| Events in quadrant C | 3,718,172 | 812,069 |
| Events in quadrant D | 7,842,593 | 706,281 |
| Mode SS | |||
|---|---|---|---|
| Quadrant | BADHDUFLAG | Total packets | Discarded packets |
| A | 0 | 154 | 0 |
| B | 0 | 154 | 0 |
| C | 0 | 154 | 0 |
| D | 0 | 154 | 0 |
| Mode M9 | |||
|---|---|---|---|
| Quadrant | BADHDUFLAG | Total packets | Discarded packets |
| A | 0 | 4 | 0 |
| B | 0 | 5 | 0 |
| C | 0 | 5 | 0 |
| D | 0 | 5 | 0 |
| Mode M0 | |||
|---|---|---|---|
| Quadrant | BADHDUFLAG | Total packets | Discarded packets |
| A | 0 | 18525 | 2 |
| B | 0 | 17222 | 2 |
| C | 0 | 16149 | 2 |
| D | 0 | 28843 | 2 |
| Quadrant | Total seconds | Saturated seconds | Saturation percentage |
|---|---|---|---|
| A | 7641 | 216 | 2.826855% |
| B | 7641 | 94 | 1.230205% |
| C | 7641 | 133 | 1.740610% |
| D | 7641 | 1633 | 21.371548% |
Noise dominated data is calculated using 1-second bins in cleaned event files. If a bin has >2000 counts, and if more than 50% of those come from <1% of pixels, then it is considered to be noise-dominated and hence unusable.
| Quadrant | # 1 sec bins | Bins with >0 counts | Bins with >2000 counts | High rate bins dominated by noise | Noise dominated (total time) | Noise dominated (detector-on time) | Marked lightcurve |
|---|---|---|---|---|---|---|---|
| A | 7886 | 7642 | 134 | 134 | 1.70% | 1.75% |  |
| B | 7886 | 7642 | 10 | 10 | 0.13% | 0.13% | 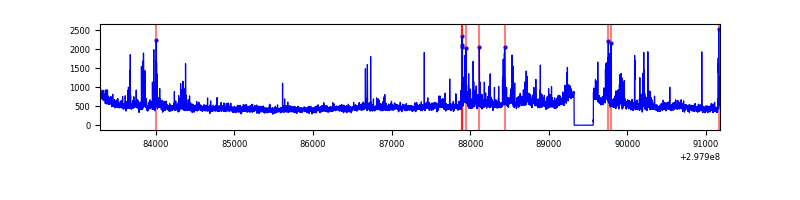 |
| C | 7886 | 7642 | 9 | 9 | 0.11% | 0.12% | 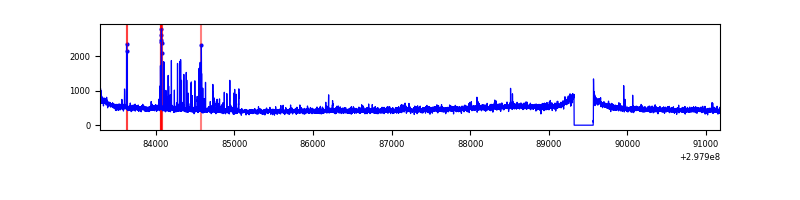 |
| D | 7886 | 7642 | 1443 | 1443 | 18.30% | 18.88% | 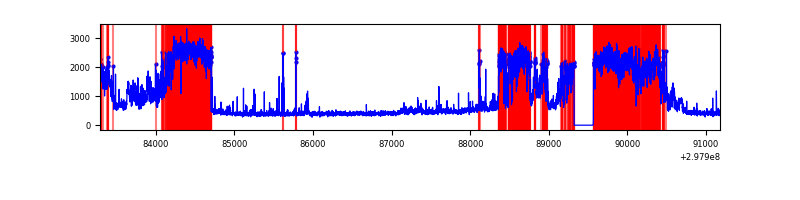 |
Top three noisy pixels from each quadrant. If the there are fewer than three noisy pixels in the level2.evt file, extra rows are filled as -1
| Pixel properties | Quadrant properties | ||||||
|---|---|---|---|---|---|---|---|
| Quadrant | DetID | PixID | Counts | Sigma | Mean | Median | Sigma |
| A | 14 | 254 | 443541 | 2456.71 | 891 | 873 | 180.2 |
| A | 14 | 238 | 408766 | 2263.72 | 891 | 873 | 180.2 |
| A | 5 | 16 | 144116 | 794.97 | 891 | 873 | 180.2 |
| B | 0 | 189 | 181816 | 1058.12 | 899 | 875 | 171.0 |
| B | 0 | 197 | 146025 | 848.82 | 899 | 875 | 171.0 |
| B | 7 | 220 | 64746 | 373.51 | 899 | 875 | 171.0 |
| C | 14 | 238 | 135391 | 660.75 | 876 | 879 | 203.6 |
| C | 3 | 233 | 123854 | 604.08 | 876 | 879 | 203.6 |
| C | 0 | 207 | 26914 | 127.89 | 876 | 879 | 203.6 |
| D | 7 | 38 | 3847742 | 19539.03 | 814 | 792 | 196.9 |
| D | 7 | 238 | 247509 | 1253.1 | 814 | 792 | 196.9 |
| D | 12 | 227 | 221925 | 1123.16 | 814 | 792 | 196.9 |
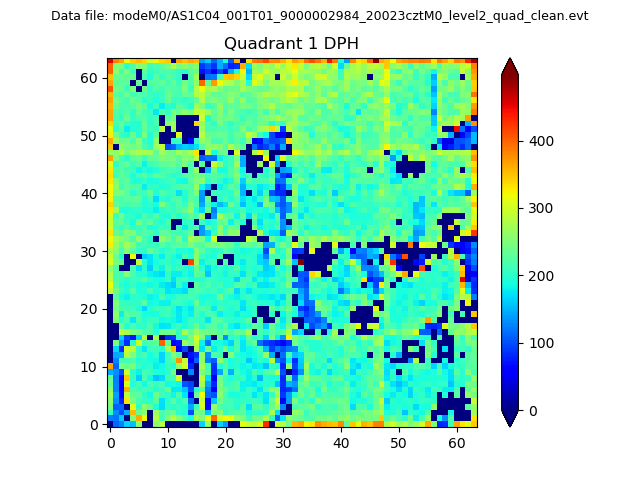
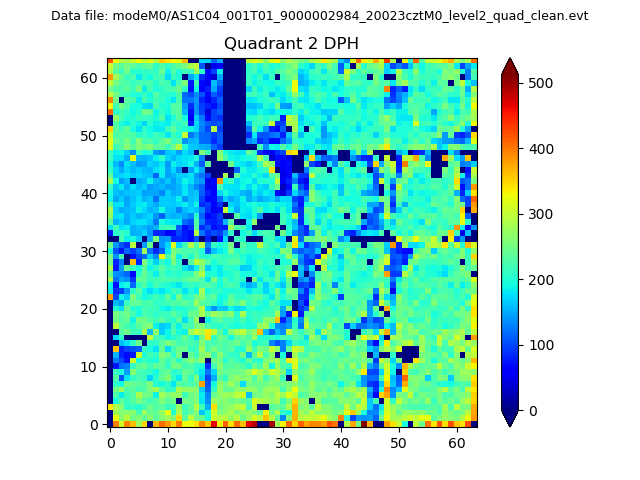
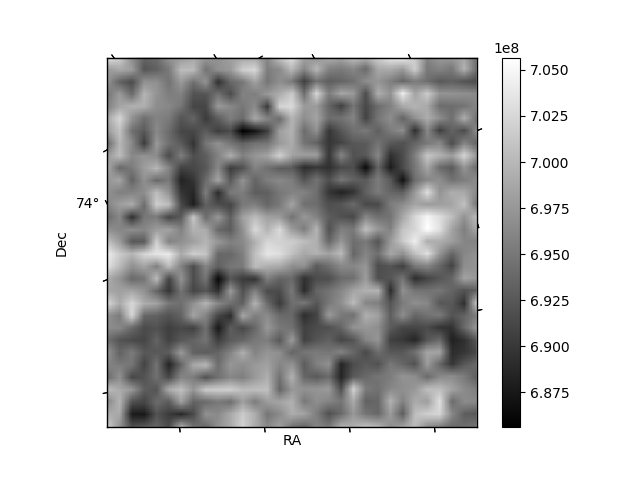
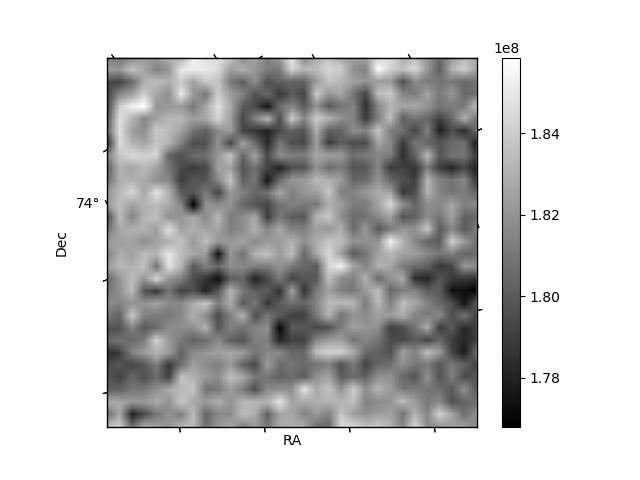
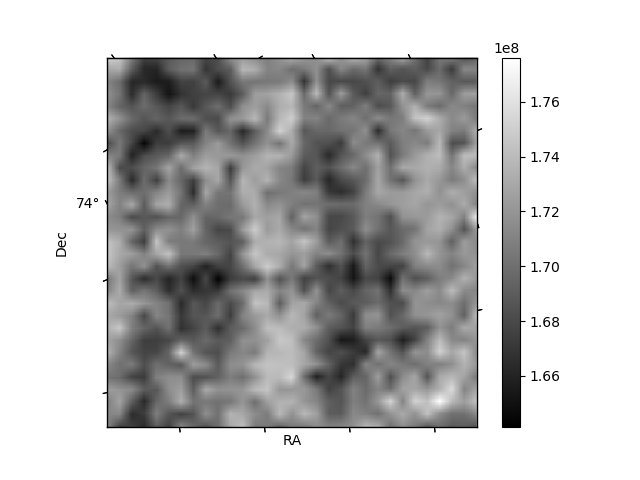
Histogram calculated using DETX and DETY for each event in the final _common_clean file
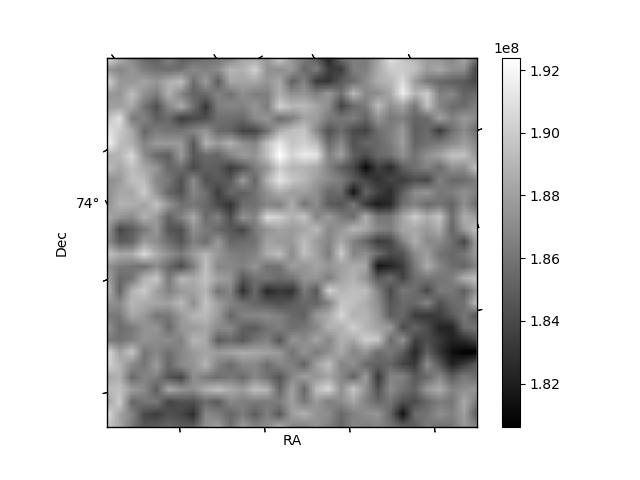
| Quadrant A | 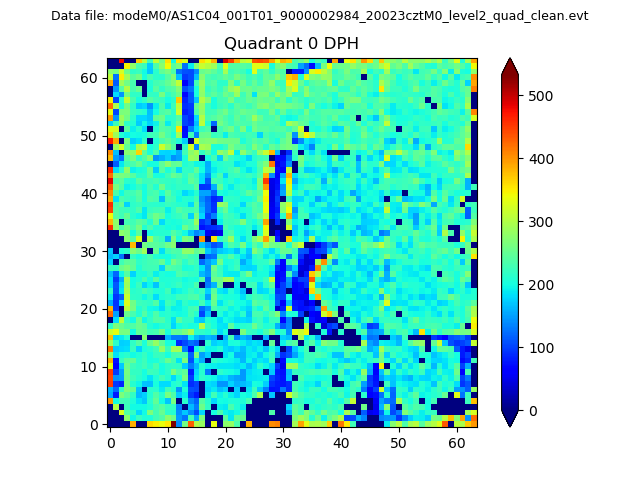 |
 |
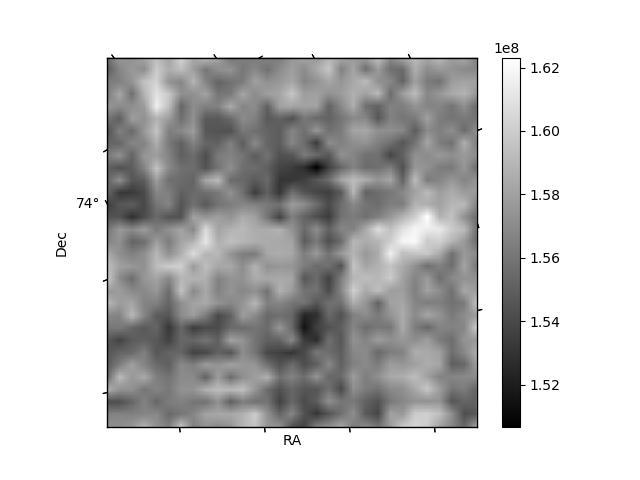
Quadrant B |
|---|---|---|---|
| Quadrant D | 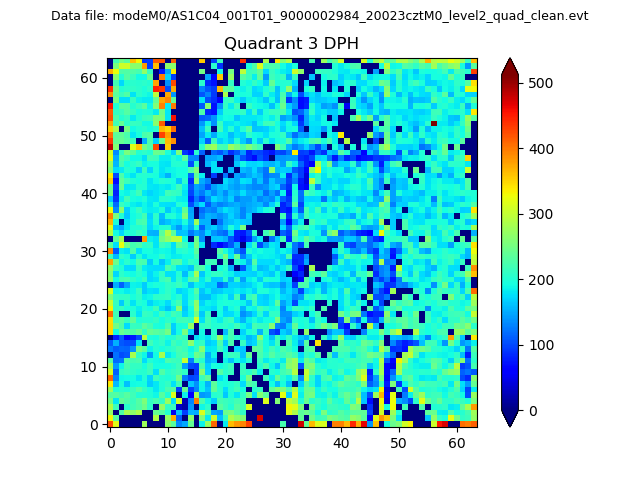 |
 |
Quadrant C |
| Plot type | Count rate plots | Images |
|---|---|---|
| Comparison with Poisson distribution Blue bars denote a histogram of data divided into 1 sec bins. Red curve is a Poisson curve with rate = median count rate of data. |
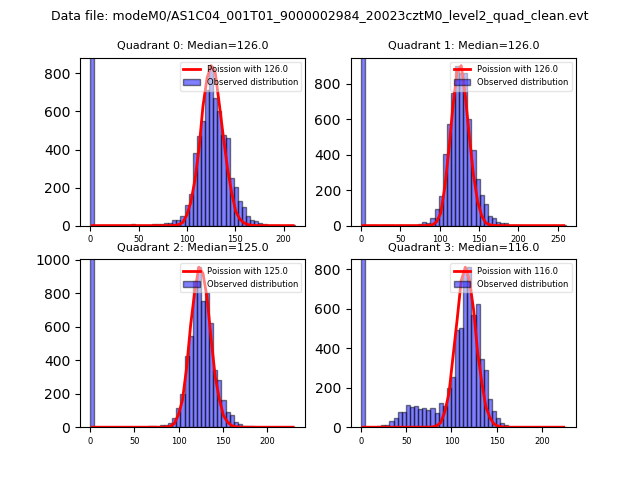 |
 |
| Quadrant-wise count rates Data is divided into 100 sec bins |
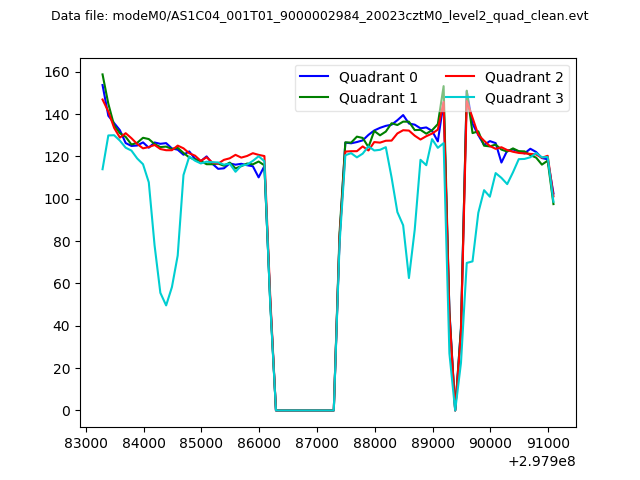 |
|
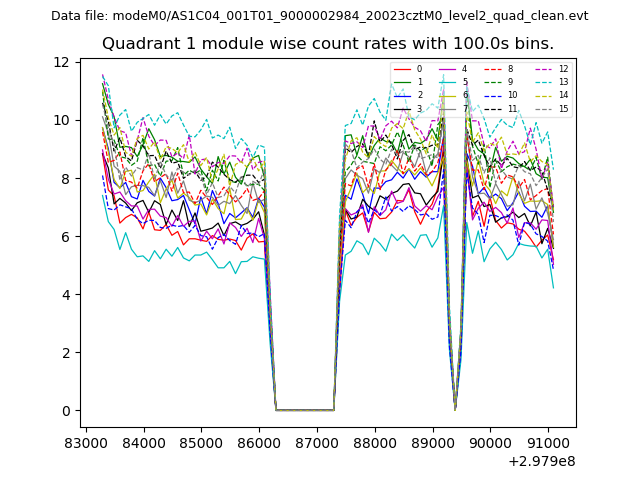
| Module-wise count rates for Quadrant A Data is divided into 100 sec bins |
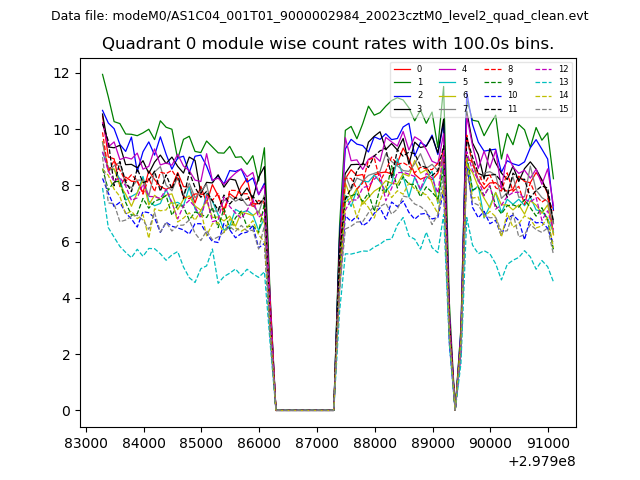 |
 |
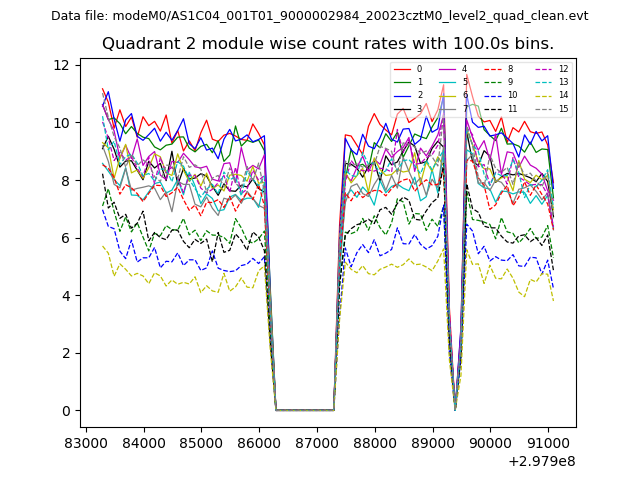
| Module-wise count rates for Quadrant B Data is divided into 100 sec bins |
 |
 |
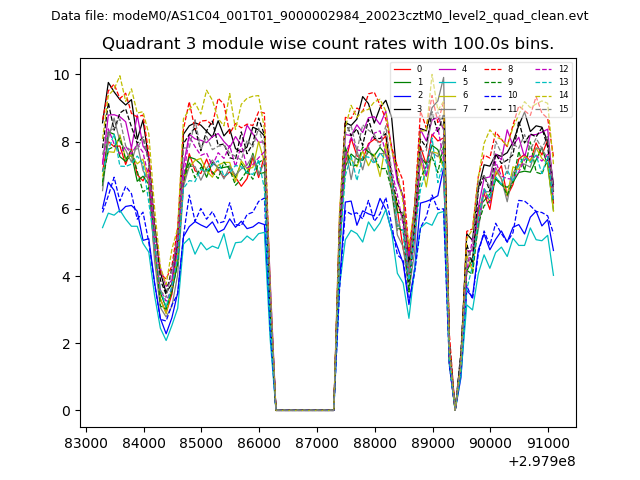
| Module-wise count rates for Quadrant C Data is divided into 100 sec bins |
 |
 |
| Module-wise count rates for Quadrant D Data is divided into 100 sec bins |
 |
 |
| Parameter | Plot |
|---|---|
| CZT HV Monitor | 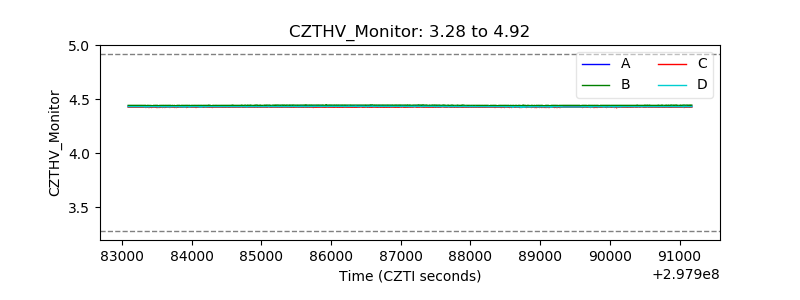 |
| D_VDD | 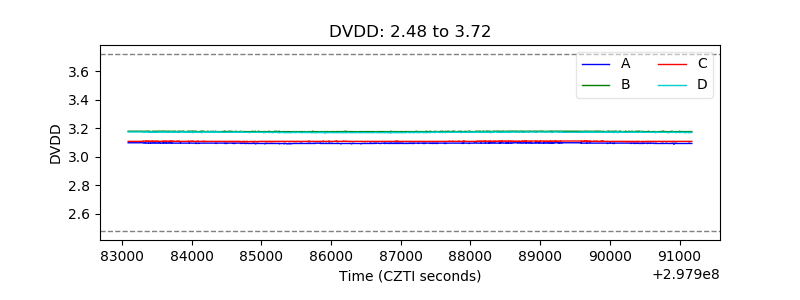 |
| Temperature 1 | 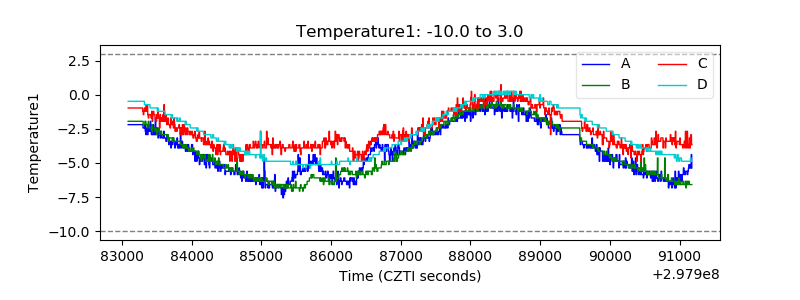 |
| Veto HV Monitor | 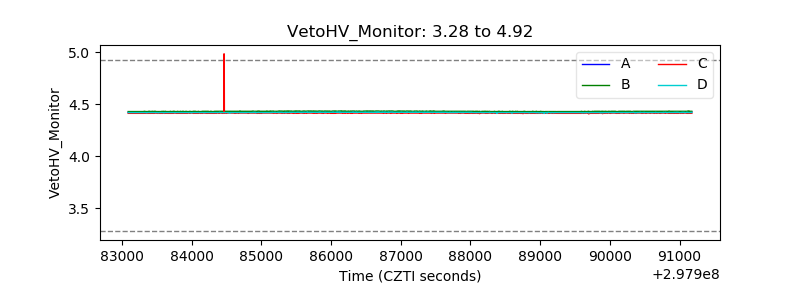 |
| Veto LLD | 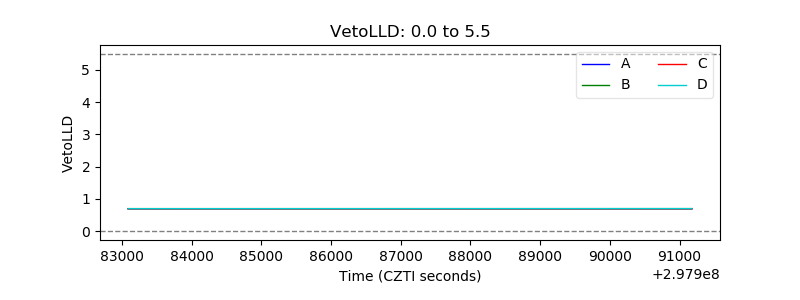 |
| Alpha Counter | 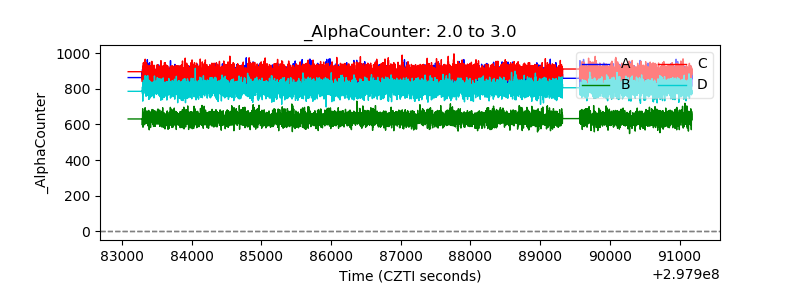 |
| _CPM_Rate | 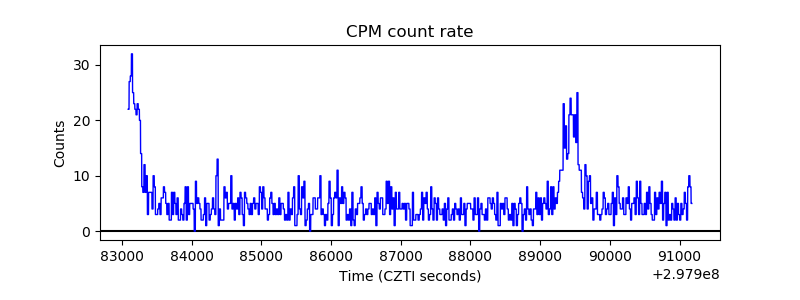 |
| CZT Counter | 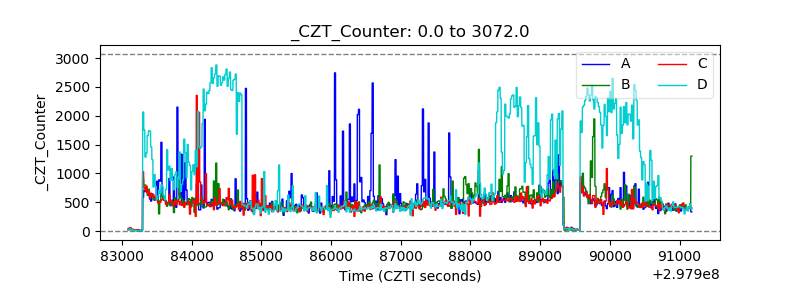 |
| +2.5 Volts monitor |  |
| +5 Volts monitor |  |
| _ROLL_ROT | 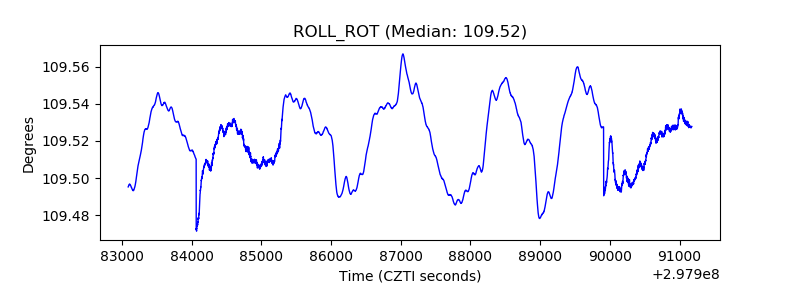 |
| _Roll_DEC | 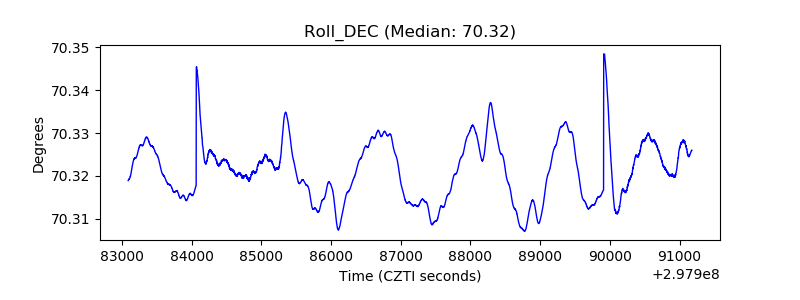 |
| _Roll_RA | 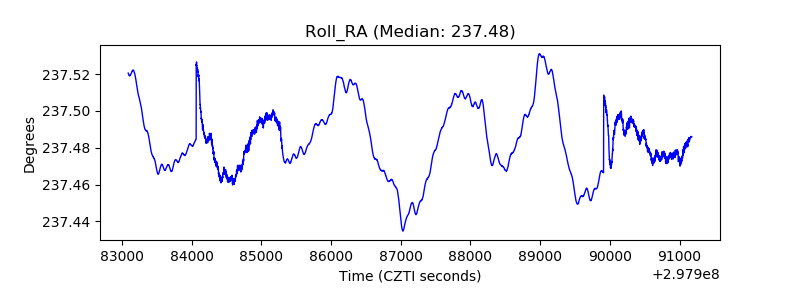 |
| Veto Counter | 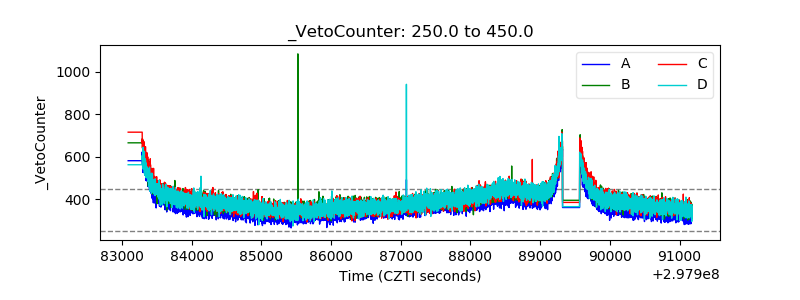 |