| Param | Original file | Final file |
|---|---|---|
| Filename | modeM0/AS1C04_001T01_9000002984_20024cztM0_level2.evt | modeM0/AS1C04_001T01_9000002984_20024cztM0_level2_quad_clean.evt |
| Size (bytes) | 683,190,720 | 123,500,160 |
| Size | 651.5 MB | 117.8 MB |
| Events in quadrant A | 3,912,445 | 831,203 |
| Events in quadrant B | 4,116,519 | 828,742 |
| Events in quadrant C | 3,701,429 | 824,481 |
| Events in quadrant D | 8,431,898 | 713,206 |
| Mode SS | |||
|---|---|---|---|
| Quadrant | BADHDUFLAG | Total packets | Discarded packets |
| A | 0 | 162 | 0 |
| B | 0 | 162 | 0 |
| C | 0 | 162 | 0 |
| D | 0 | 162 | 0 |
| Mode M9 | |||
|---|---|---|---|
| Quadrant | BADHDUFLAG | Total packets | Discarded packets |
| A | 0 | 6 | 0 |
| B | 0 | 6 | 0 |
| C | 0 | 6 | 0 |
| D | 0 | 6 | 0 |
| Mode M0 | |||
|---|---|---|---|
| Quadrant | BADHDUFLAG | Total packets | Discarded packets |
| A | 0 | 17038 | 2 |
| B | 0 | 17529 | 2 |
| C | 0 | 16271 | 2 |
| D | 0 | 30545 | 2 |
| Quadrant | Total seconds | Saturated seconds | Saturation percentage |
|---|---|---|---|
| A | 7786 | 115 | 1.477010% |
| B | 7787 | 123 | 1.579556% |
| C | 7787 | 108 | 1.386927% |
| D | 7787 | 1647 | 21.150636% |
Noise dominated data is calculated using 1-second bins in cleaned event files. If a bin has >2000 counts, and if more than 50% of those come from <1% of pixels, then it is considered to be noise-dominated and hence unusable.
| Quadrant | # 1 sec bins | Bins with >0 counts | Bins with >2000 counts | High rate bins dominated by noise | Noise dominated (total time) | Noise dominated (detector-on time) | Marked lightcurve |
|---|---|---|---|---|---|---|---|
| A | 8446 | 7788 | 46 | 46 | 0.54% | 0.59% |  |
| B | 8447 | 7789 | 27 | 27 | 0.32% | 0.35% |  |
| C | 8447 | 7789 | 1 | 1 | 0.01% | 0.01% | 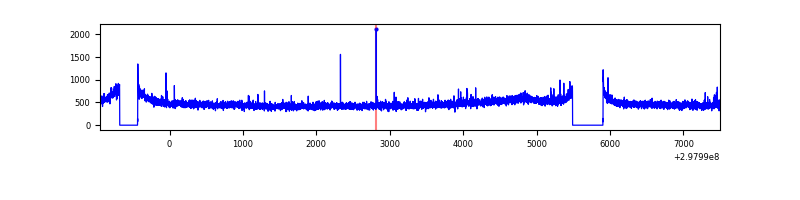 |
| D | 8447 | 7789 | 1467 | 1467 | 17.37% | 18.83% |  |
Top three noisy pixels from each quadrant. If the there are fewer than three noisy pixels in the level2.evt file, extra rows are filled as -1
| Pixel properties | Quadrant properties | ||||||
|---|---|---|---|---|---|---|---|
| Quadrant | DetID | PixID | Counts | Sigma | Mean | Median | Sigma |
| A | 14 | 254 | 175946 | 948.85 | 911 | 893 | 184.5 |
| A | 14 | 238 | 140384 | 756.09 | 911 | 893 | 184.5 |
| A | 5 | 16 | 68025 | 363.88 | 911 | 893 | 184.5 |
| B | 0 | 197 | 130620 | 744.58 | 913 | 889 | 174.2 |
| B | 0 | 189 | 121686 | 693.3 | 913 | 889 | 174.2 |
| B | 0 | 244 | 104193 | 592.9 | 913 | 889 | 174.2 |
| C | 14 | 238 | 138569 | 659.99 | 891 | 895 | 208.6 |
| C | 3 | 233 | 53213 | 250.8 | 891 | 895 | 208.6 |
| C | 0 | 207 | 30962 | 144.14 | 891 | 895 | 208.6 |
| D | 7 | 38 | 2125937 | 10743.46 | 814 | 790 | 197.8 |
| D | 1 | 52 | 1547976 | 7821.64 | 814 | 790 | 197.8 |
| D | 7 | 238 | 912778 | 4610.46 | 814 | 790 | 197.8 |
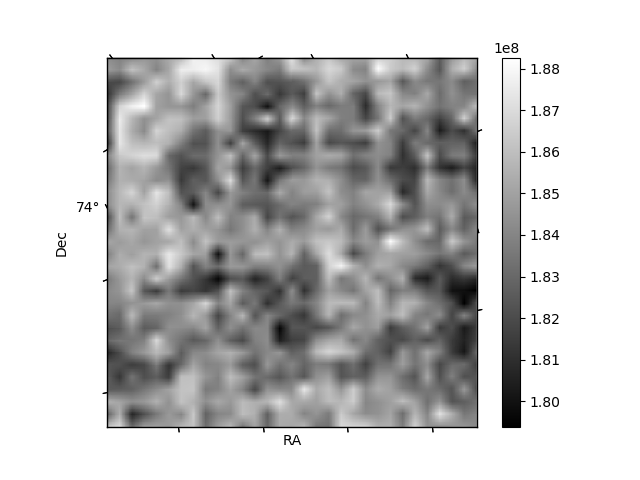
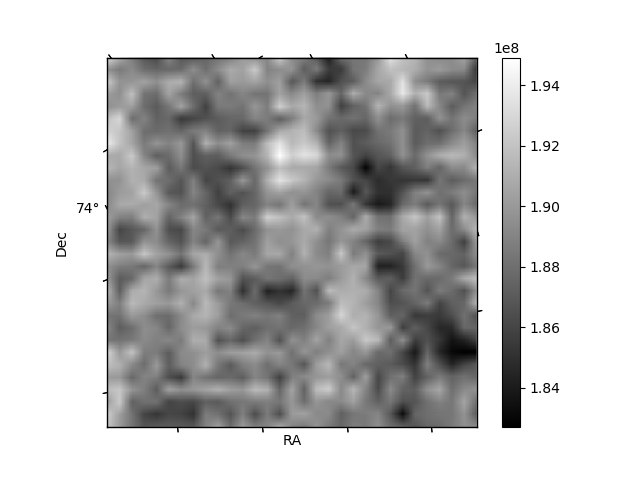
Histogram calculated using DETX and DETY for each event in the final _common_clean file
| Quadrant A | 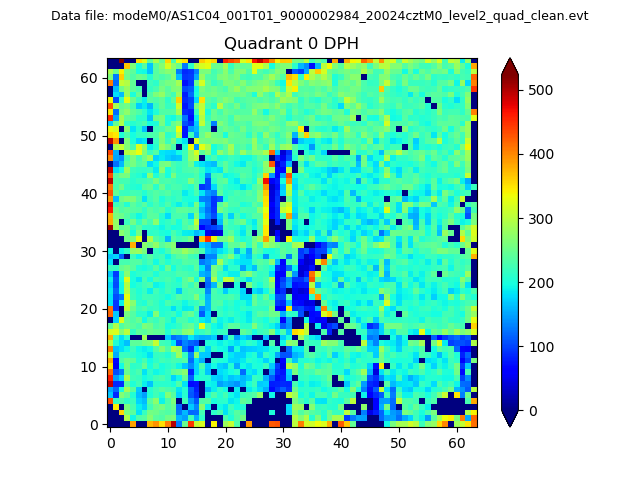 |
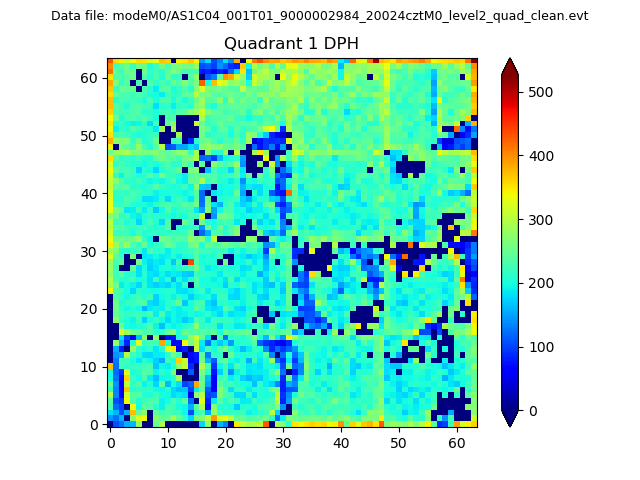 |
Quadrant B |
|---|---|---|---|
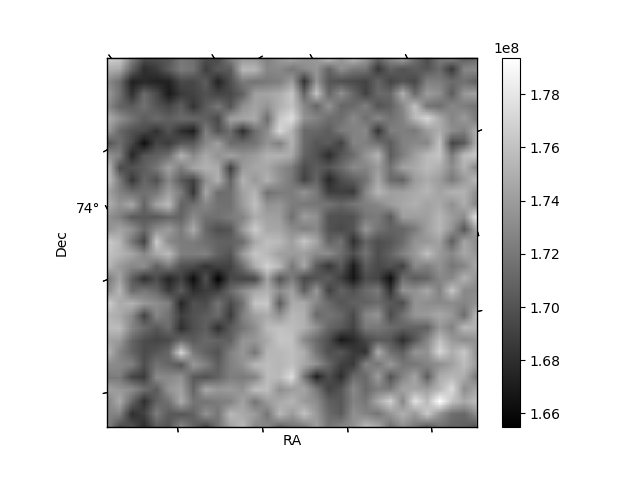
| Quadrant D | 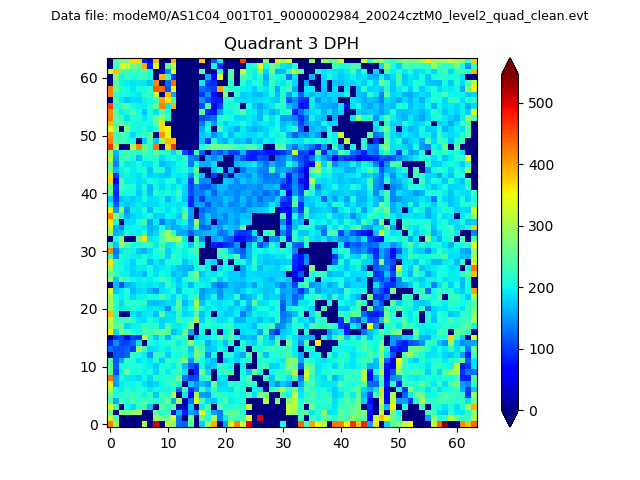 |
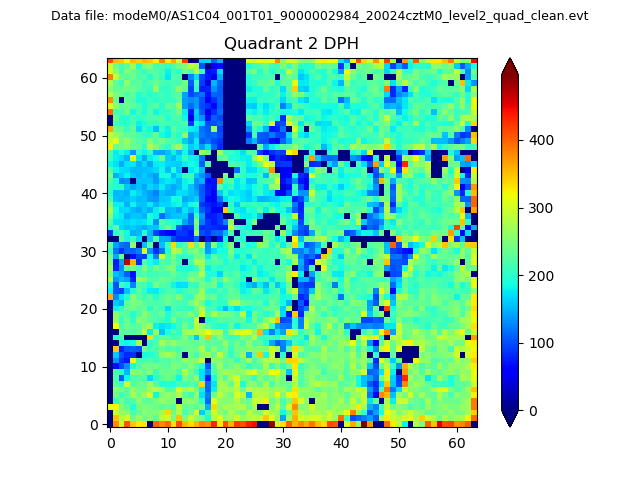 |
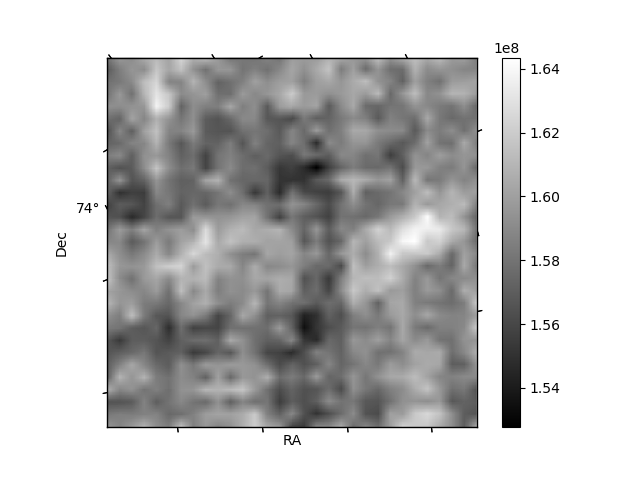
Quadrant C |
| Plot type | Count rate plots | Images |
|---|---|---|
| Comparison with Poisson distribution Blue bars denote a histogram of data divided into 1 sec bins. Red curve is a Poisson curve with rate = median count rate of data. |
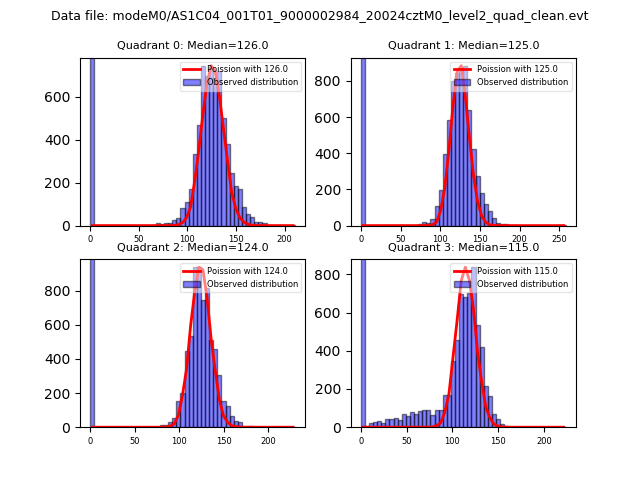 |
 |
| Quadrant-wise count rates Data is divided into 100 sec bins |
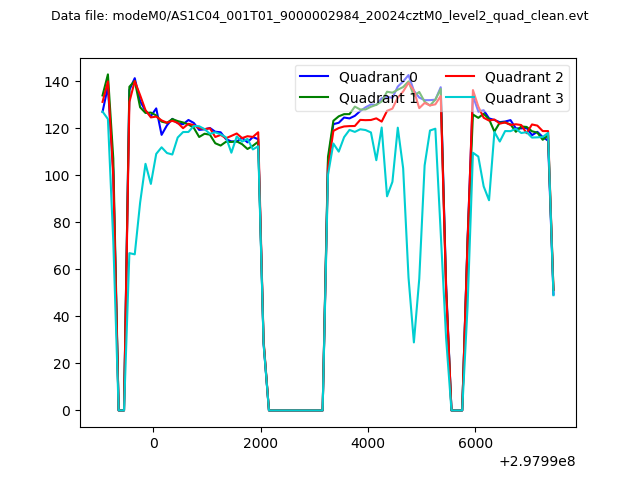 |
|
| Module-wise count rates for Quadrant A Data is divided into 100 sec bins |
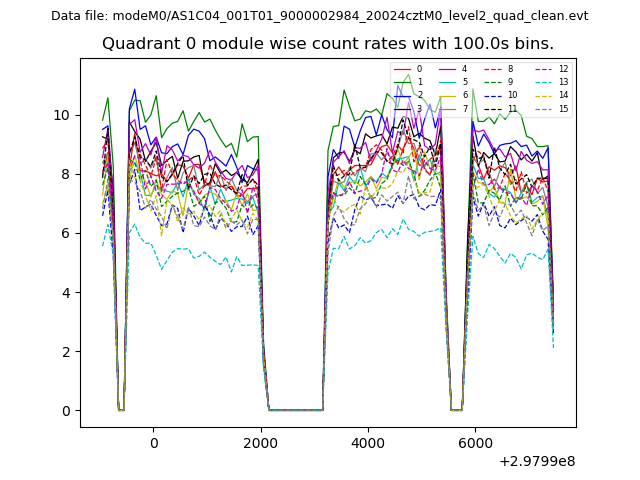 |
 |
| Module-wise count rates for Quadrant B Data is divided into 100 sec bins |
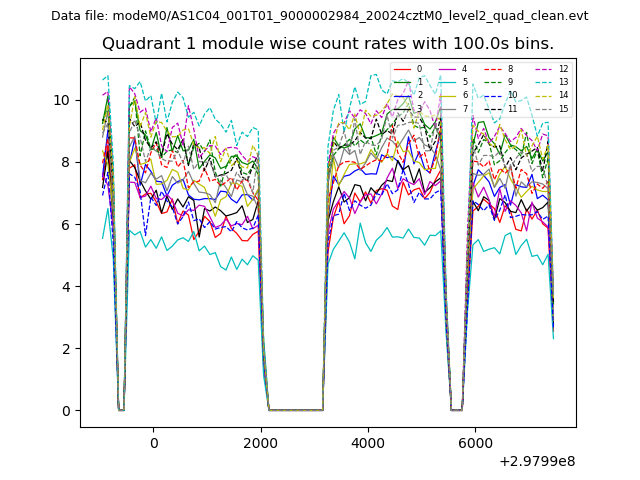 |
 |
| Module-wise count rates for Quadrant C Data is divided into 100 sec bins |
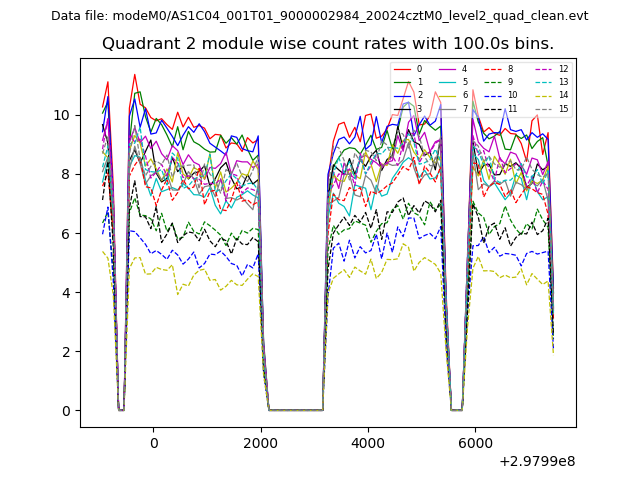 |
 |
| Module-wise count rates for Quadrant D Data is divided into 100 sec bins |
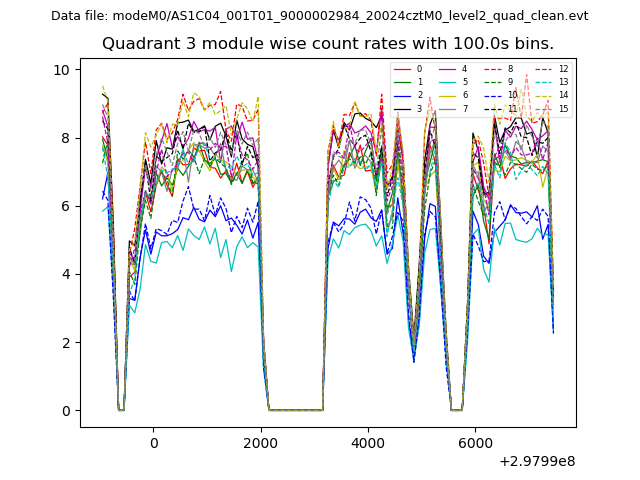 |
 |
| Parameter | Plot |
|---|---|
| CZT HV Monitor | 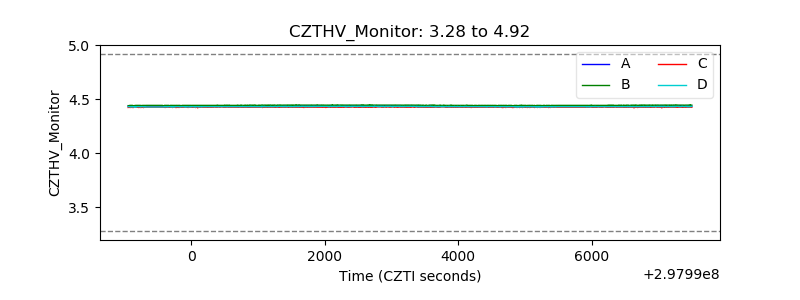 |
| D_VDD | 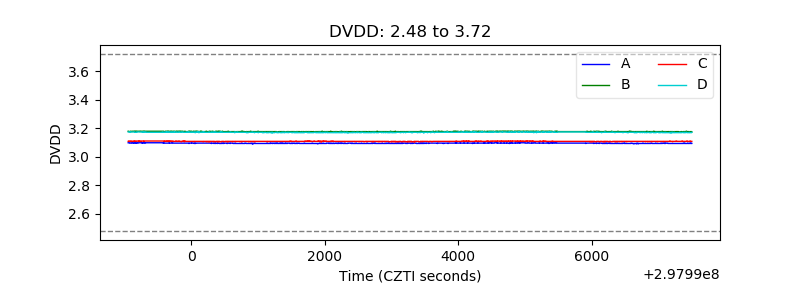 |
| Temperature 1 | 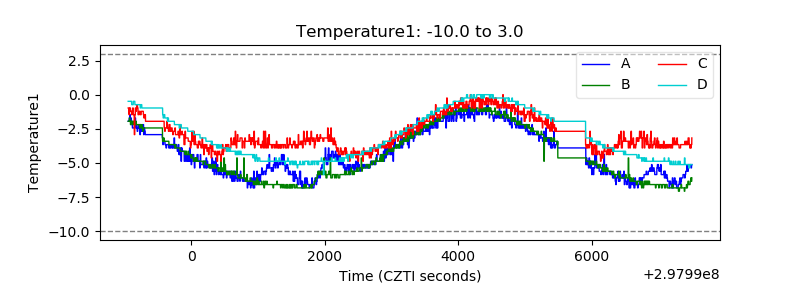 |
| Veto HV Monitor | 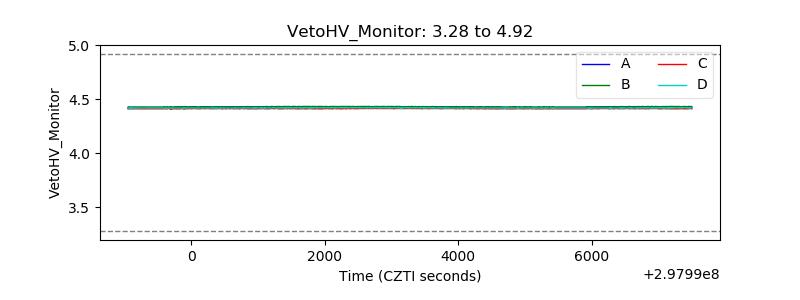 |
| Veto LLD | 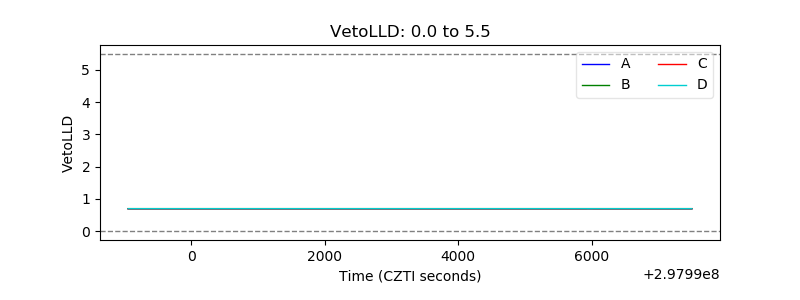 |
| Alpha Counter | 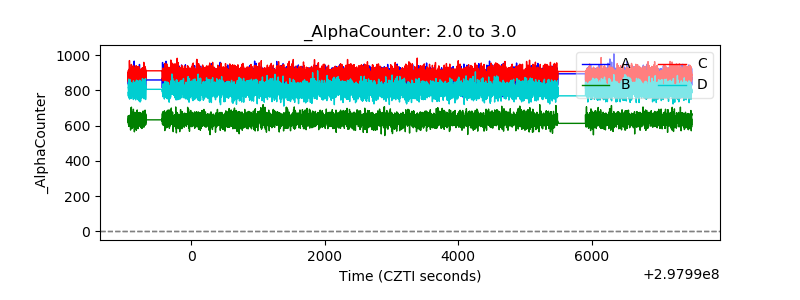 |
| _CPM_Rate | 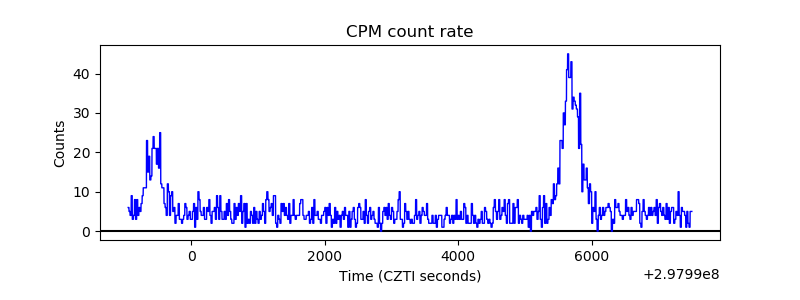 |
| CZT Counter | 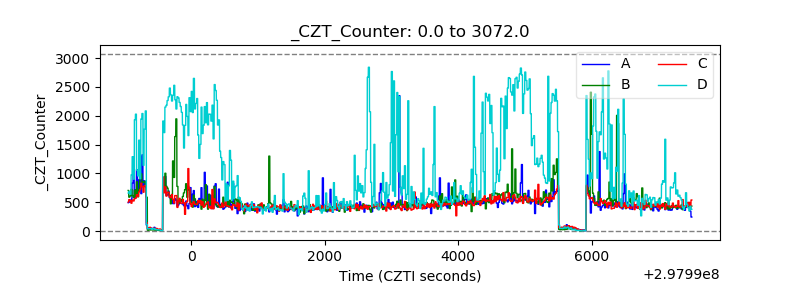 |
| +2.5 Volts monitor |  |
| +5 Volts monitor |  |
| _ROLL_ROT | 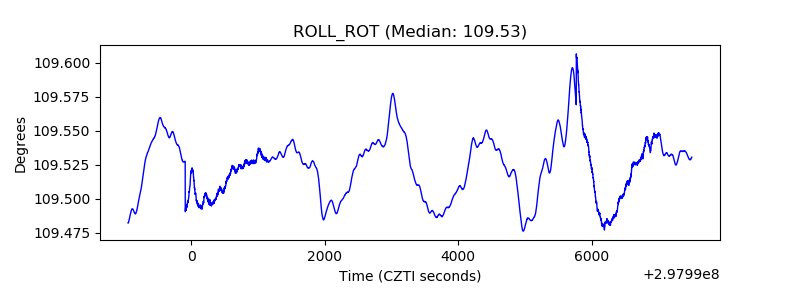 |
| _Roll_DEC | 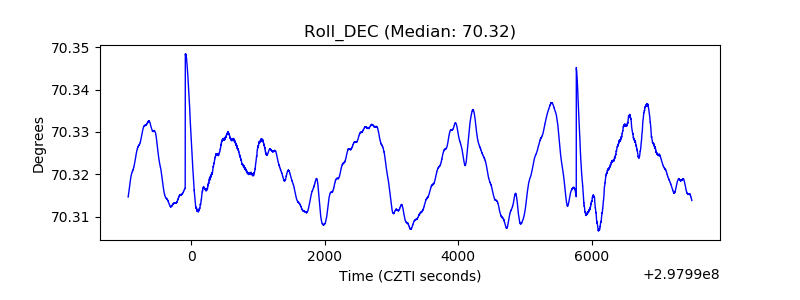 |
| _Roll_RA | 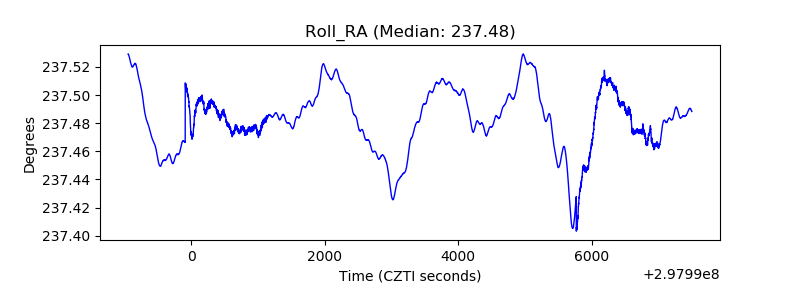 |
| Veto Counter | 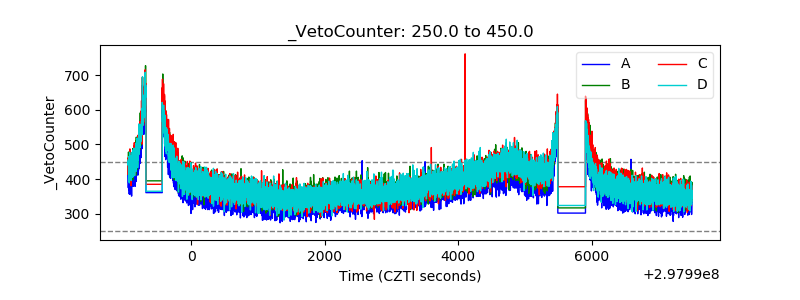 |