| Param | Original file | Final file |
|---|---|---|
| Filename | modeM0/AS1C04_001T01_9000002984_20026cztM0_level2.evt | modeM0/AS1C04_001T01_9000002984_20026cztM0_level2_quad_clean.evt |
| Size (bytes) | 978,408,000 | 186,865,920 |
| Size | 933.1 MB | 178.2 MB |
| Events in quadrant A | 5,859,377 | 1,246,033 |
| Events in quadrant B | 6,463,462 | 1,241,240 |
| Events in quadrant C | 5,737,917 | 1,226,302 |
| Events in quadrant D | 10,743,135 | 1,099,818 |
| Mode SS | |||
|---|---|---|---|
| Quadrant | BADHDUFLAG | Total packets | Discarded packets |
| A | 0 | 252 | 0 |
| B | 0 | 252 | 0 |
| C | 0 | 252 | 0 |
| D | 0 | 252 | 0 |
| Mode M9 | |||
|---|---|---|---|
| Quadrant | BADHDUFLAG | Total packets | Discarded packets |
| A | 0 | 17 | 0 |
| B | 0 | 17 | 0 |
| C | 0 | 17 | 0 |
| D | 0 | 17 | 0 |
| Mode M0 | |||
|---|---|---|---|
| Quadrant | BADHDUFLAG | Total packets | Discarded packets |
| A | 0 | 25734 | 7 |
| B | 0 | 27349 | 7 |
| C | 0 | 25177 | 7 |
| D | 0 | 40623 | 7 |
| Quadrant | Total seconds | Saturated seconds | Saturation percentage |
|---|---|---|---|
| A | 12222 | 138 | 1.129111% |
| B | 12222 | 217 | 1.775487% |
| C | 12223 | 154 | 1.259920% |
| D | 12223 | 2053 | 16.796204% |
Noise dominated data is calculated using 1-second bins in cleaned event files. If a bin has >2000 counts, and if more than 50% of those come from <1% of pixels, then it is considered to be noise-dominated and hence unusable.
| Quadrant | # 1 sec bins | Bins with >0 counts | Bins with >2000 counts | High rate bins dominated by noise | Noise dominated (total time) | Noise dominated (detector-on time) | Marked lightcurve |
|---|---|---|---|---|---|---|---|
| A | 13918 | 12226 | 48 | 48 | 0.34% | 0.39% | 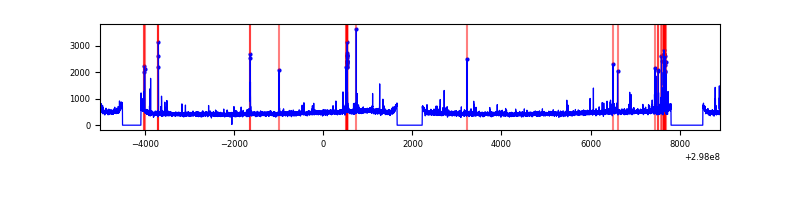 |
| B | 13918 | 12226 | 48 | 48 | 0.34% | 0.39% | 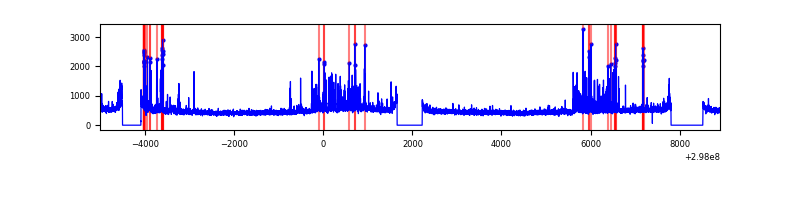 |
| C | 13918 | 12226 | 0 | 0 | 0.00% | 0.00% | 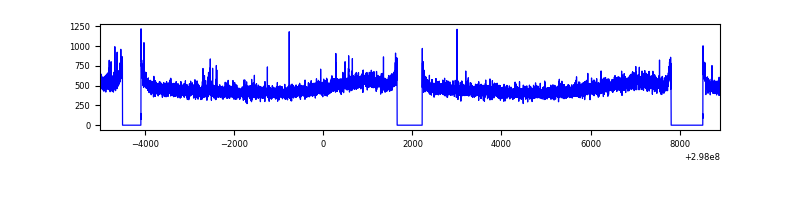 |
| D | 13919 | 12227 | 1734 | 1734 | 12.46% | 14.18% | 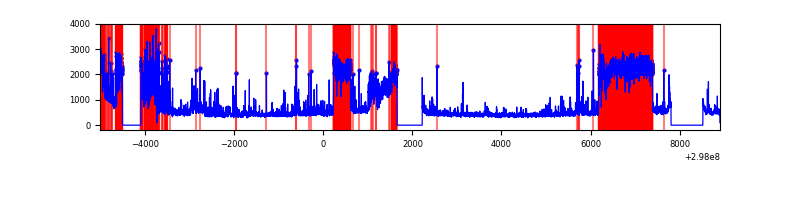 |
Top three noisy pixels from each quadrant. If the there are fewer than three noisy pixels in the level2.evt file, extra rows are filled as -1
| Pixel properties | Quadrant properties | ||||||
|---|---|---|---|---|---|---|---|
| Quadrant | DetID | PixID | Counts | Sigma | Mean | Median | Sigma |
| A | 14 | 254 | 128521 | 439.98 | 1434 | 1399 | 288.9 |
| A | 5 | 16 | 102177 | 348.8 | 1434 | 1399 | 288.9 |
| A | 14 | 238 | 80655 | 274.31 | 1434 | 1399 | 288.9 |
| B | 7 | 220 | 304240 | 1109.4 | 1431 | 1393 | 273.0 |
| B | 0 | 189 | 115867 | 419.34 | 1431 | 1393 | 273.0 |
| B | 0 | 197 | 111819 | 404.52 | 1431 | 1393 | 273.0 |
| C | 14 | 238 | 215347 | 660.44 | 1392 | 1395 | 324.0 |
| C | 3 | 233 | 66311 | 200.39 | 1392 | 1395 | 324.0 |
| C | 0 | 207 | 26945 | 78.87 | 1392 | 1395 | 324.0 |
| D | 7 | 38 | 3861965 | 12056.59 | 1326 | 1289 | 320.2 |
| D | 1 | 52 | 799690 | 2493.34 | 1326 | 1289 | 320.2 |
| D | 7 | 238 | 490088 | 1526.48 | 1326 | 1289 | 320.2 |
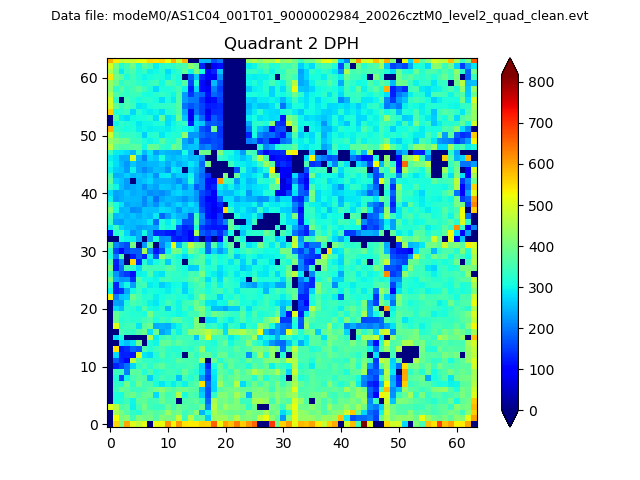
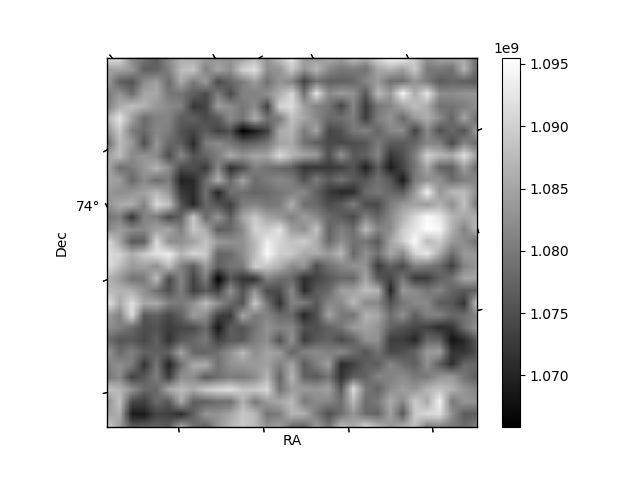
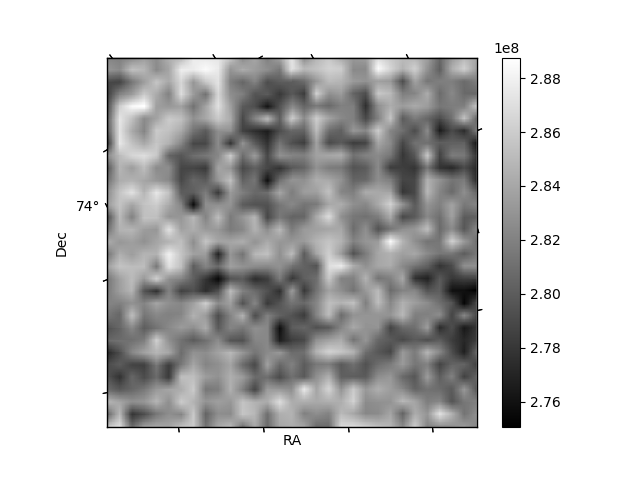
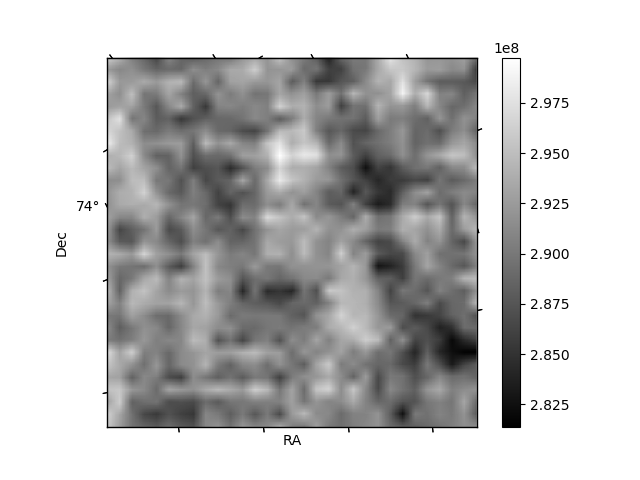
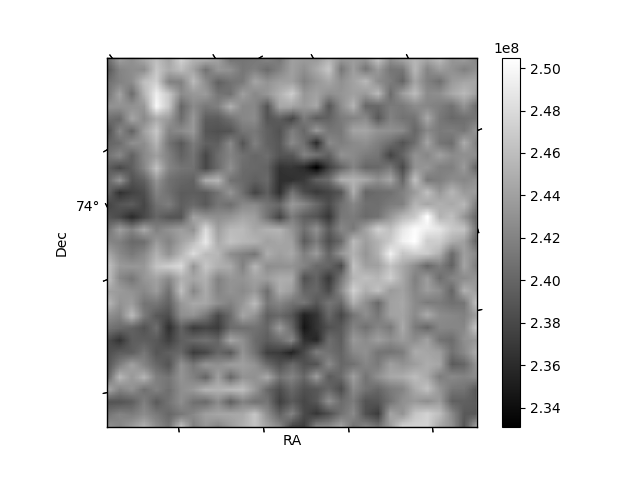
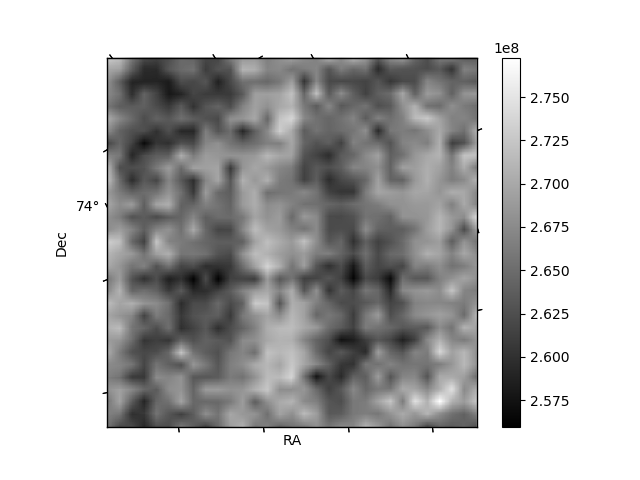
Histogram calculated using DETX and DETY for each event in the final _common_clean file
| Quadrant A | 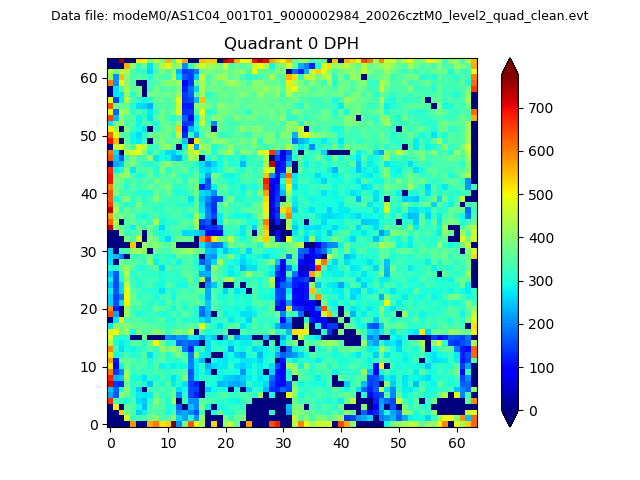 |
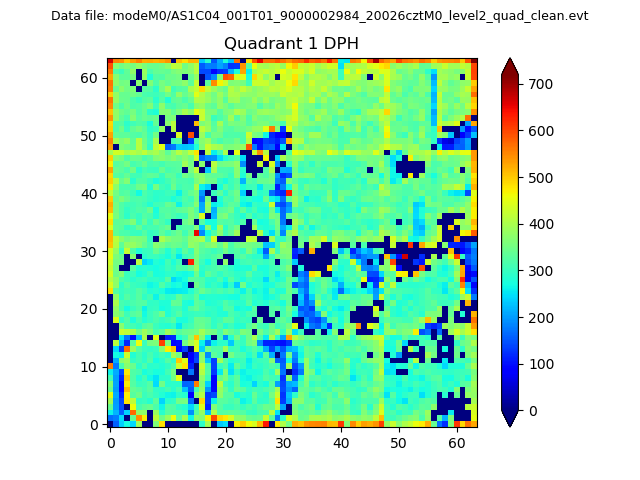 |
Quadrant B |
|---|---|---|---|
| Quadrant D | 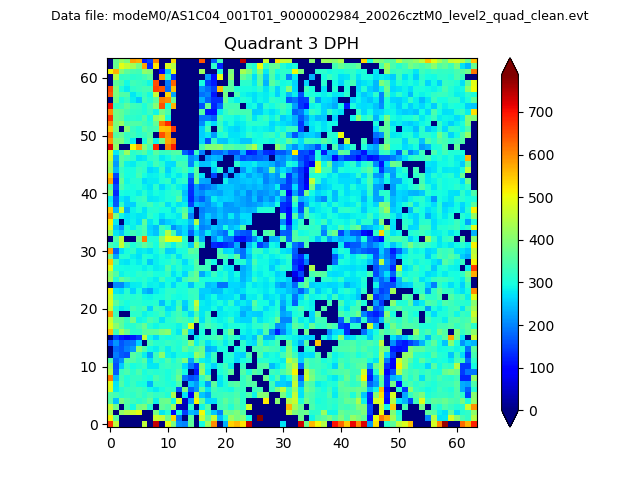 |
 |
Quadrant C |
| Plot type | Count rate plots | Images |
|---|---|---|
| Comparison with Poisson distribution Blue bars denote a histogram of data divided into 1 sec bins. Red curve is a Poisson curve with rate = median count rate of data. |
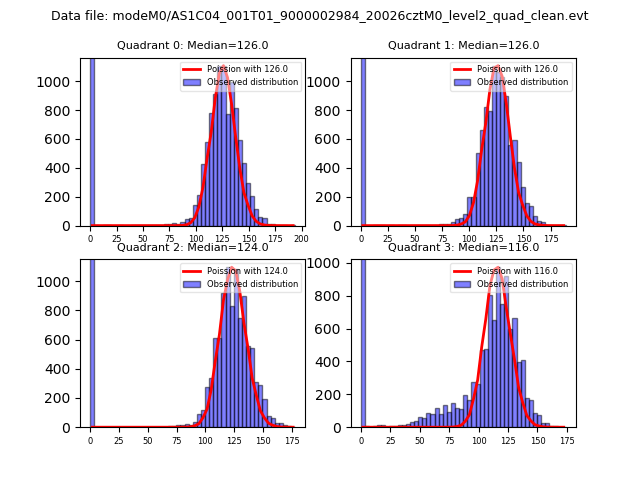 |
 |
| Quadrant-wise count rates Data is divided into 100 sec bins |
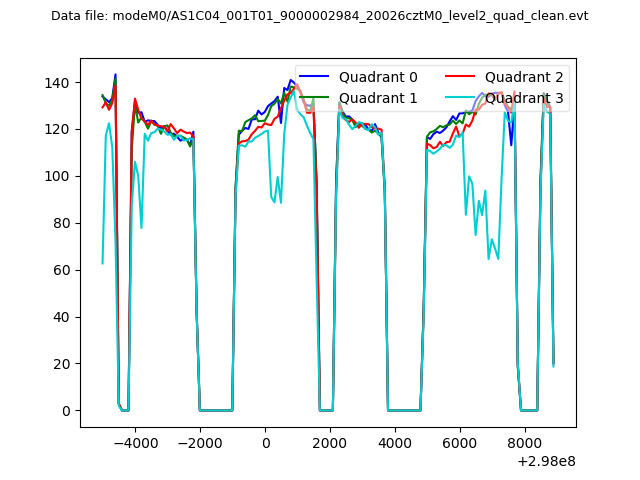 |
|
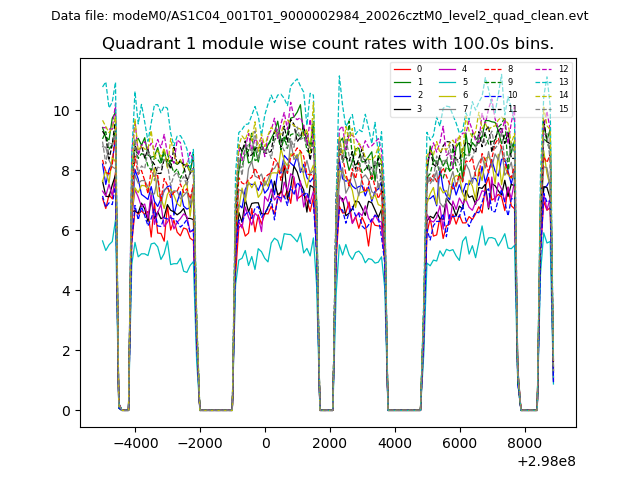
| Module-wise count rates for Quadrant A Data is divided into 100 sec bins |
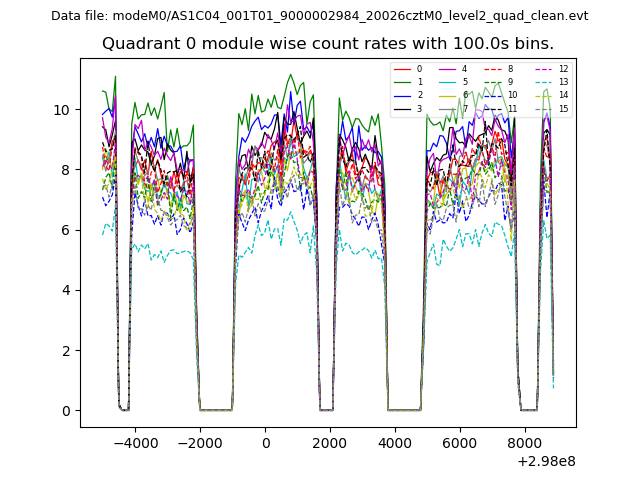 |
 |
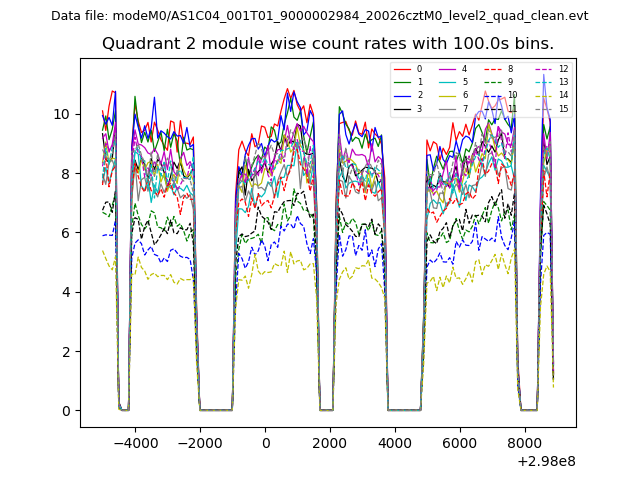
| Module-wise count rates for Quadrant B Data is divided into 100 sec bins |
 |
 |
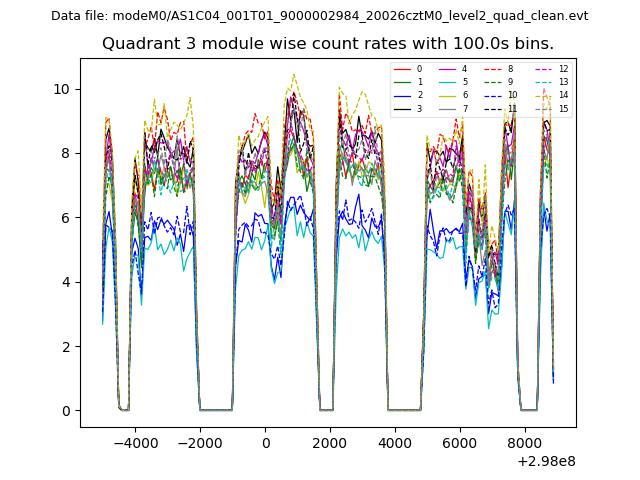
| Module-wise count rates for Quadrant C Data is divided into 100 sec bins |
 |
 |
| Module-wise count rates for Quadrant D Data is divided into 100 sec bins |
 |
 |
| Parameter | Plot |
|---|---|
| CZT HV Monitor | 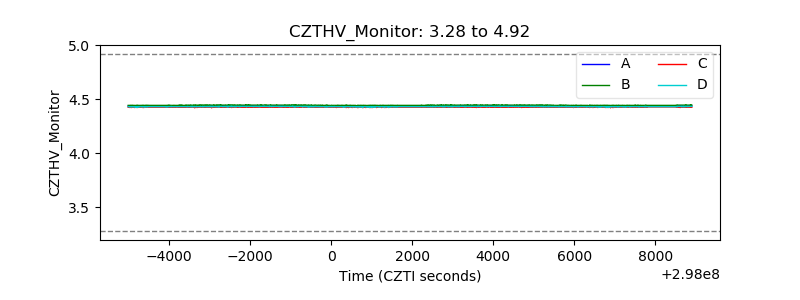 |
| D_VDD | 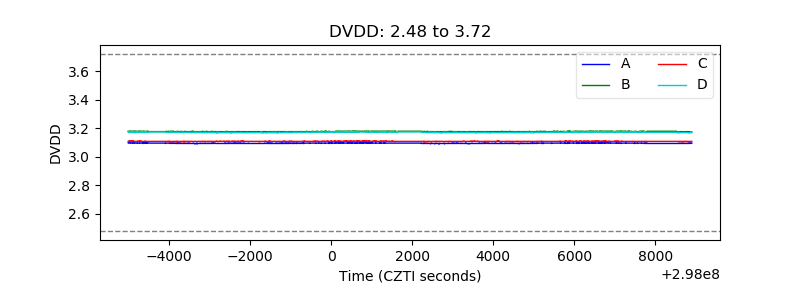 |
| Temperature 1 | 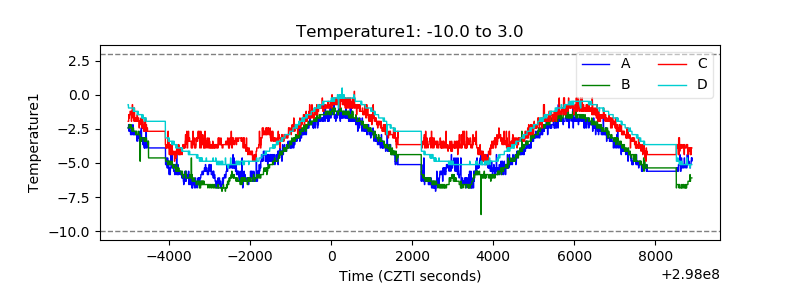 |
| Veto HV Monitor | 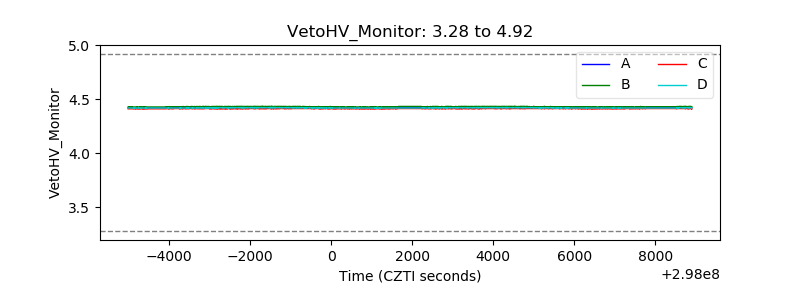 |
| Veto LLD | 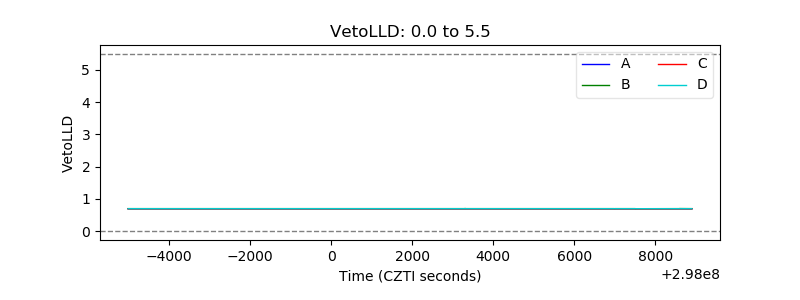 |
| Alpha Counter | 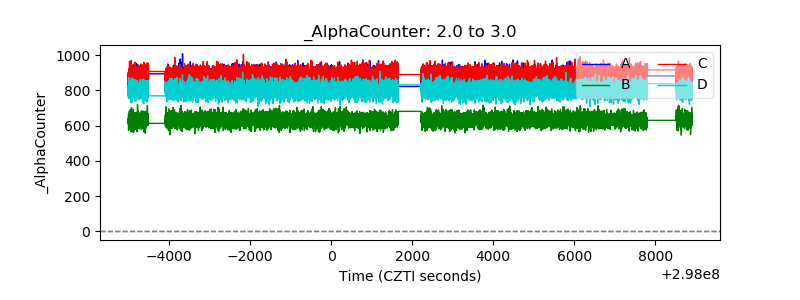 |
| _CPM_Rate | 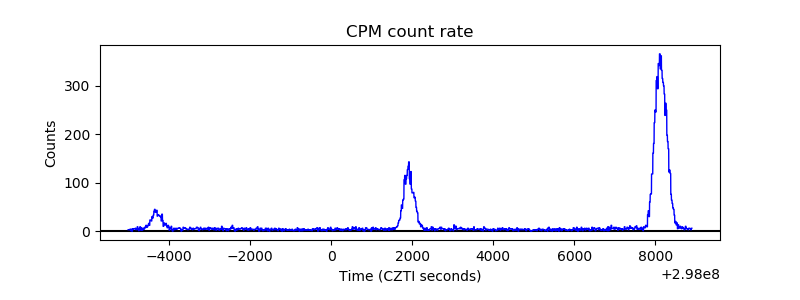 |
| CZT Counter | 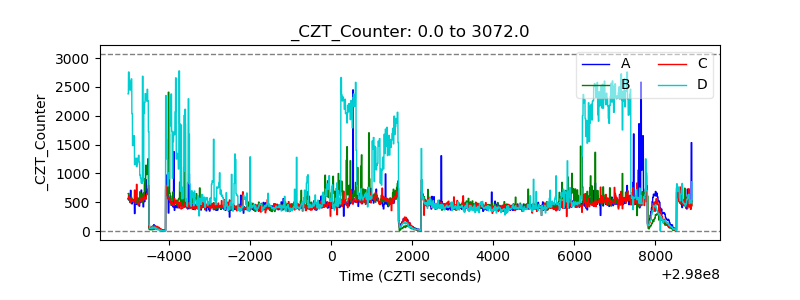 |
| +2.5 Volts monitor | 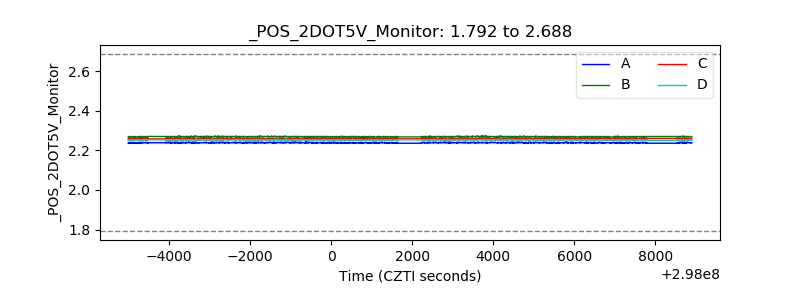 |
| +5 Volts monitor | 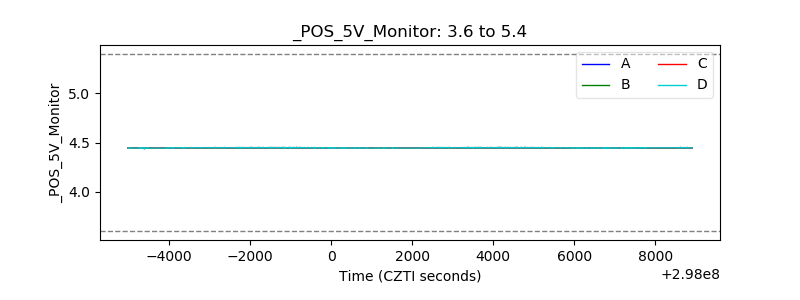 |
| _ROLL_ROT | 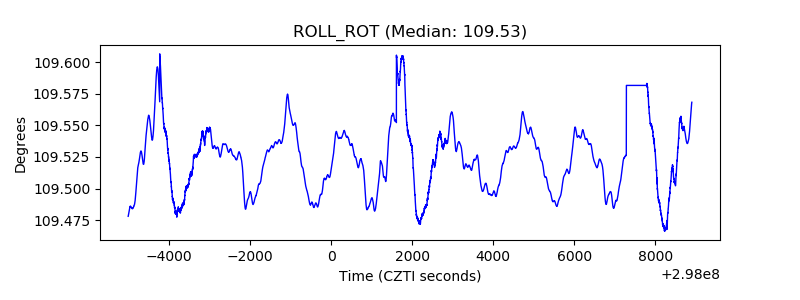 |
| _Roll_DEC | 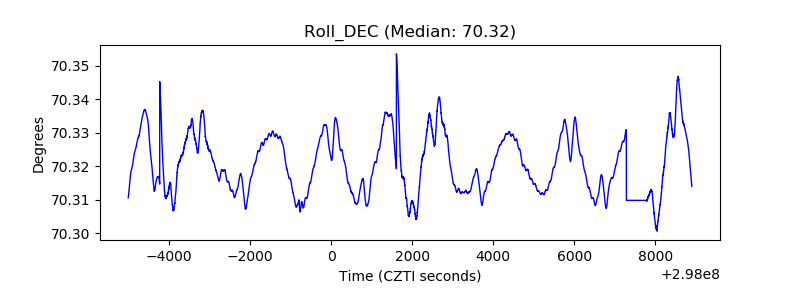 |
| _Roll_RA | 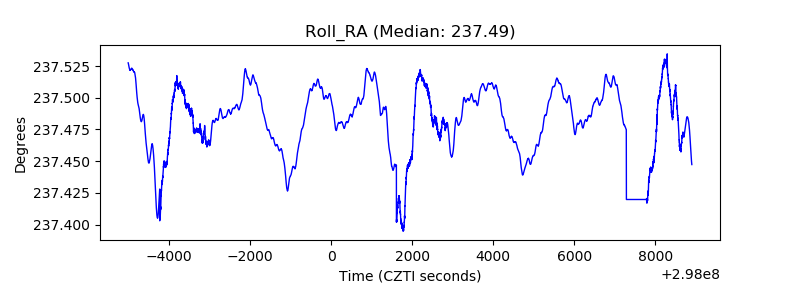 |
| Veto Counter | 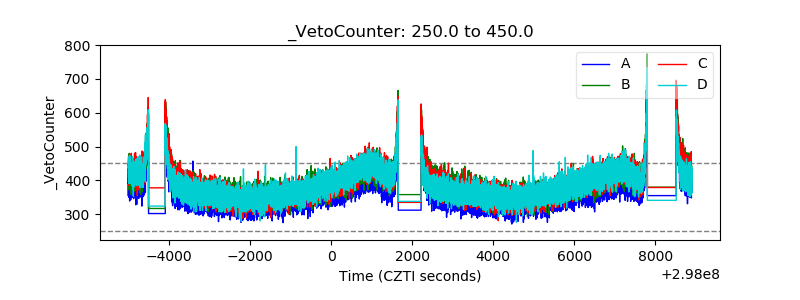 |