| Param | Original file | Final file |
|---|---|---|
| Filename | modeM0/AS1C04_001T01_9000002984_20027cztM0_level2.evt | modeM0/AS1C04_001T01_9000002984_20027cztM0_level2_quad_clean.evt |
| Size (bytes) | 506,839,680 | 82,874,880 |
| Size | 483.4 MB | 79.0 MB |
| Events in quadrant A | 3,274,184 | 539,189 |
| Events in quadrant B | 2,947,451 | 541,325 |
| Events in quadrant C | 2,900,643 | 525,723 |
| Events in quadrant D | 5,805,586 | 469,456 |
| Mode SS | |||
|---|---|---|---|
| Quadrant | BADHDUFLAG | Total packets | Discarded packets |
| A | 0 | 126 | 0 |
| B | 0 | 126 | 0 |
| C | 0 | 126 | 0 |
| D | 0 | 126 | 0 |
| Mode M9 | |||
|---|---|---|---|
| Quadrant | BADHDUFLAG | Total packets | Discarded packets |
| A | 0 | 9 | 0 |
| B | 0 | 9 | 0 |
| C | 0 | 9 | 0 |
| D | 0 | 9 | 0 |
| Mode M0 | |||
|---|---|---|---|
| Quadrant | BADHDUFLAG | Total packets | Discarded packets |
| A | 0 | 13872 | 1 |
| B | 0 | 12767 | 1 |
| C | 0 | 12610 | 2 |
| D | 0 | 21390 | 1 |
| Quadrant | Total seconds | Saturated seconds | Saturation percentage |
|---|---|---|---|
| A | 6210 | 140 | 2.254428% |
| B | 6211 | 69 | 1.110932% |
| C | 6210 | 73 | 1.175523% |
| D | 6210 | 1135 | 18.276973% |
Noise dominated data is calculated using 1-second bins in cleaned event files. If a bin has >2000 counts, and if more than 50% of those come from <1% of pixels, then it is considered to be noise-dominated and hence unusable.
| Quadrant | # 1 sec bins | Bins with >0 counts | Bins with >2000 counts | High rate bins dominated by noise | Noise dominated (total time) | Noise dominated (detector-on time) | Marked lightcurve |
|---|---|---|---|---|---|---|---|
| A | 7105 | 6211 | 75 | 75 | 1.06% | 1.21% | 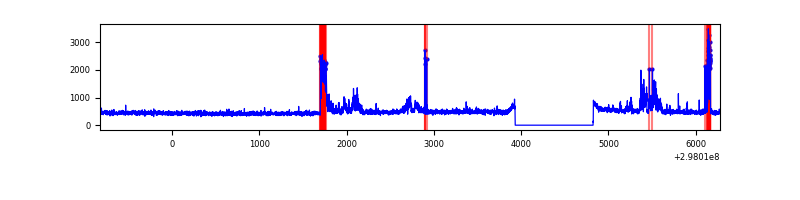 |
| B | 7106 | 6212 | 4 | 4 | 0.06% | 0.06% | 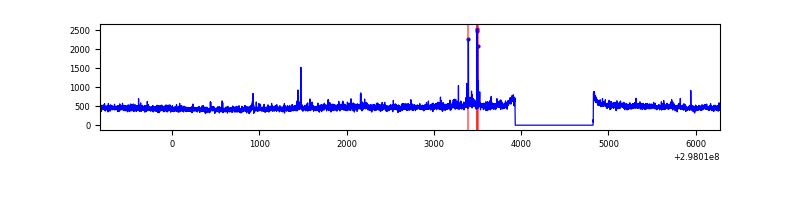 |
| C | 7106 | 6212 | 0 | 0 | 0.00% | 0.00% | 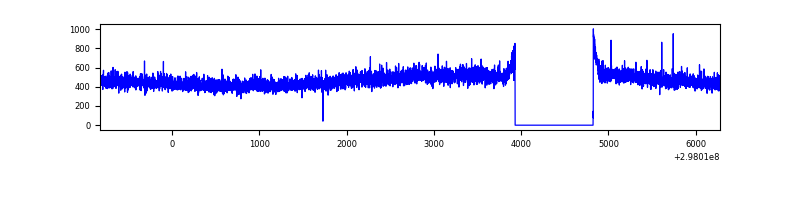 |
| D | 7106 | 6212 | 1075 | 1075 | 15.13% | 17.31% | 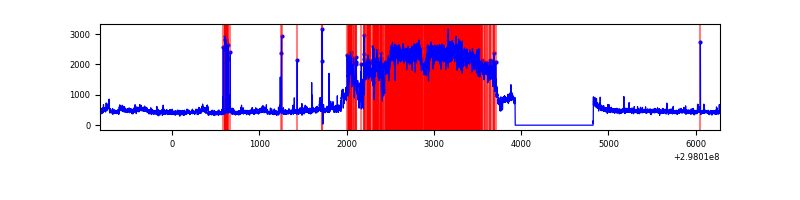 |
Top three noisy pixels from each quadrant. If the there are fewer than three noisy pixels in the level2.evt file, extra rows are filled as -1
| Pixel properties | Quadrant properties | ||||||
|---|---|---|---|---|---|---|---|
| Quadrant | DetID | PixID | Counts | Sigma | Mean | Median | Sigma |
| A | 5 | 16 | 242833 | 1623.75 | 732 | 716 | 149.1 |
| A | 14 | 238 | 195819 | 1308.46 | 732 | 716 | 149.1 |
| A | 11 | 29 | 11137 | 69.89 | 732 | 716 | 149.1 |
| B | 7 | 220 | 24643 | 170.23 | 732 | 712 | 140.6 |
| B | 0 | 189 | 21837 | 150.27 | 732 | 712 | 140.6 |
| B | 0 | 197 | 17329 | 118.2 | 732 | 712 | 140.6 |
| C | 14 | 238 | 110096 | 659.95 | 705 | 708 | 165.8 |
| C | 3 | 233 | 39437 | 233.65 | 705 | 708 | 165.8 |
| C | 13 | 61 | 5074 | 26.34 | 705 | 708 | 165.8 |
| D | 7 | 38 | 2690560 | 16251.21 | 681 | 660 | 165.5 |
| D | 8 | 195 | 143533 | 863.18 | 681 | 660 | 165.5 |
| D | 12 | 227 | 123526 | 742.3 | 681 | 660 | 165.5 |
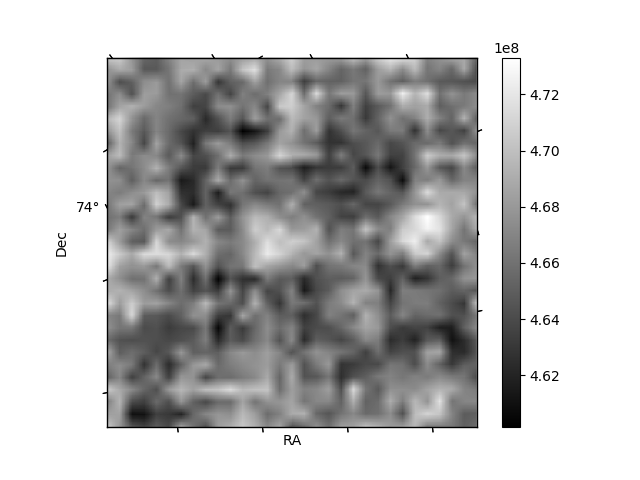
Histogram calculated using DETX and DETY for each event in the final _common_clean file
| Quadrant A | 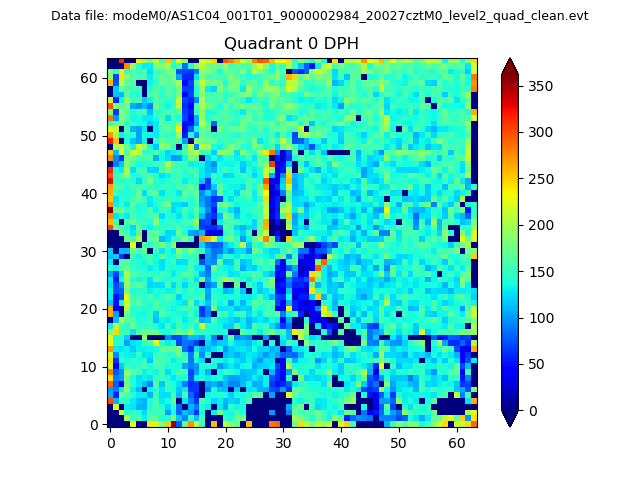 |
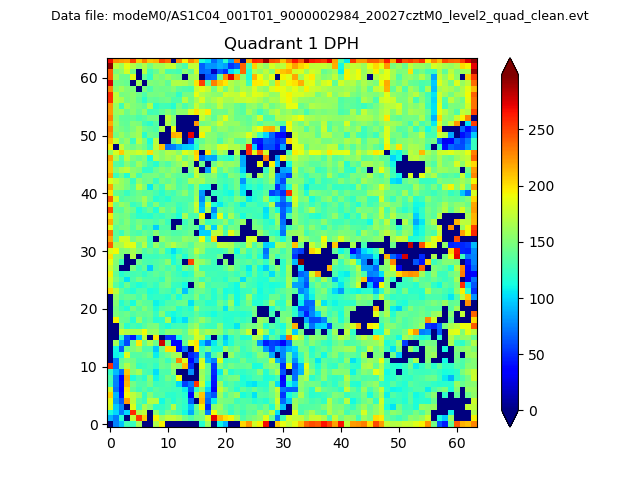 |
Quadrant B |
|---|---|---|---|
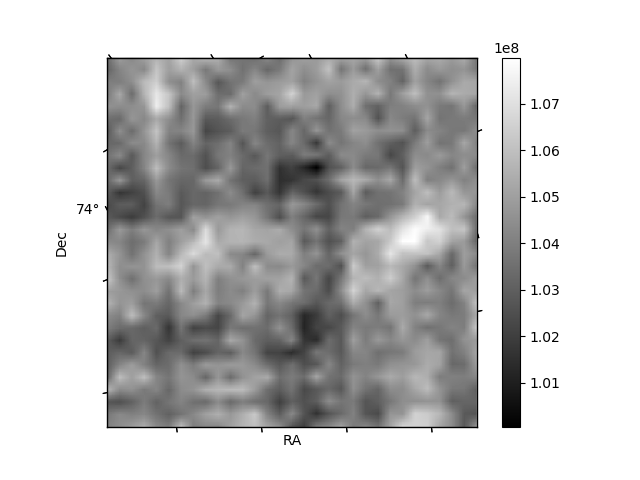
| Quadrant D |  |
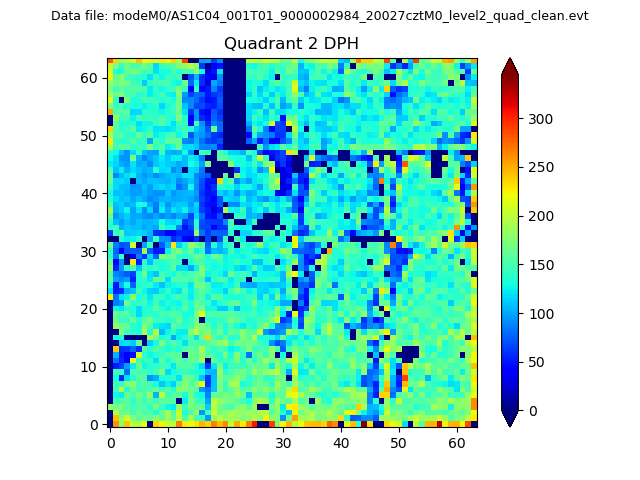 |
Quadrant C |
| Plot type | Count rate plots | Images |
|---|---|---|
| Comparison with Poisson distribution Blue bars denote a histogram of data divided into 1 sec bins. Red curve is a Poisson curve with rate = median count rate of data. |
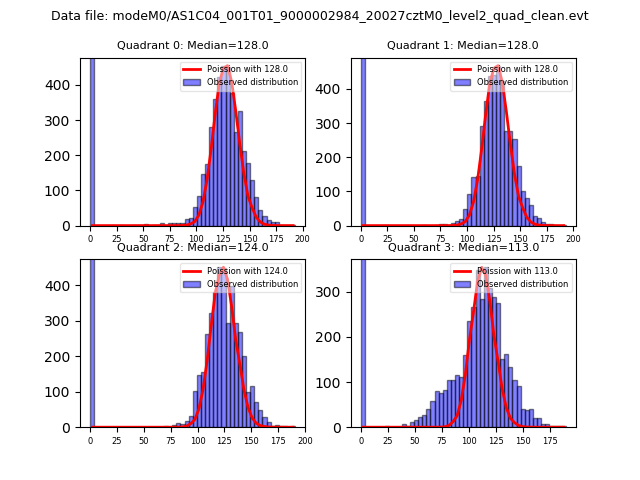 |
 |
| Quadrant-wise count rates Data is divided into 100 sec bins |
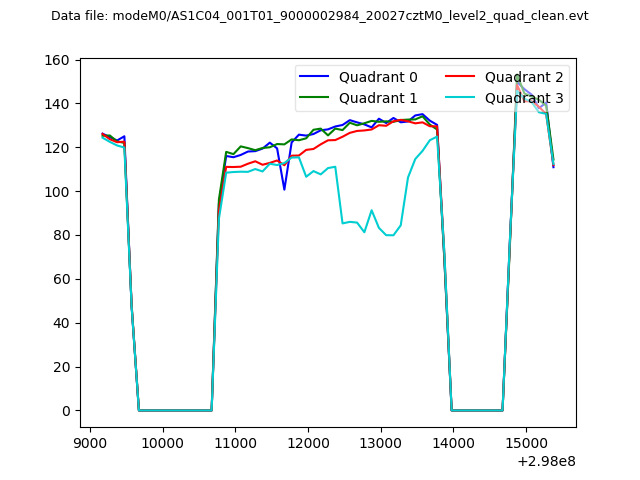 |
|
| Module-wise count rates for Quadrant A Data is divided into 100 sec bins |
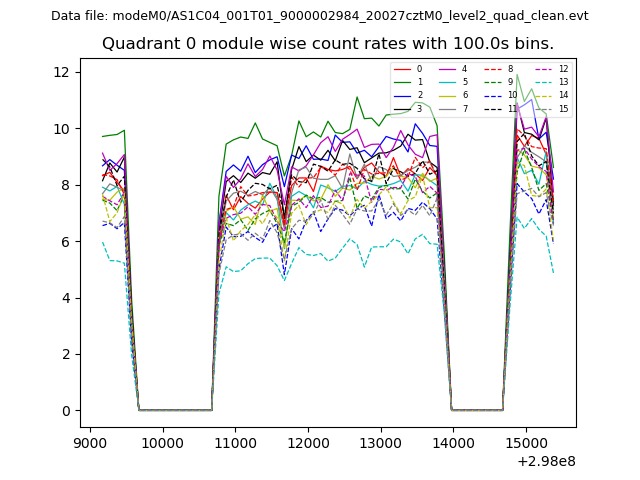 |
 |
| Module-wise count rates for Quadrant B Data is divided into 100 sec bins |
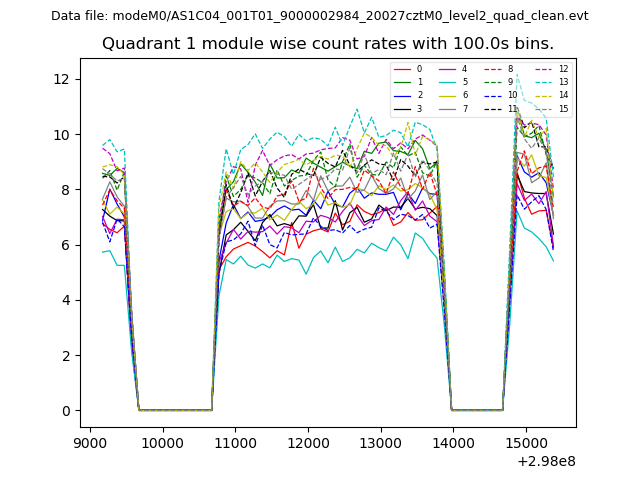 |
 |
| Module-wise count rates for Quadrant C Data is divided into 100 sec bins |
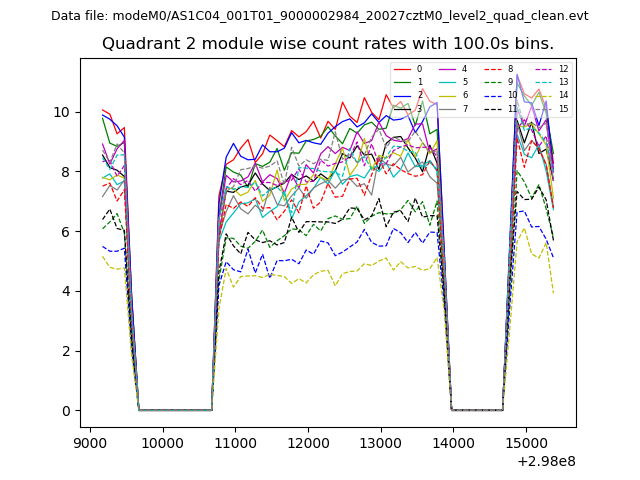 |
 |
| Module-wise count rates for Quadrant D Data is divided into 100 sec bins |
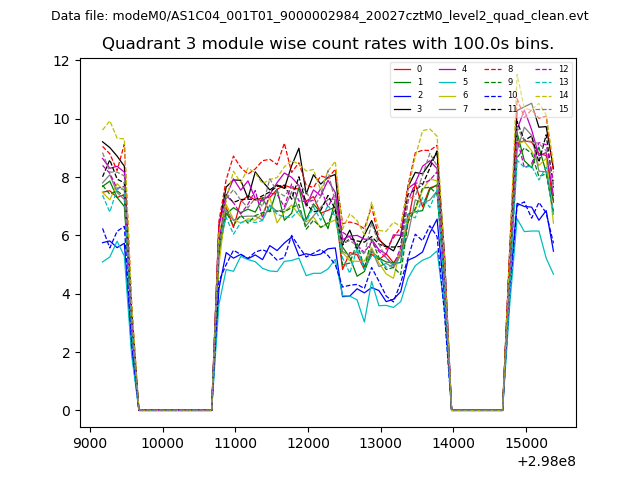 |
 |
| Parameter | Plot |
|---|---|
| CZT HV Monitor | 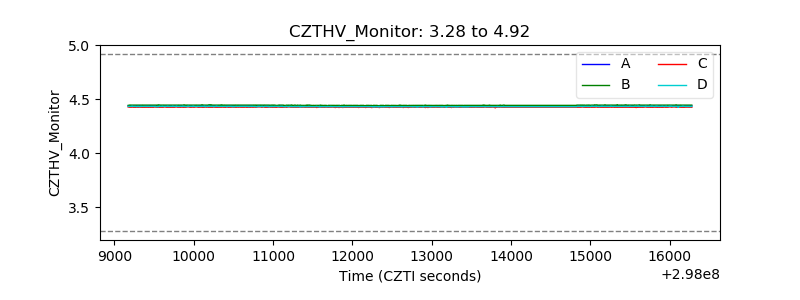 |
| D_VDD | 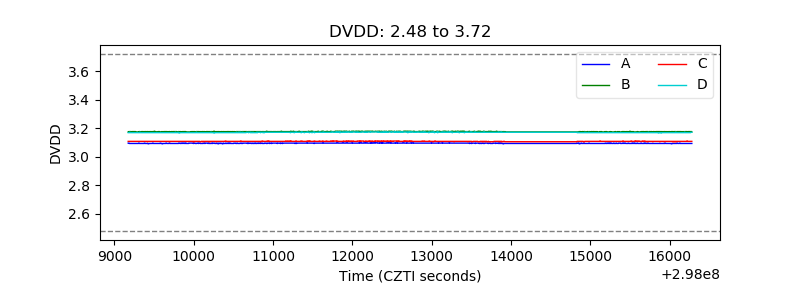 |
| Temperature 1 | 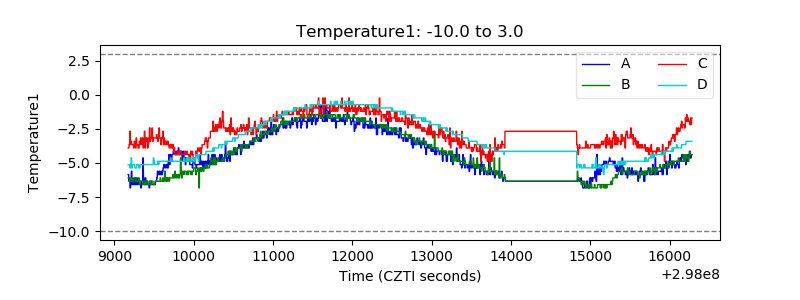 |
| Veto HV Monitor | 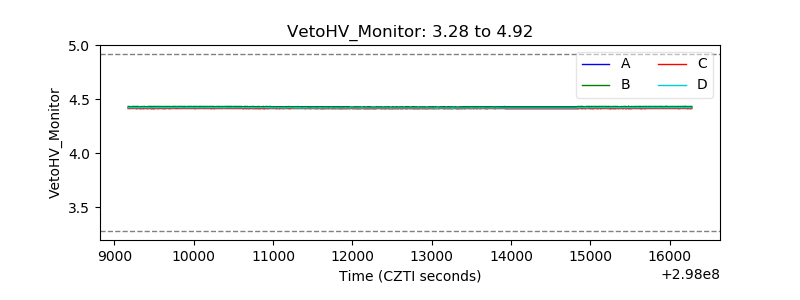 |
| Veto LLD | 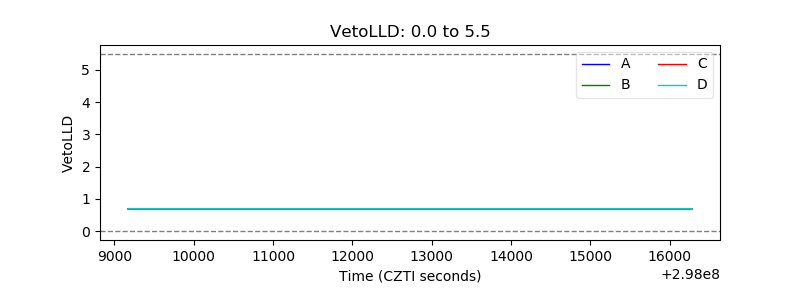 |
| Alpha Counter | 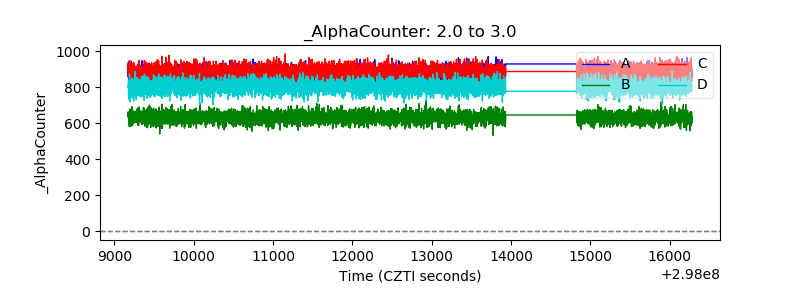 |
| _CPM_Rate | 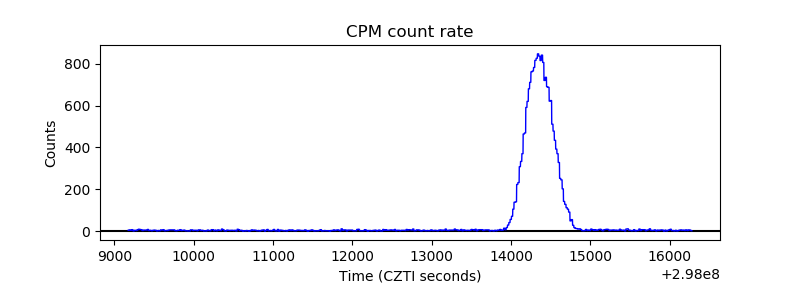 |
| CZT Counter | 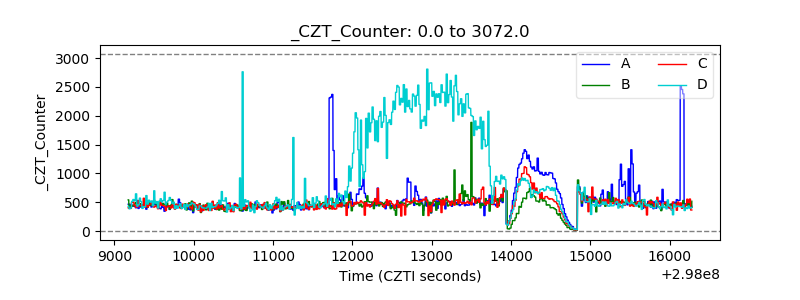 |
| +2.5 Volts monitor |  |
| +5 Volts monitor | 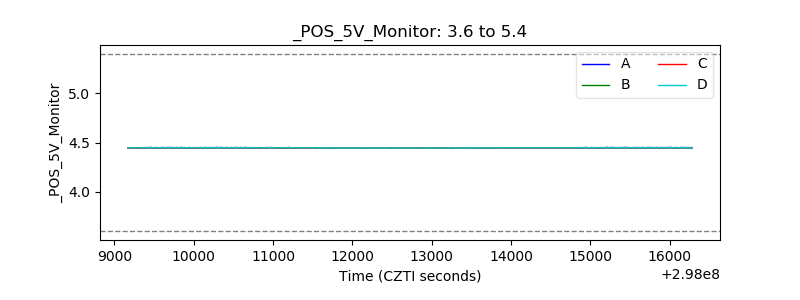 |
| _ROLL_ROT | 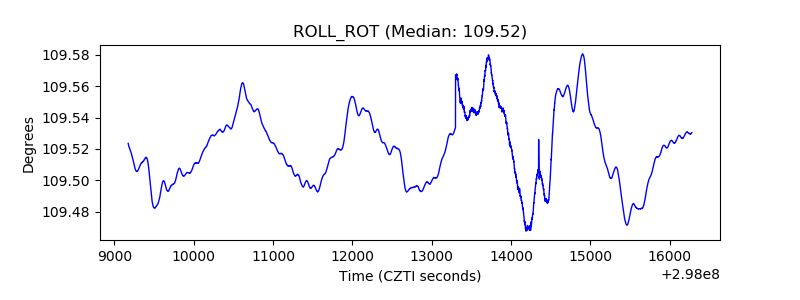 |
| _Roll_DEC | 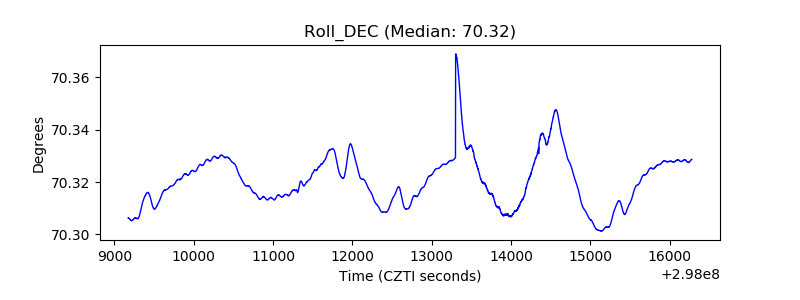 |
| _Roll_RA |  |
| Veto Counter | 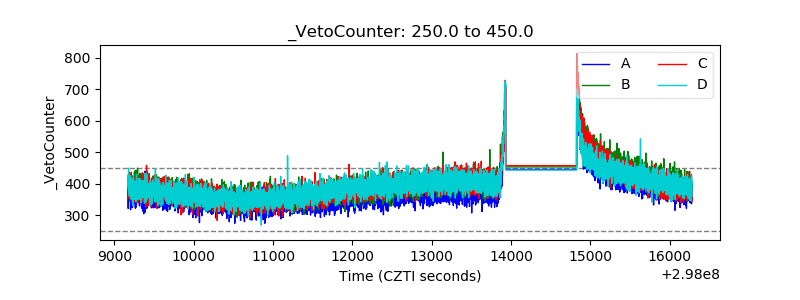 |