| Param | Original file | Final file |
|---|---|---|
| Filename | modeM0/AS1C04_001T01_9000002984_20028cztM0_level2.evt | modeM0/AS1C04_001T01_9000002984_20028cztM0_level2_quad_clean.evt |
| Size (bytes) | 1,845,008,640 | 321,825,600 |
| Size | 1.7 GB | 306.9 MB |
| Events in quadrant A | 11,365,806 | 2,131,623 |
| Events in quadrant B | 11,553,784 | 2,127,107 |
| Events in quadrant C | 10,619,018 | 2,082,833 |
| Events in quadrant D | 20,807,522 | 1,844,668 |
| Mode SS | |||
|---|---|---|---|
| Quadrant | BADHDUFLAG | Total packets | Discarded packets |
| A | 0 | 460 | 0 |
| B | 0 | 460 | 0 |
| C | 0 | 460 | 0 |
| D | 0 | 460 | 0 |
| Mode M9 | |||
|---|---|---|---|
| Quadrant | BADHDUFLAG | Total packets | Discarded packets |
| A | 0 | 33 | 0 |
| B | 0 | 33 | 0 |
| C | 0 | 33 | 0 |
| D | 0 | 33 | 0 |
| Mode M0 | |||
|---|---|---|---|
| Quadrant | BADHDUFLAG | Total packets | Discarded packets |
| A | 0 | 49001 | 4 |
| B | 0 | 49169 | 7 |
| C | 0 | 46356 | 6 |
| D | 0 | 77415 | 4 |
| Quadrant | Total seconds | Saturated seconds | Saturation percentage |
|---|---|---|---|
| A | 22666 | 376 | 1.658872% |
| B | 22665 | 303 | 1.336863% |
| C | 22665 | 271 | 1.195676% |
| D | 22665 | 4292 | 18.936687% |
Noise dominated data is calculated using 1-second bins in cleaned event files. If a bin has >2000 counts, and if more than 50% of those come from <1% of pixels, then it is considered to be noise-dominated and hence unusable.
| Quadrant | # 1 sec bins | Bins with >0 counts | Bins with >2000 counts | High rate bins dominated by noise | Noise dominated (total time) | Noise dominated (detector-on time) | Marked lightcurve |
|---|---|---|---|---|---|---|---|
| A | 25891 | 22670 | 163 | 163 | 0.63% | 0.72% | 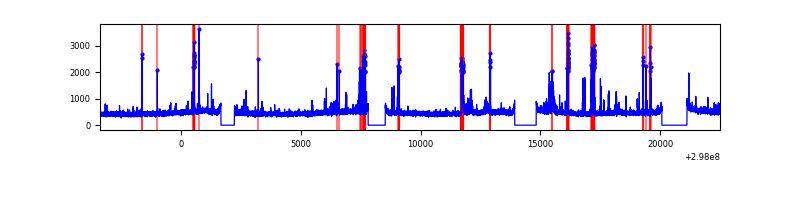 |
| B | 25891 | 22670 | 45 | 45 | 0.17% | 0.20% | 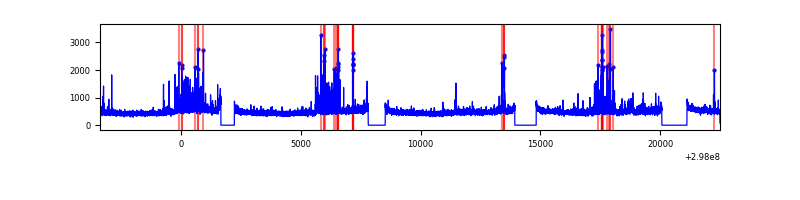 |
| C | 25891 | 22670 | 0 | 0 | 0.00% | 0.00% | 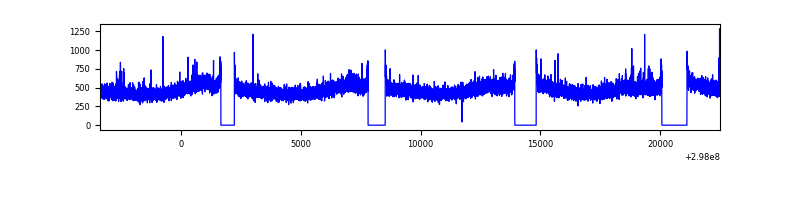 |
| D | 25891 | 22670 | 3962 | 3962 | 15.30% | 17.48% | 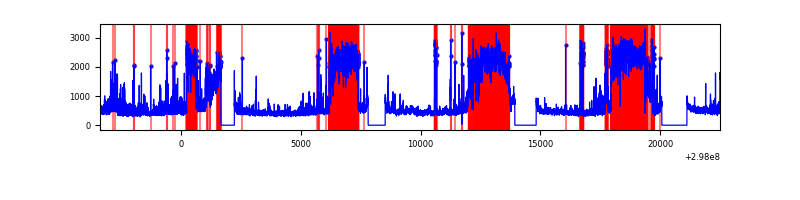 |
Top three noisy pixels from each quadrant. If the there are fewer than three noisy pixels in the level2.evt file, extra rows are filled as -1
| Pixel properties | Quadrant properties | ||||||
|---|---|---|---|---|---|---|---|
| Quadrant | DetID | PixID | Counts | Sigma | Mean | Median | Sigma |
| A | 14 | 238 | 460987 | 855.4 | 2679 | 2623 | 535.8 |
| A | 5 | 16 | 366799 | 679.63 | 2679 | 2623 | 535.8 |
| A | 14 | 254 | 163423 | 300.09 | 2679 | 2623 | 535.8 |
| B | 7 | 220 | 501929 | 995.61 | 2667 | 2600 | 501.5 |
| B | 0 | 189 | 180416 | 354.54 | 2667 | 2600 | 501.5 |
| B | 0 | 197 | 164997 | 323.8 | 2667 | 2600 | 501.5 |
| C | 14 | 238 | 403328 | 669.78 | 2579 | 2591 | 598.3 |
| C | 3 | 233 | 121364 | 198.51 | 2579 | 2591 | 598.3 |
| C | 0 | 207 | 25225 | 37.83 | 2579 | 2591 | 598.3 |
| D | 7 | 38 | 9290733 | 15643.56 | 2465 | 2391 | 593.7 |
| D | 1 | 52 | 641117 | 1075.75 | 2465 | 2391 | 593.7 |
| D | 7 | 238 | 406979 | 681.41 | 2465 | 2391 | 593.7 |
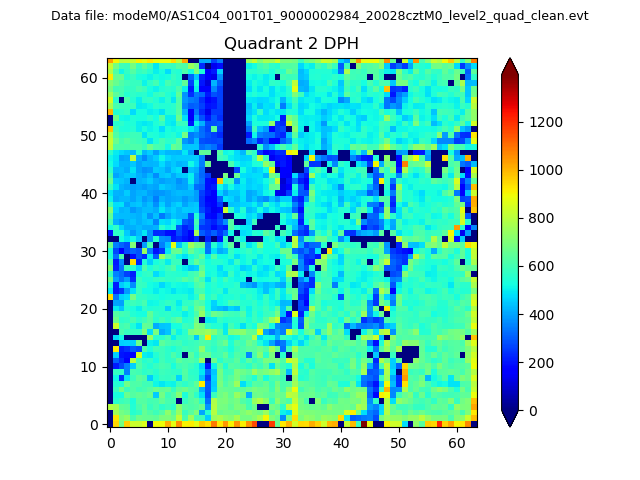
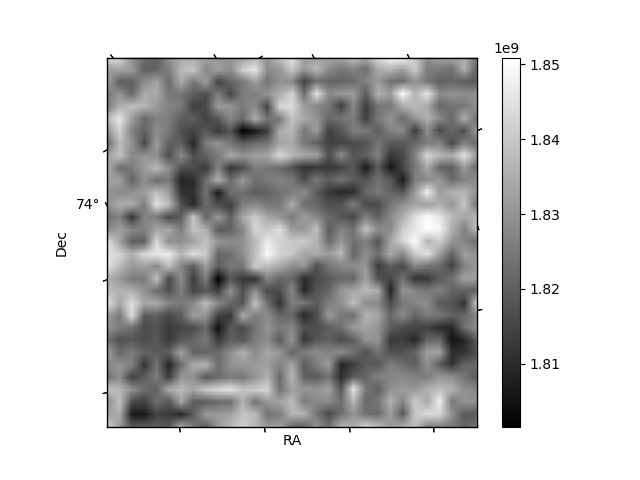
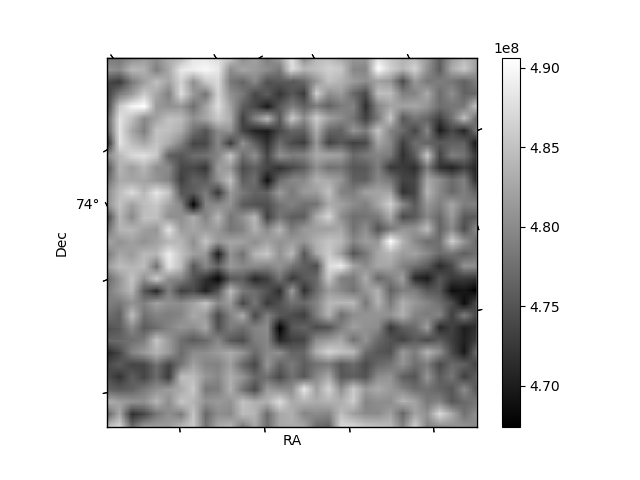
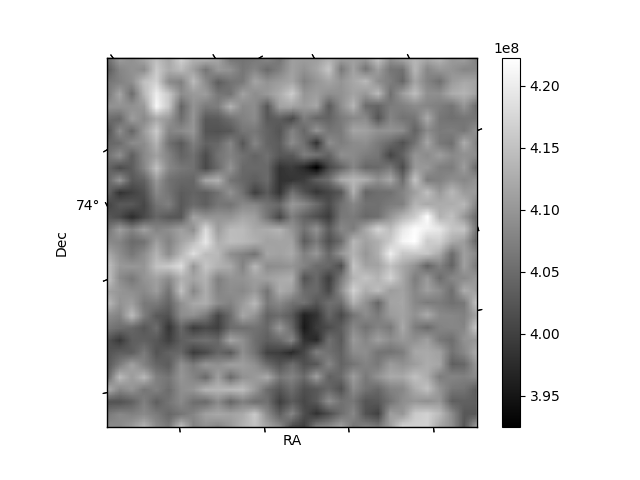
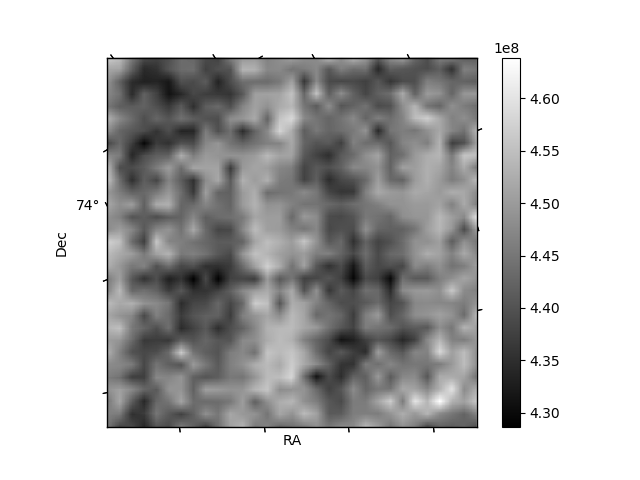
Histogram calculated using DETX and DETY for each event in the final _common_clean file
| Quadrant A | 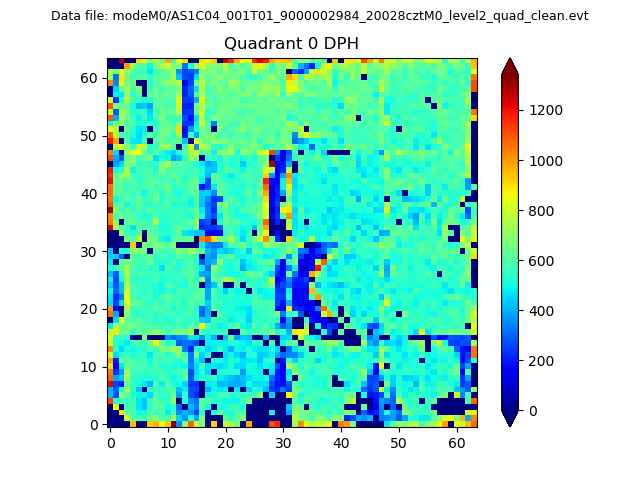 |
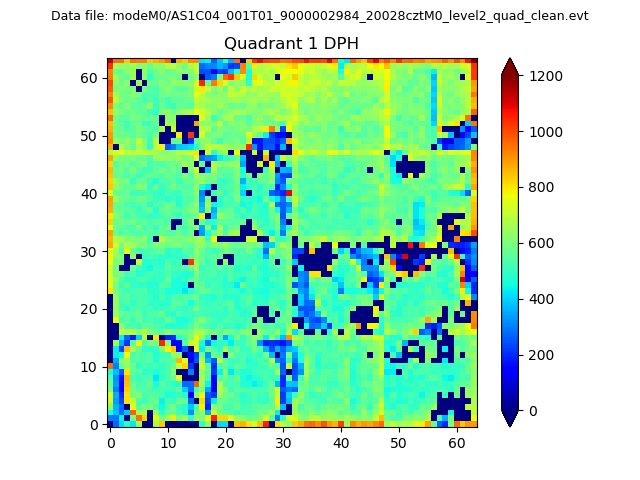 |
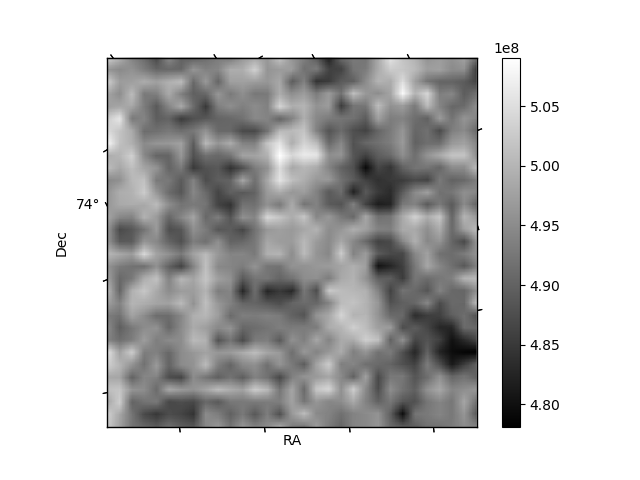
Quadrant B |
|---|---|---|---|
| Quadrant D | 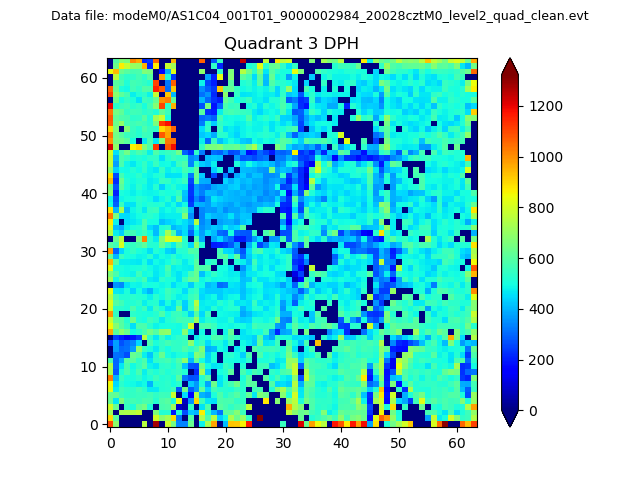 |
 |
Quadrant C |
| Plot type | Count rate plots | Images |
|---|---|---|
| Comparison with Poisson distribution Blue bars denote a histogram of data divided into 1 sec bins. Red curve is a Poisson curve with rate = median count rate of data. |
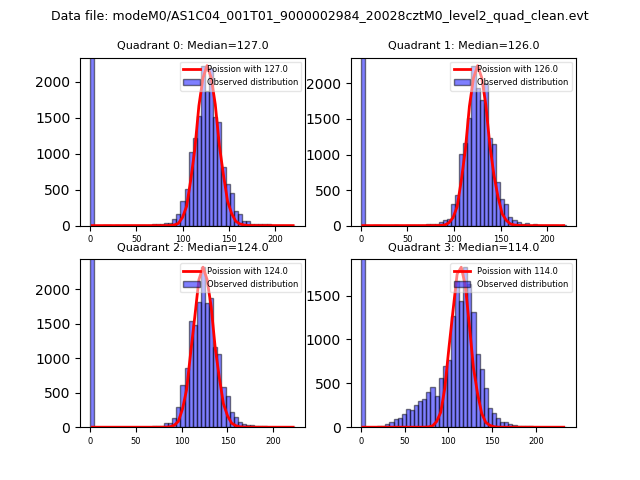 |
 |
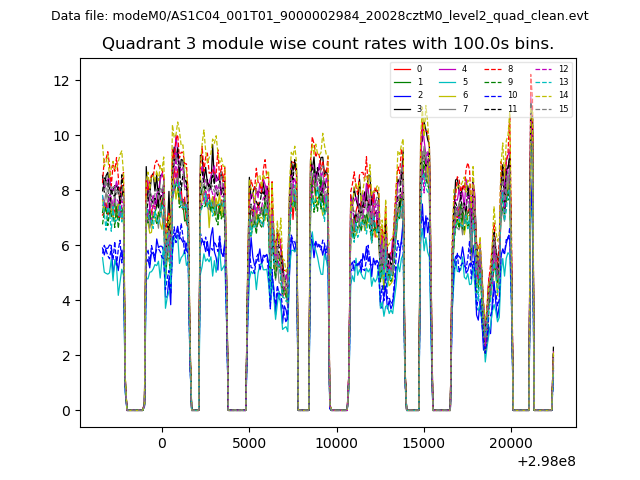
| Quadrant-wise count rates Data is divided into 100 sec bins |
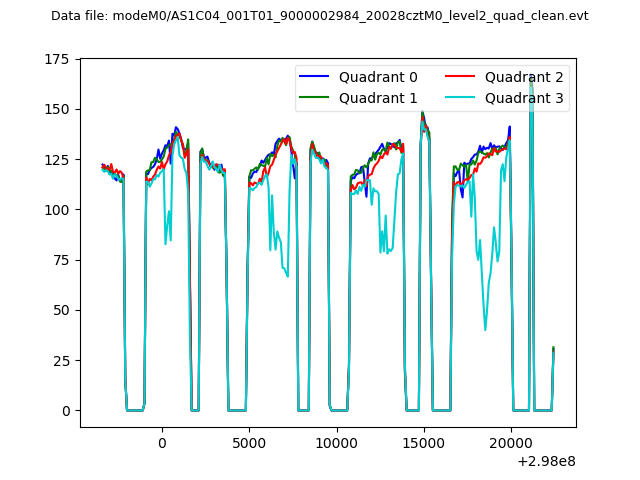 |
|
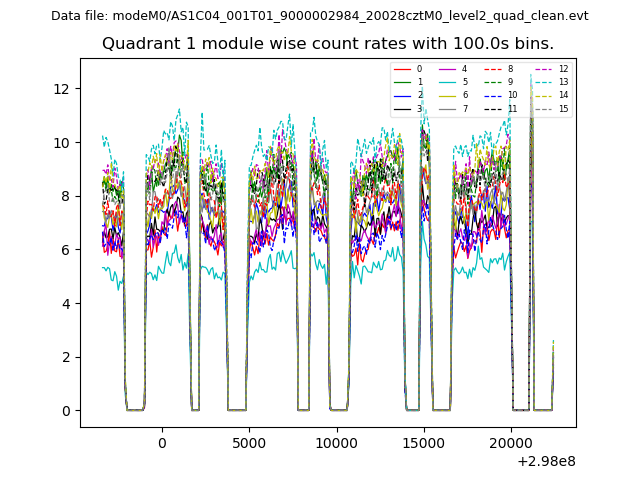
| Module-wise count rates for Quadrant A Data is divided into 100 sec bins |
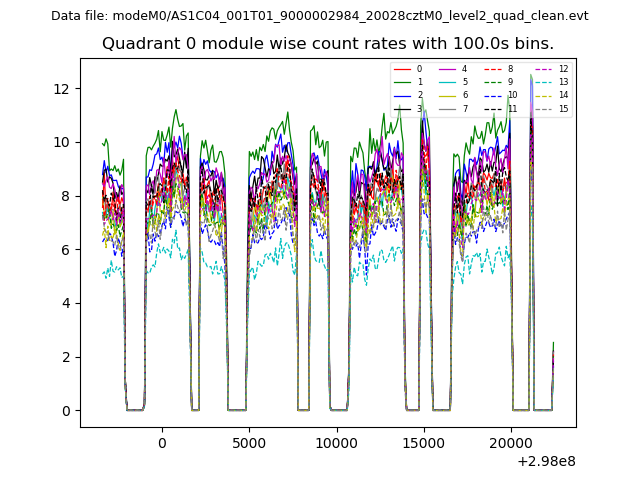 |
 |
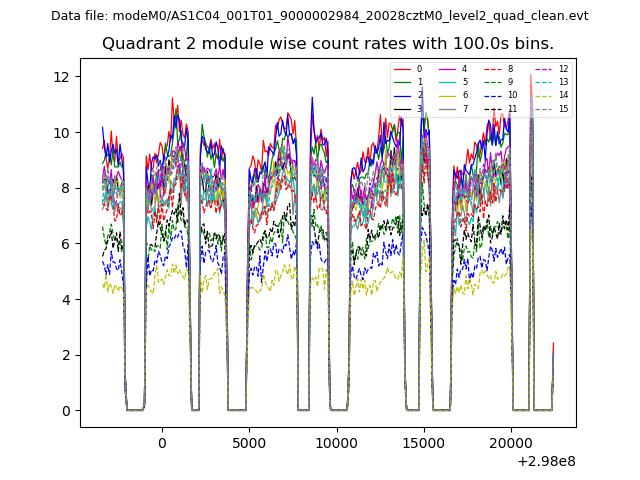
| Module-wise count rates for Quadrant B Data is divided into 100 sec bins |
 |
 |
| Module-wise count rates for Quadrant C Data is divided into 100 sec bins |
 |
 |
| Module-wise count rates for Quadrant D Data is divided into 100 sec bins |
 |
 |
| Parameter | Plot |
|---|---|
| CZT HV Monitor | 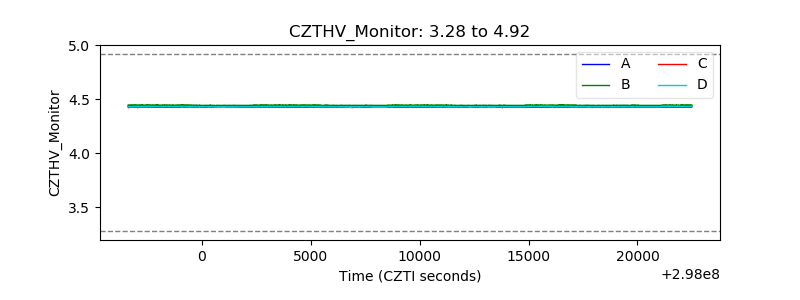 |
| D_VDD | 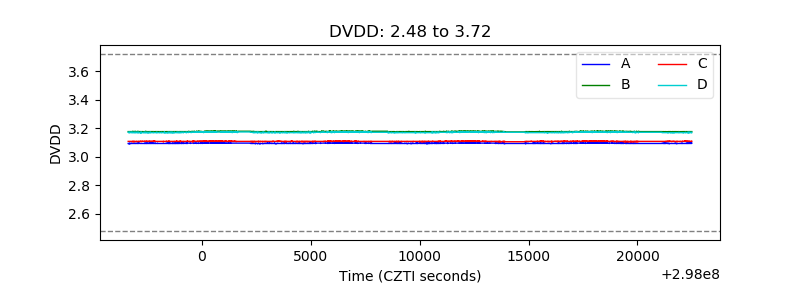 |
| Temperature 1 | 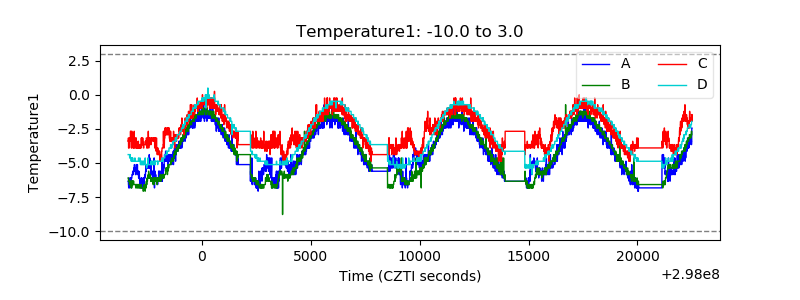 |
| Veto HV Monitor | 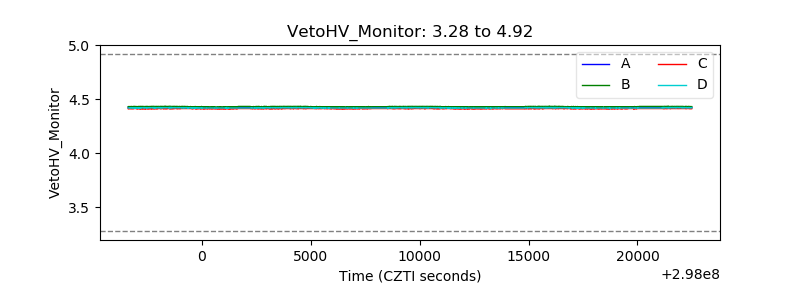 |
| Veto LLD | 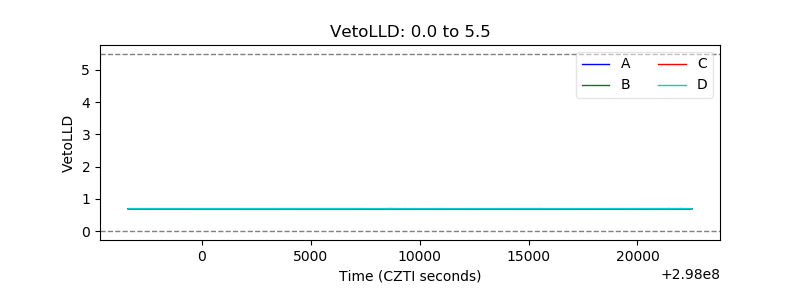 |
| Alpha Counter | 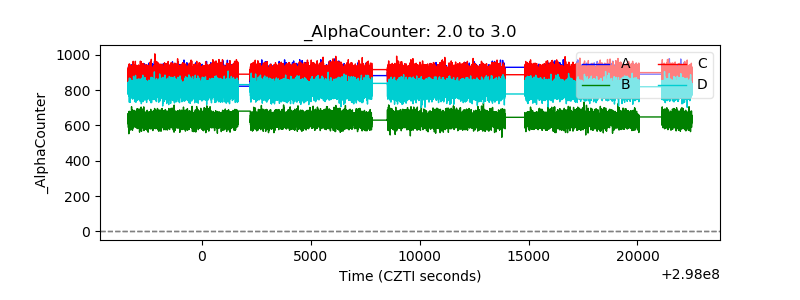 |
| _CPM_Rate | 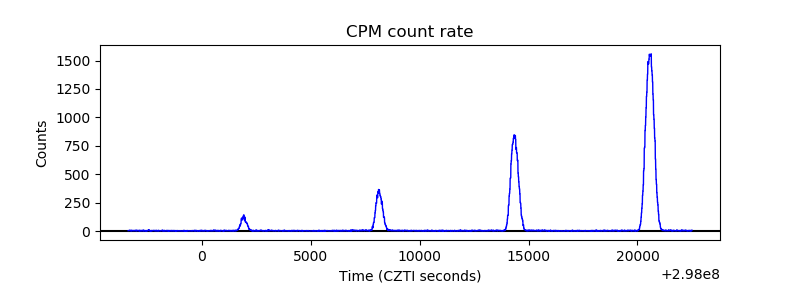 |
| CZT Counter | 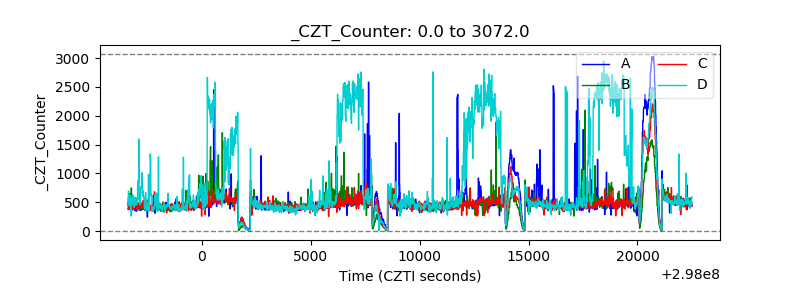 |
| +2.5 Volts monitor | 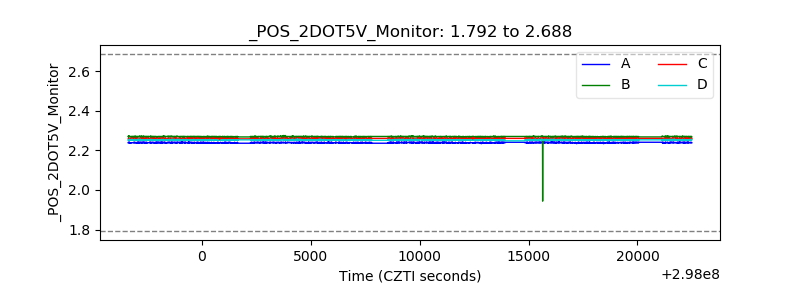 |
| +5 Volts monitor |  |
| _ROLL_ROT | 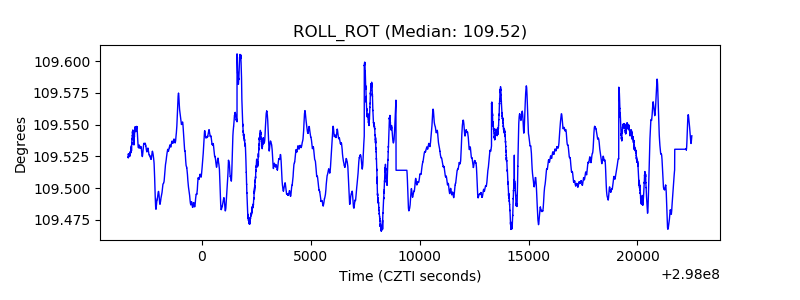 |
| _Roll_DEC | 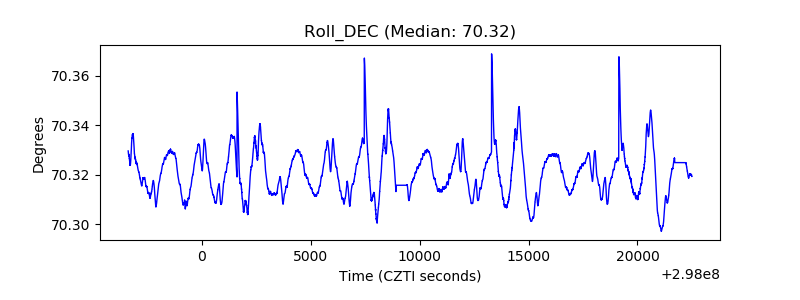 |
| _Roll_RA | 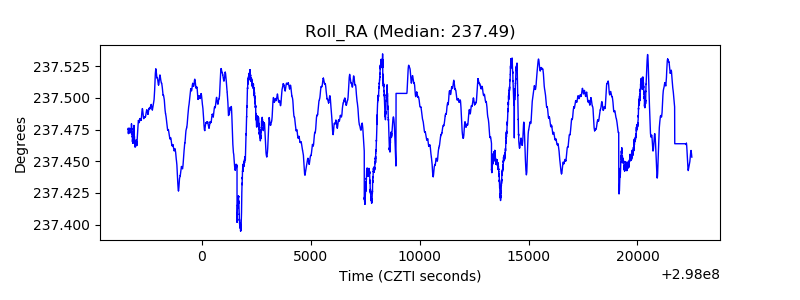 |
| Veto Counter |  |