| Param | Original file | Final file |
|---|---|---|
| Filename | modeM0/AS1C04_001T01_9000002984_20030cztM0_level2.evt | modeM0/AS1C04_001T01_9000002984_20030cztM0_level2_quad_clean.evt |
| Size (bytes) | 221,353,920 | 32,999,040 |
| Size | 211.1 MB | 31.5 MB |
| Events in quadrant A | 1,363,305 | 212,669 |
| Events in quadrant B | 1,664,840 | 209,502 |
| Events in quadrant C | 1,312,649 | 198,409 |
| Events in quadrant D | 2,174,248 | 181,577 |
| Mode SS | |||
|---|---|---|---|
| Quadrant | BADHDUFLAG | Total packets | Discarded packets |
| A | 0 | 56 | 0 |
| B | 0 | 56 | 0 |
| C | 0 | 56 | 0 |
| D | 0 | 56 | 0 |
| Mode M0 | |||
|---|---|---|---|
| Quadrant | BADHDUFLAG | Total packets | Discarded packets |
| A | 0 | 5774 | 1 |
| B | 0 | 6670 | 1 |
| C | 0 | 5637 | 1 |
| D | 0 | 8181 | 1 |
| Quadrant | Total seconds | Saturated seconds | Saturation percentage |
|---|---|---|---|
| A | 2743 | 10 | 0.364564% |
| B | 2744 | 34 | 1.239067% |
| C | 2744 | 8 | 0.291545% |
| D | 2744 | 296 | 10.787172% |
Noise dominated data is calculated using 1-second bins in cleaned event files. If a bin has >2000 counts, and if more than 50% of those come from <1% of pixels, then it is considered to be noise-dominated and hence unusable.
| Quadrant | # 1 sec bins | Bins with >0 counts | Bins with >2000 counts | High rate bins dominated by noise | Noise dominated (total time) | Noise dominated (detector-on time) | Marked lightcurve |
|---|---|---|---|---|---|---|---|
| A | 2743 | 2743 | 0 | 0 | 0.00% | 0.00% | 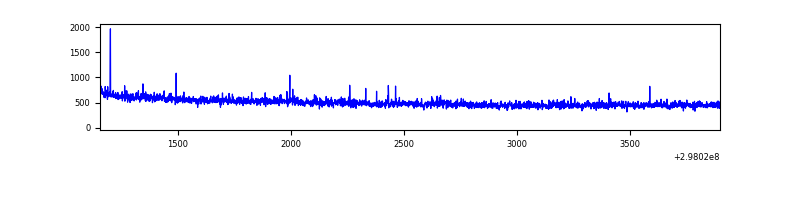 |
| B | 2744 | 2744 | 19 | 19 | 0.69% | 0.69% | 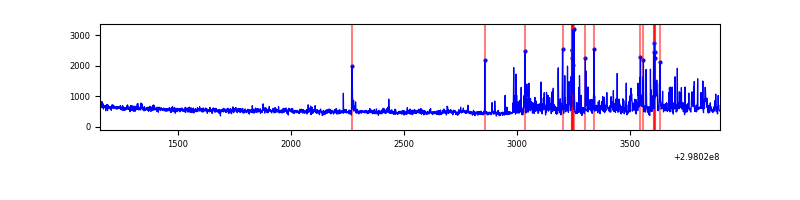 |
| C | 2744 | 2744 | 0 | 0 | 0.00% | 0.00% | 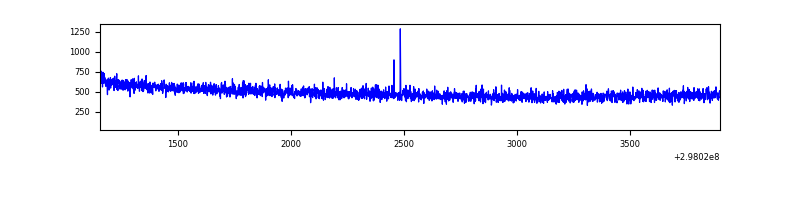 |
| D | 2744 | 2744 | 305 | 305 | 11.12% | 11.12% | 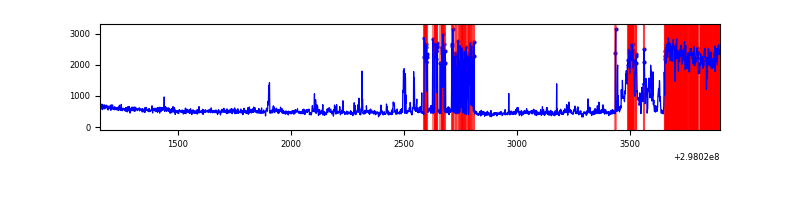 |
Top three noisy pixels from each quadrant. If the there are fewer than three noisy pixels in the level2.evt file, extra rows are filled as -1
| Pixel properties | Quadrant properties | ||||||
|---|---|---|---|---|---|---|---|
| Quadrant | DetID | PixID | Counts | Sigma | Mean | Median | Sigma |
| A | 5 | 16 | 8914 | 120.24 | 348 | 342 | 71.3 |
| A | 11 | 29 | 8405 | 113.1 | 348 | 342 | 71.3 |
| A | 13 | 254 | 4140 | 53.28 | 348 | 342 | 71.3 |
| B | 7 | 220 | 217981 | 3279.37 | 340 | 332 | 66.4 |
| B | 4 | 216 | 27668 | 411.88 | 340 | 332 | 66.4 |
| B | 0 | 189 | 25965 | 386.22 | 340 | 332 | 66.4 |
| C | 14 | 238 | 51718 | 691.09 | 320 | 322 | 74.4 |
| C | 3 | 233 | 6943 | 89.03 | 320 | 322 | 74.4 |
| C | 7 | 220 | 2765 | 32.85 | 320 | 322 | 74.4 |
| D | 7 | 38 | 603190 | 7765.35 | 320 | 311 | 77.6 |
| D | 7 | 238 | 213246 | 2742.7 | 320 | 311 | 77.6 |
| D | 2 | 184 | 44810 | 573.17 | 320 | 311 | 77.6 |
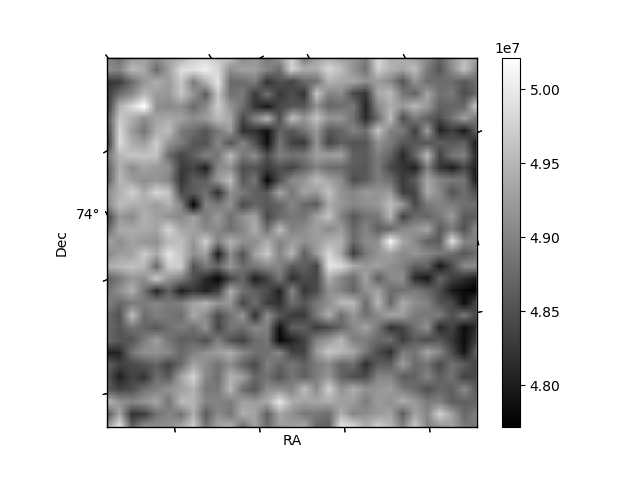
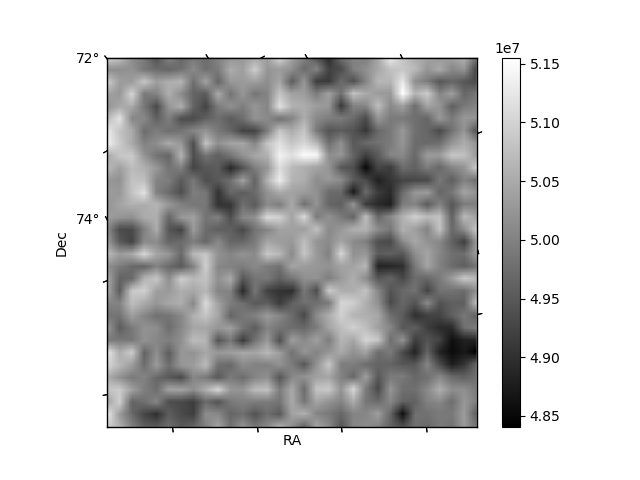
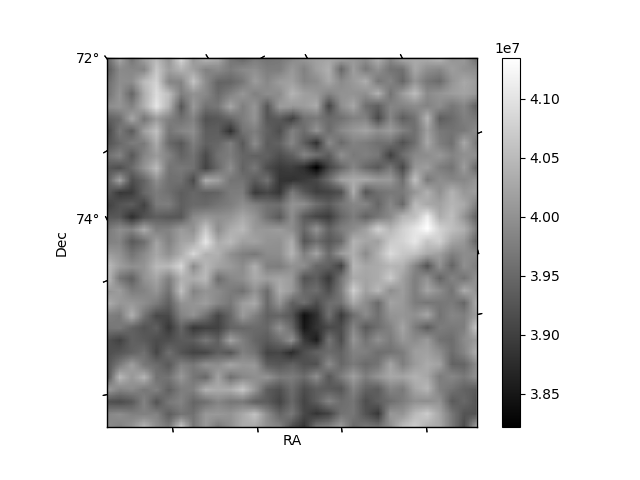
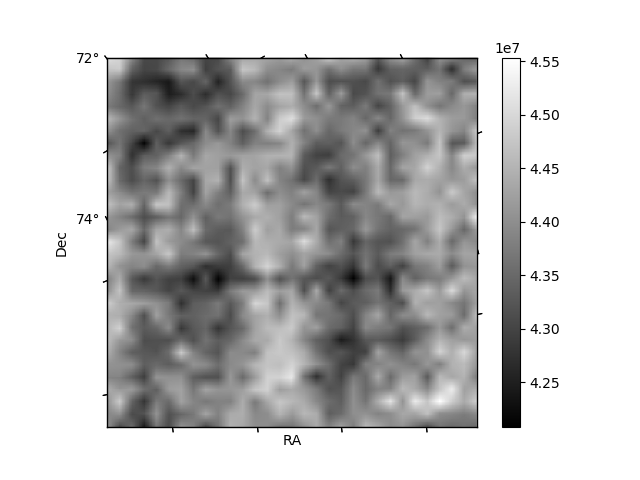
Histogram calculated using DETX and DETY for each event in the final _common_clean file
| Quadrant A | 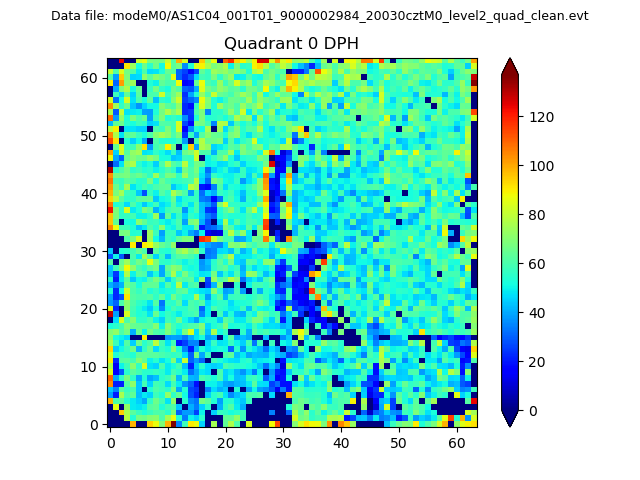 |
 |
Quadrant B |
|---|---|---|---|
| Quadrant D | 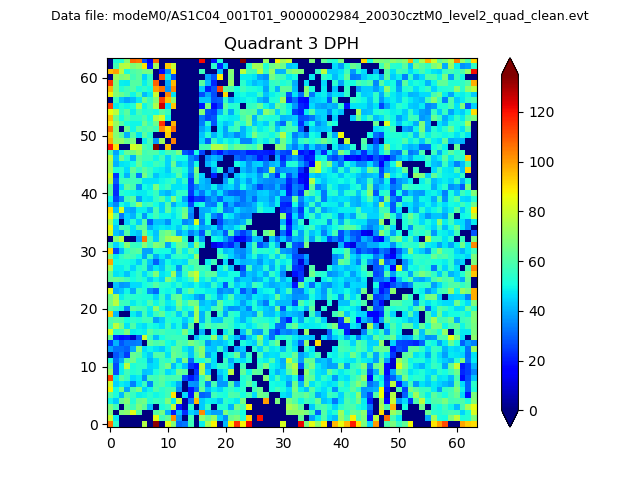 |
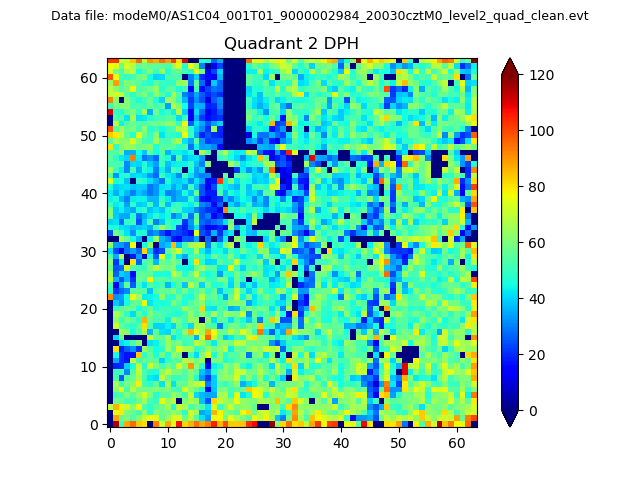 |
Quadrant C |
| Plot type | Count rate plots | Images |
|---|---|---|
| Comparison with Poisson distribution Blue bars denote a histogram of data divided into 1 sec bins. Red curve is a Poisson curve with rate = median count rate of data. |
 |
 |
| Quadrant-wise count rates Data is divided into 100 sec bins |
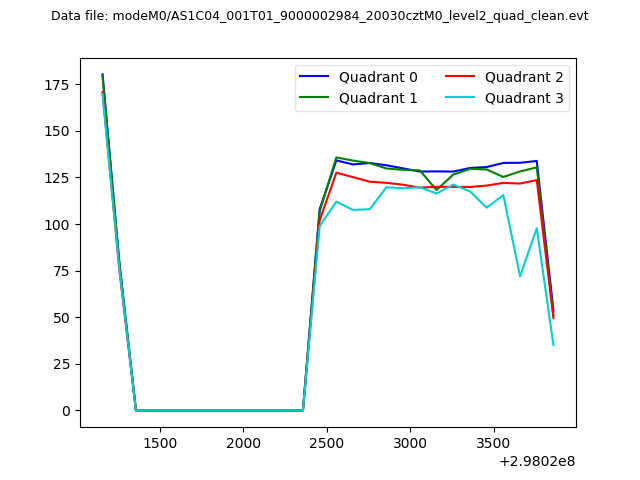 |
|
| Module-wise count rates for Quadrant A Data is divided into 100 sec bins |
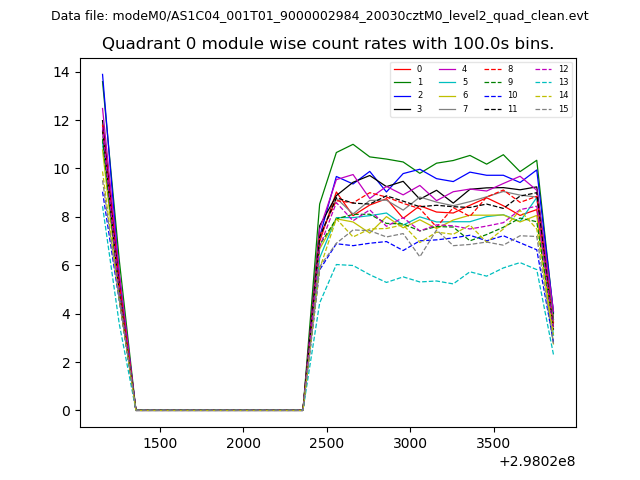 |
 |
| Module-wise count rates for Quadrant B Data is divided into 100 sec bins |
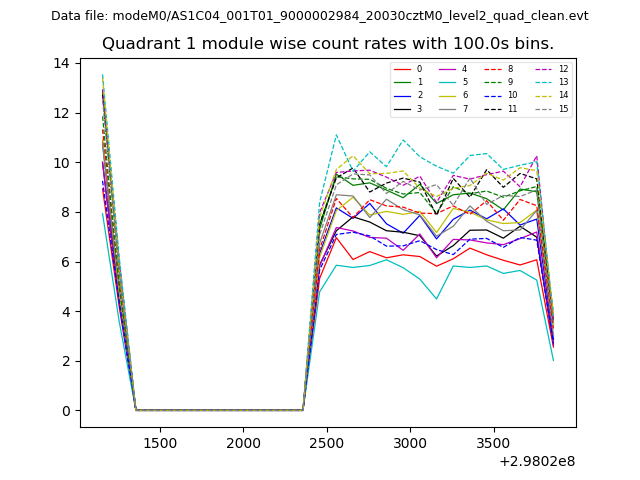 |
 |
| Module-wise count rates for Quadrant C Data is divided into 100 sec bins |
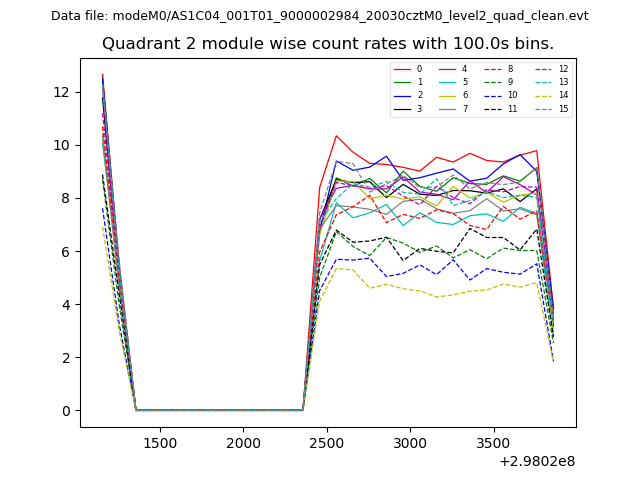 |
 |
| Module-wise count rates for Quadrant D Data is divided into 100 sec bins |
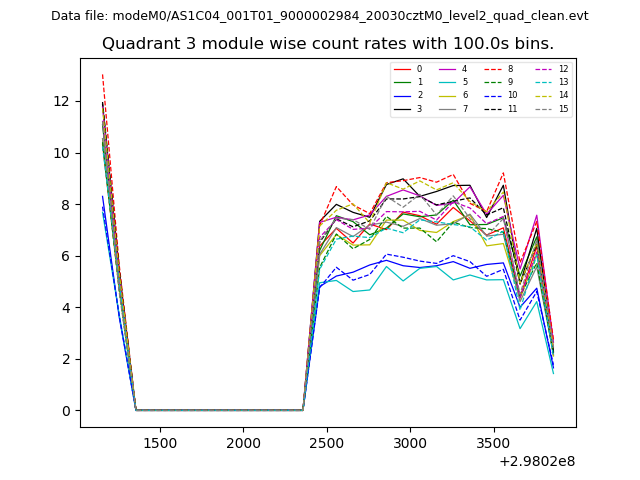 |
 |
| Parameter | Plot |
|---|---|
| CZT HV Monitor | 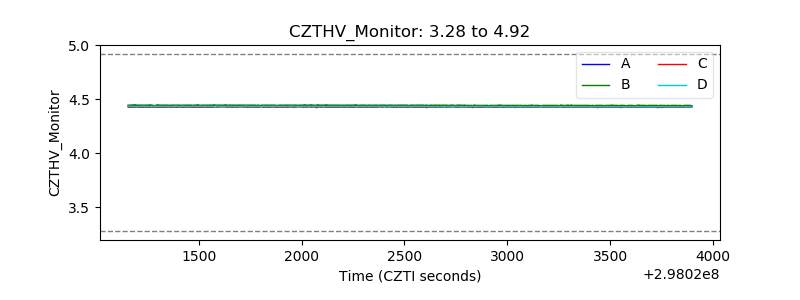 |
| D_VDD | 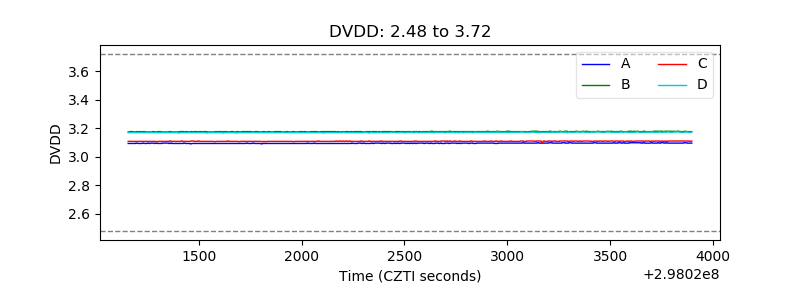 |
| Temperature 1 | 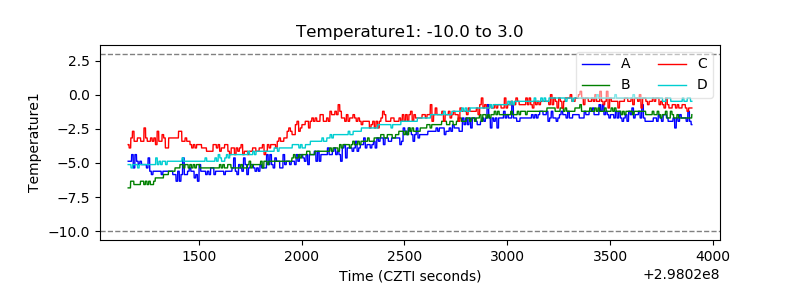 |
| Veto HV Monitor | 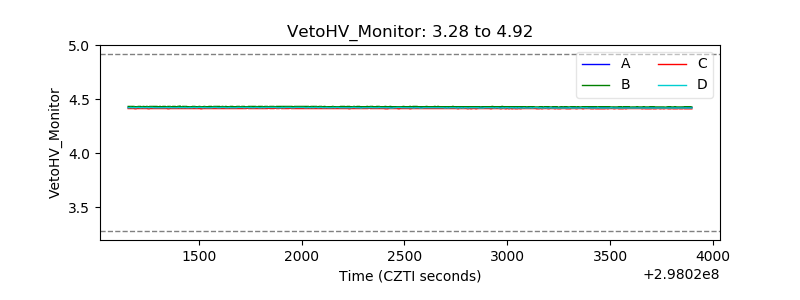 |
| Veto LLD | 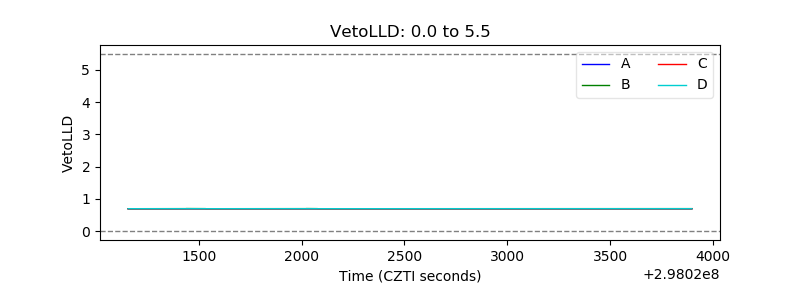 |
| Alpha Counter | 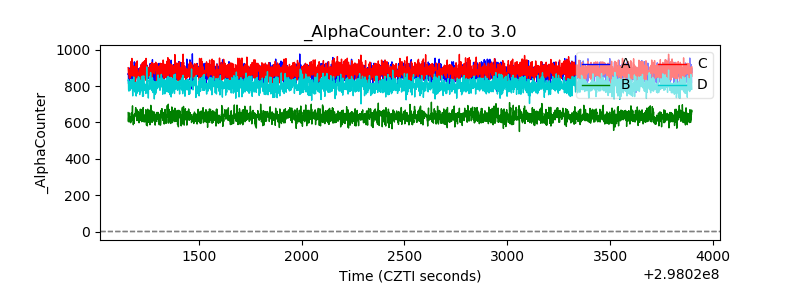 |
| _CPM_Rate | 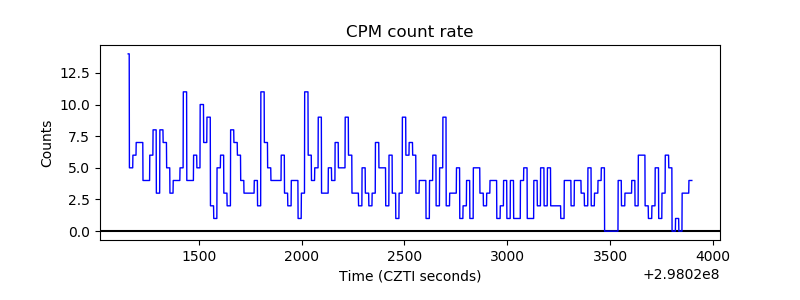 |
| CZT Counter | 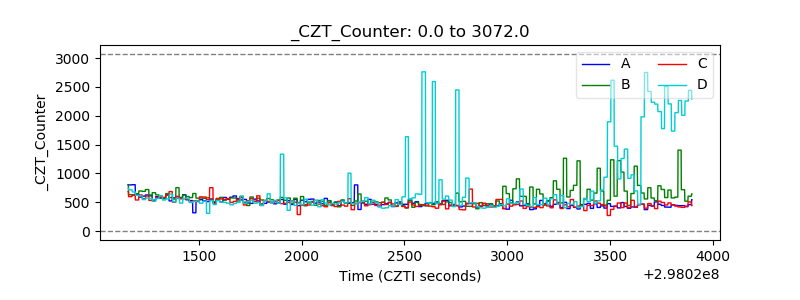 |
| +2.5 Volts monitor |  |
| +5 Volts monitor |  |
| _ROLL_ROT | 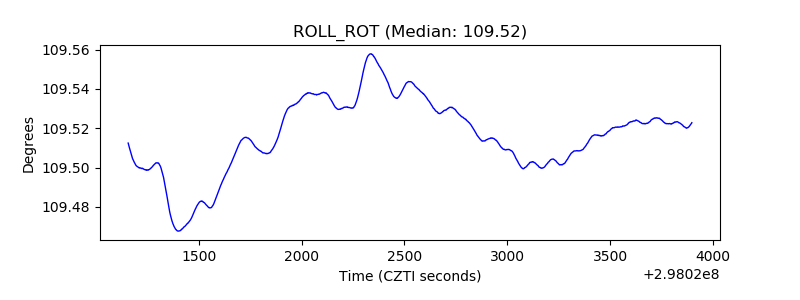 |
| _Roll_DEC | 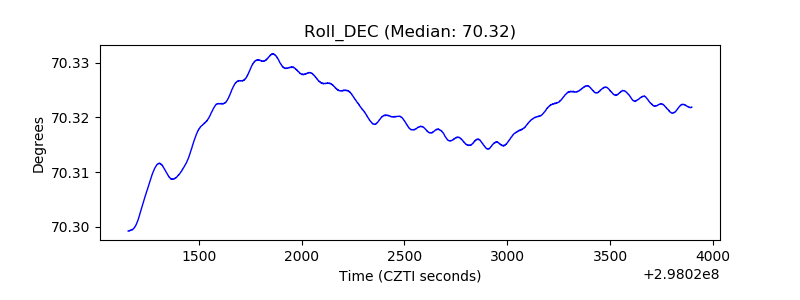 |
| _Roll_RA | 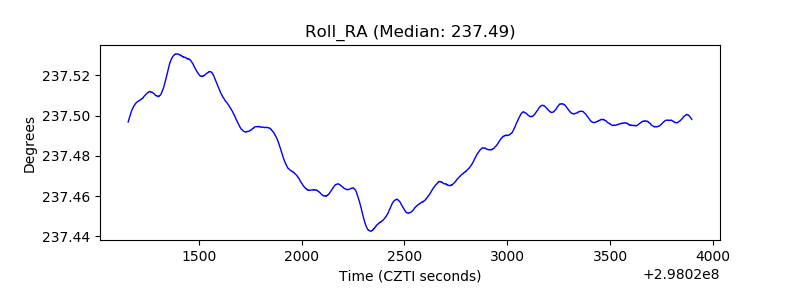 |
| Veto Counter |  |