| Param | Original file | Final file |
|---|---|---|
| Filename | modeM0/AS1A05_180T01_9000002986_20030cztM0_level2.evt | modeM0/AS1A05_180T01_9000002986_20030cztM0_level2_quad_clean.evt |
| Size (bytes) | 280,143,360 | 48,378,240 |
| Size | 267.2 MB | 46.1 MB |
| Events in quadrant A | 1,672,852 | 329,392 |
| Events in quadrant B | 1,758,007 | 328,957 |
| Events in quadrant C | 1,665,314 | 314,889 |
| Events in quadrant D | 3,181,066 | 275,639 |
| Mode SS | |||
|---|---|---|---|
| Quadrant | BADHDUFLAG | Total packets | Discarded packets |
| A | 0 | 62 | 0 |
| B | 0 | 62 | 0 |
| C | 0 | 62 | 0 |
| D | 0 | 62 | 0 |
| Mode M9 | |||
|---|---|---|---|
| Quadrant | BADHDUFLAG | Total packets | Discarded packets |
| A | 0 | 12 | 0 |
| B | 0 | 12 | 0 |
| C | 0 | 12 | 0 |
| D | 0 | 12 | 0 |
| Mode M0 | |||
|---|---|---|---|
| Quadrant | BADHDUFLAG | Total packets | Discarded packets |
| A | 0 | 6821 | 1 |
| B | 0 | 7070 | 1 |
| C | 0 | 6699 | 1 |
| D | 0 | 11397 | 1 |
| Quadrant | Total seconds | Saturated seconds | Saturation percentage |
|---|---|---|---|
| A | 3027 | 64 | 2.114305% |
| B | 3026 | 76 | 2.511566% |
| C | 3026 | 70 | 2.313285% |
| D | 3026 | 668 | 22.075347% |
Noise dominated data is calculated using 1-second bins in cleaned event files. If a bin has >2000 counts, and if more than 50% of those come from <1% of pixels, then it is considered to be noise-dominated and hence unusable.
| Quadrant | # 1 sec bins | Bins with >0 counts | Bins with >2000 counts | High rate bins dominated by noise | Noise dominated (total time) | Noise dominated (detector-on time) | Marked lightcurve |
|---|---|---|---|---|---|---|---|
| A | 4197 | 3028 | 0 | 0 | 0.00% | 0.00% | 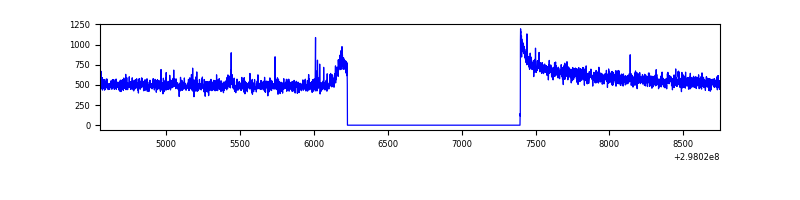 |
| B | 4196 | 3027 | 3 | 3 | 0.07% | 0.10% | 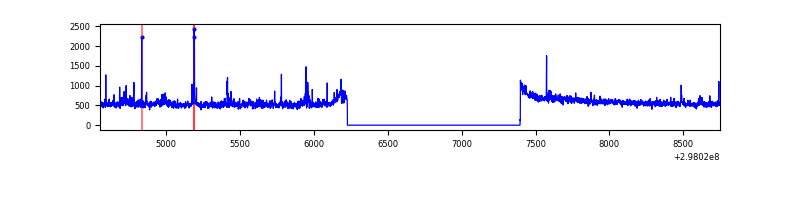 |
| C | 4196 | 3027 | 0 | 0 | 0.00% | 0.00% | 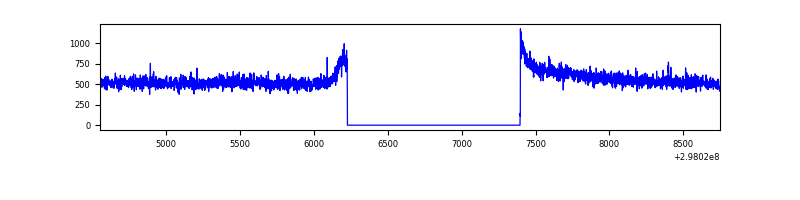 |
| D | 4196 | 3027 | 597 | 597 | 14.23% | 19.72% | 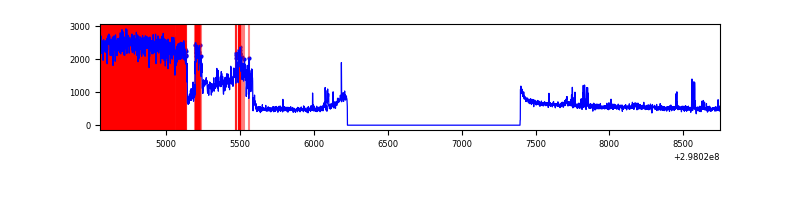 |
Top three noisy pixels from each quadrant. If the there are fewer than three noisy pixels in the level2.evt file, extra rows are filled as -1
| Pixel properties | Quadrant properties | ||||||
|---|---|---|---|---|---|---|---|
| Quadrant | DetID | PixID | Counts | Sigma | Mean | Median | Sigma |
| A | 5 | 16 | 9475 | 104.23 | 430 | 422 | 86.9 |
| A | 11 | 29 | 5550 | 59.04 | 430 | 422 | 86.9 |
| A | 13 | 254 | 4954 | 52.18 | 430 | 422 | 86.9 |
| B | 0 | 189 | 40492 | 488.5 | 425 | 416 | 82.0 |
| B | 0 | 245 | 22565 | 269.98 | 425 | 416 | 82.0 |
| B | 0 | 197 | 13263 | 156.6 | 425 | 416 | 82.0 |
| C | 14 | 238 | 65264 | 679.86 | 407 | 411 | 95.4 |
| C | 3 | 233 | 5014 | 48.25 | 407 | 411 | 95.4 |
| C | 4 | 254 | 4358 | 41.37 | 407 | 411 | 95.4 |
| D | 7 | 38 | 1585652 | 16665.57 | 392 | 381 | 95.1 |
| D | 8 | 195 | 32472 | 337.36 | 392 | 381 | 95.1 |
| D | 1 | 52 | 32144 | 333.92 | 392 | 381 | 95.1 |
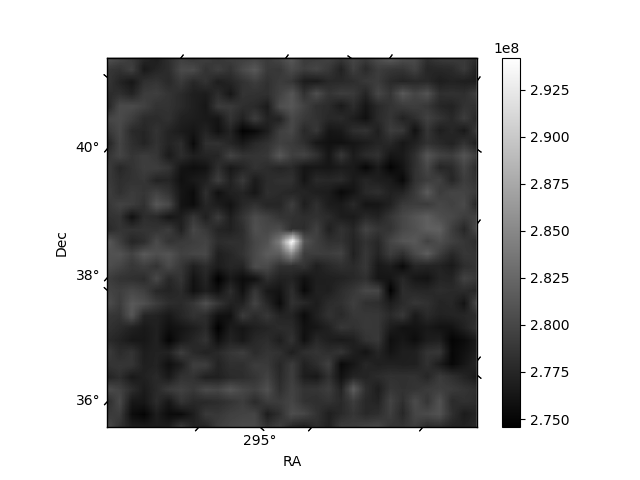
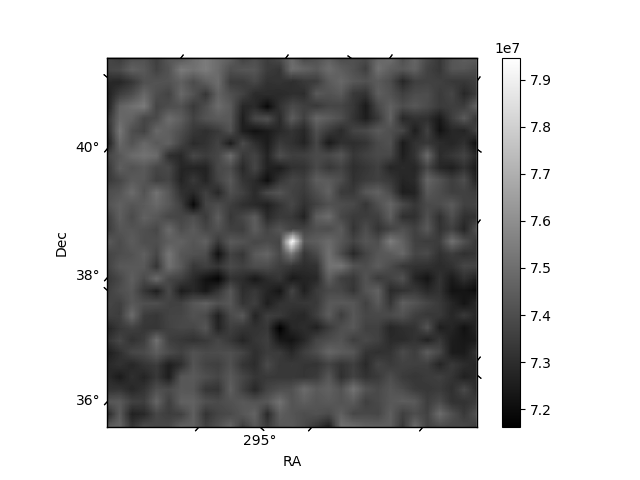
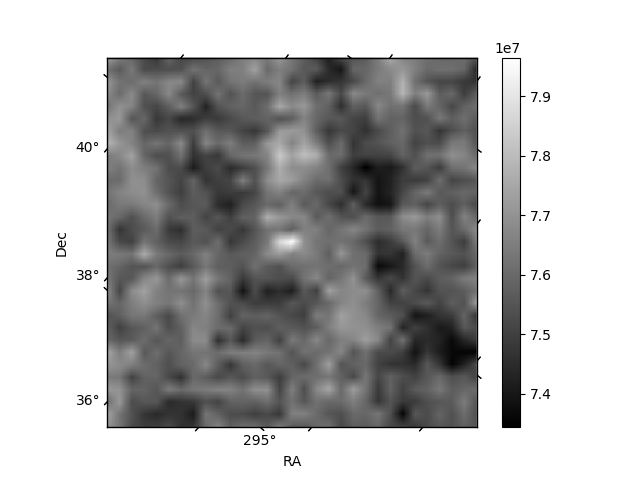
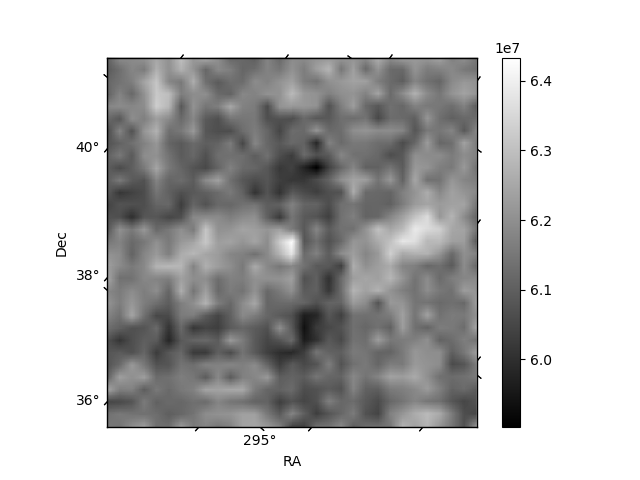
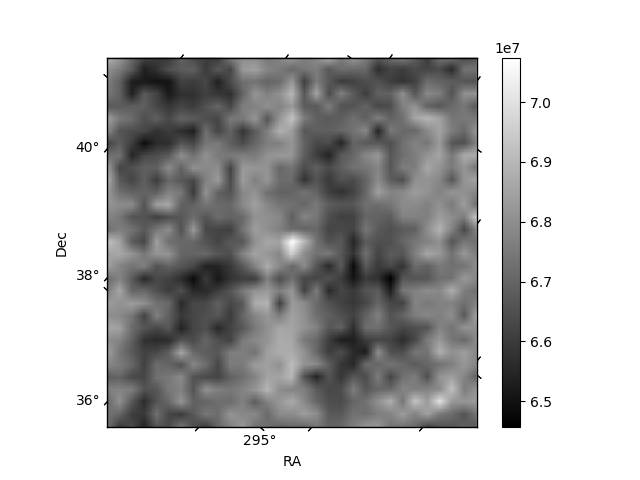
Histogram calculated using DETX and DETY for each event in the final _common_clean file
| Quadrant A | 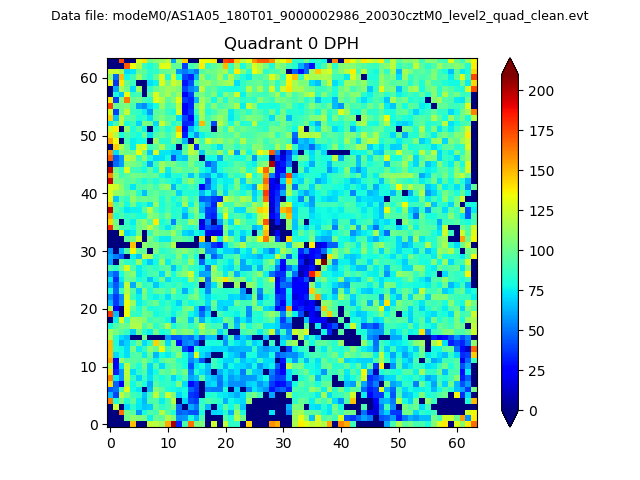 |
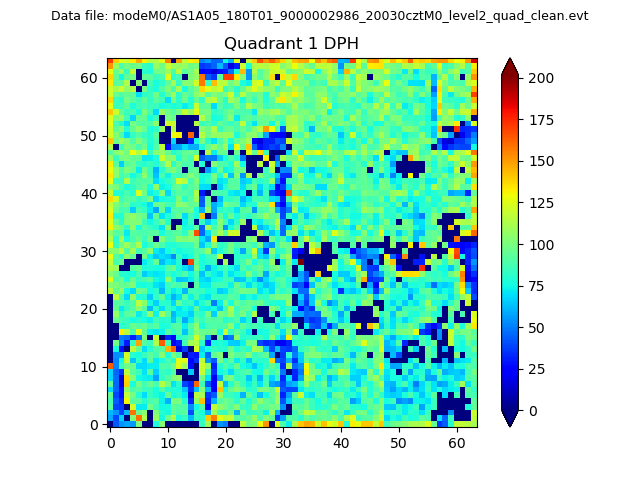 |
Quadrant B |
|---|---|---|---|
| Quadrant D |  |
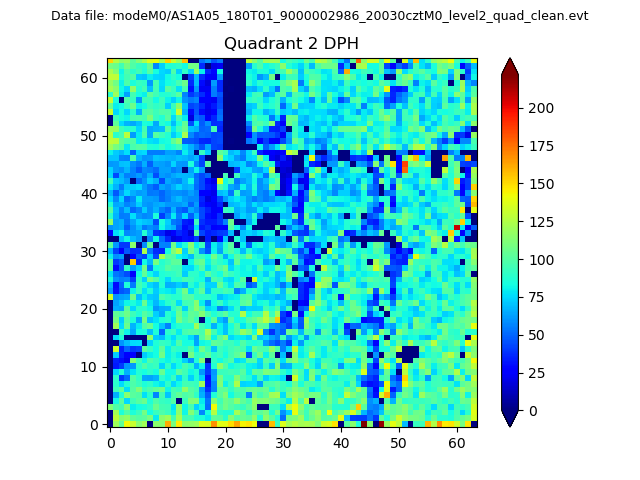 |
Quadrant C |
| Plot type | Count rate plots | Images |
|---|---|---|
| Comparison with Poisson distribution Blue bars denote a histogram of data divided into 1 sec bins. Red curve is a Poisson curve with rate = median count rate of data. |
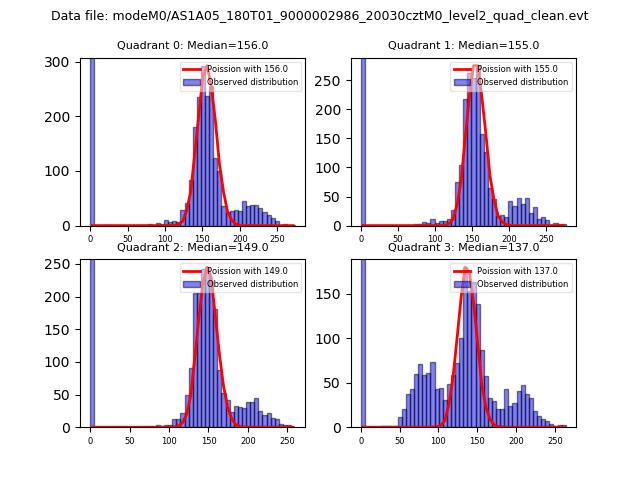 |
 |
| Quadrant-wise count rates Data is divided into 100 sec bins |
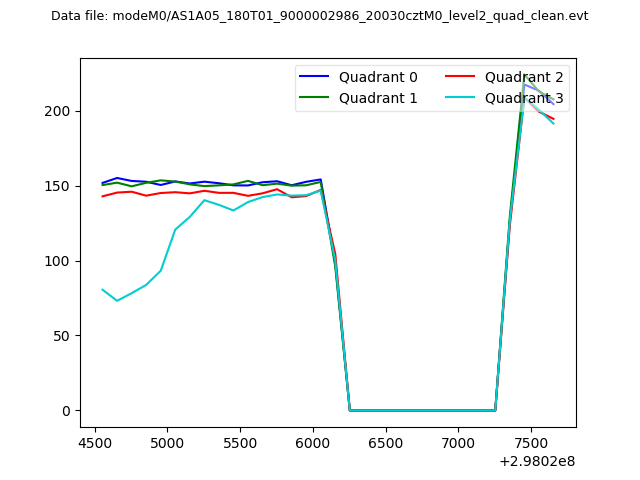 |
|
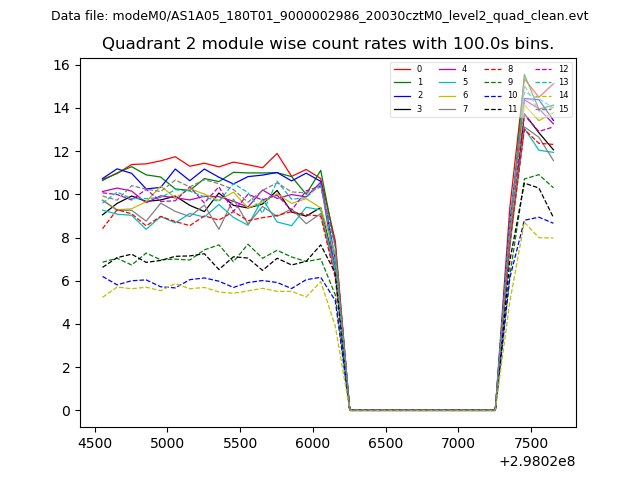
| Module-wise count rates for Quadrant A Data is divided into 100 sec bins |
 |
 |
| Module-wise count rates for Quadrant B Data is divided into 100 sec bins |
 |
 |
| Module-wise count rates for Quadrant C Data is divided into 100 sec bins |
 |
 |
| Module-wise count rates for Quadrant D Data is divided into 100 sec bins |
 |
 |
| Parameter | Plot |
|---|---|
| CZT HV Monitor | 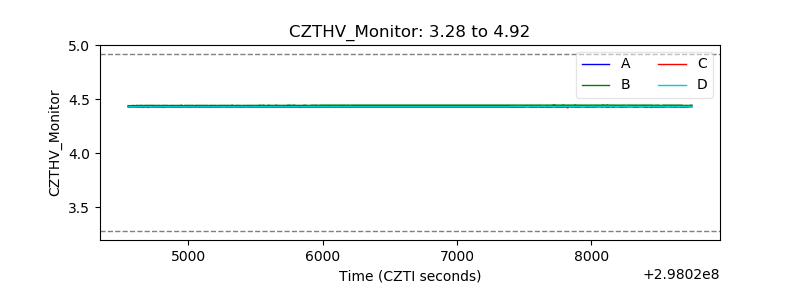 |
| D_VDD | 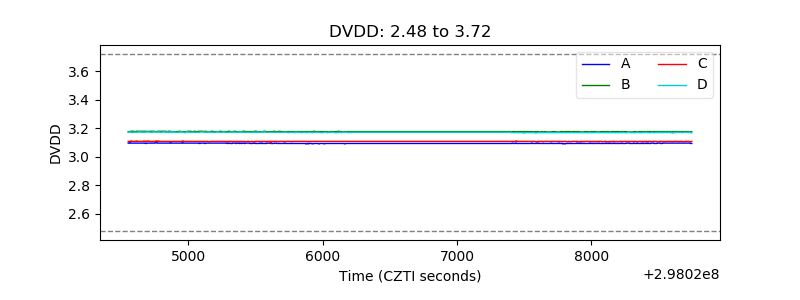 |
| Temperature 1 | 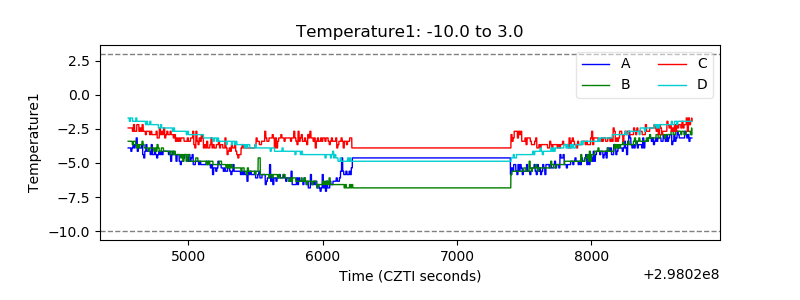 |
| Veto HV Monitor | 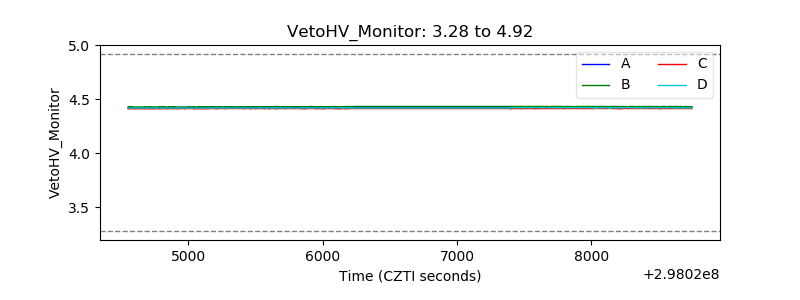 |
| Veto LLD | 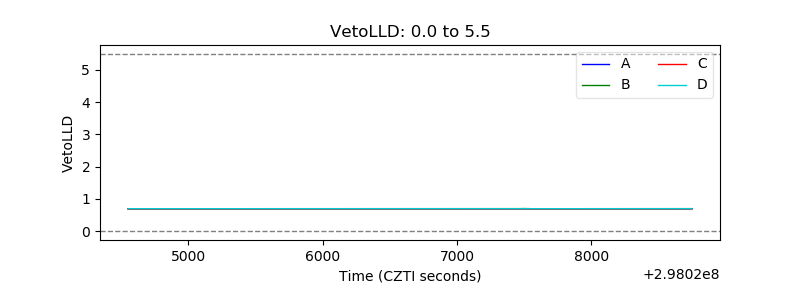 |
| Alpha Counter | 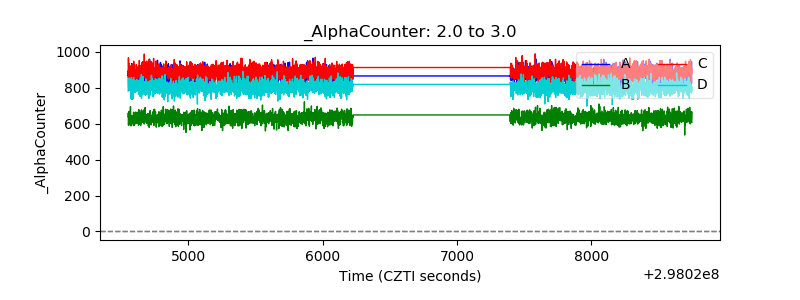 |
| _CPM_Rate | 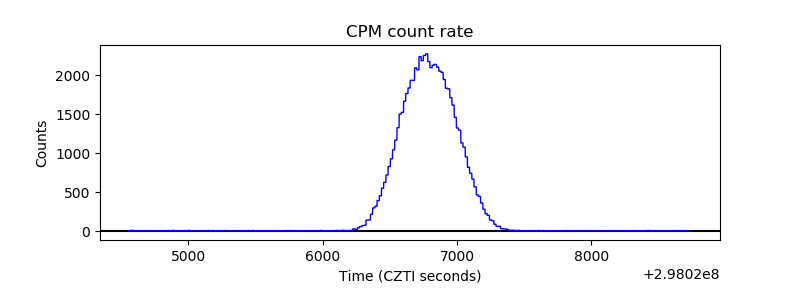 |
| CZT Counter | 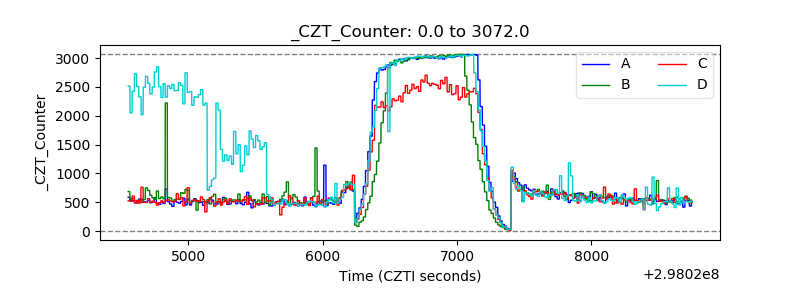 |
| +2.5 Volts monitor |  |
| +5 Volts monitor |  |
| _ROLL_ROT |  |
| _Roll_DEC | 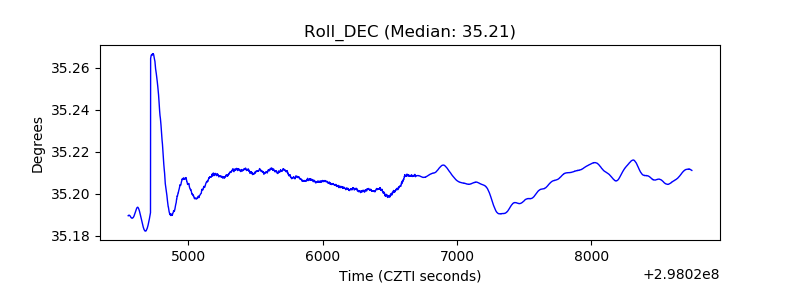 |
| _Roll_RA | 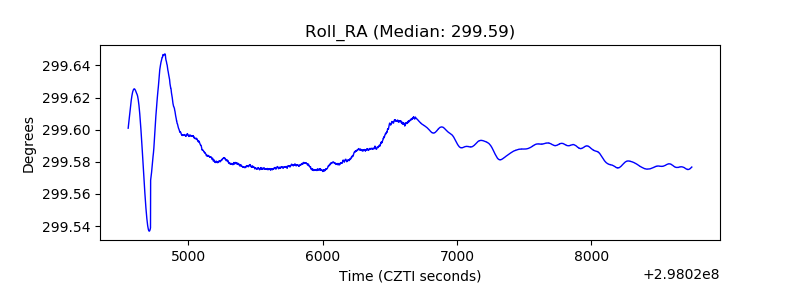 |
| Veto Counter |  |