| Param | Original file | Final file |
|---|---|---|
| Filename | modeM0/AS1A05_180T01_9000002986_20031cztM0_level2.evt | modeM0/AS1A05_180T01_9000002986_20031cztM0_level2_quad_clean.evt |
| Size (bytes) | 509,186,880 | 75,032,640 |
| Size | 485.6 MB | 71.6 MB |
| Events in quadrant A | 4,009,222 | 468,357 |
| Events in quadrant B | 3,677,176 | 472,209 |
| Events in quadrant C | 3,480,421 | 449,519 |
| Events in quadrant D | 3,828,142 | 443,794 |
| Mode SS | |||
|---|---|---|---|
| Quadrant | BADHDUFLAG | Total packets | Discarded packets |
| A | 0 | 126 | 0 |
| B | 0 | 126 | 0 |
| C | 0 | 126 | 0 |
| D | 0 | 126 | 0 |
| Mode M9 | |||
|---|---|---|---|
| Quadrant | BADHDUFLAG | Total packets | Discarded packets |
| A | 0 | 16 | 0 |
| B | 0 | 17 | 0 |
| C | 0 | 17 | 0 |
| D | 0 | 17 | 0 |
| Mode M0 | |||
|---|---|---|---|
| Quadrant | BADHDUFLAG | Total packets | Discarded packets |
| A | 0 | 15866 | 2 |
| B | 0 | 14815 | 2 |
| C | 0 | 14040 | 2 |
| D | 0 | 15312 | 2 |
| Quadrant | Total seconds | Saturated seconds | Saturation percentage |
|---|---|---|---|
| A | 6284 | 216 | 3.437301% |
| B | 6284 | 122 | 1.941439% |
| C | 6283 | 106 | 1.687092% |
| D | 6283 | 128 | 2.037243% |
Noise dominated data is calculated using 1-second bins in cleaned event files. If a bin has >2000 counts, and if more than 50% of those come from <1% of pixels, then it is considered to be noise-dominated and hence unusable.
| Quadrant | # 1 sec bins | Bins with >0 counts | Bins with >2000 counts | High rate bins dominated by noise | Noise dominated (total time) | Noise dominated (detector-on time) | Marked lightcurve |
|---|---|---|---|---|---|---|---|
| A | 7554 | 6285 | 84 | 84 | 1.11% | 1.34% | 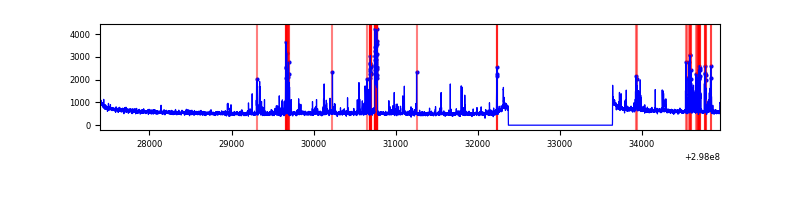 |
| B | 7554 | 6285 | 17 | 17 | 0.23% | 0.27% | 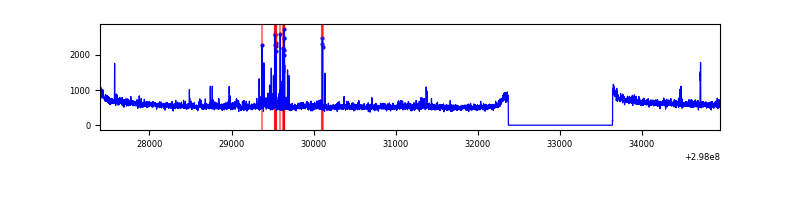 |
| C | 7553 | 6284 | 1 | 1 | 0.01% | 0.02% | 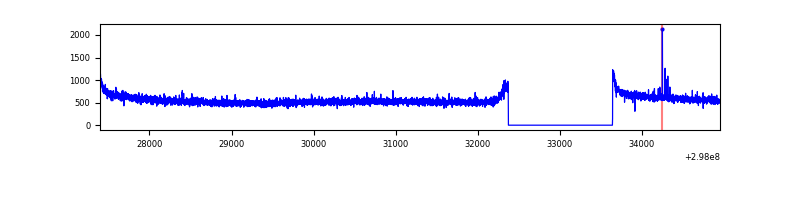 |
| D | 7553 | 6284 | 63 | 63 | 0.83% | 1.00% | 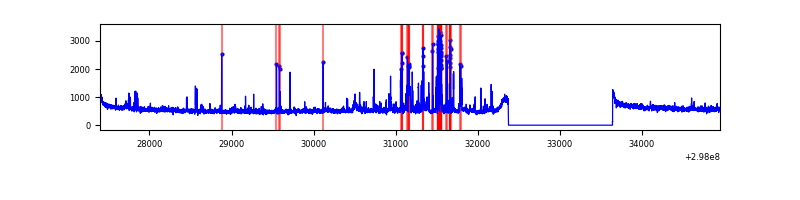 |
Top three noisy pixels from each quadrant. If the there are fewer than three noisy pixels in the level2.evt file, extra rows are filled as -1
| Pixel properties | Quadrant properties | ||||||
|---|---|---|---|---|---|---|---|
| Quadrant | DetID | PixID | Counts | Sigma | Mean | Median | Sigma |
| A | 5 | 16 | 516437 | 2912.51 | 899 | 887 | 177.0 |
| A | 4 | 2 | 24357 | 132.59 | 899 | 887 | 177.0 |
| A | 13 | 254 | 8438 | 42.66 | 899 | 887 | 177.0 |
| B | 7 | 220 | 97018 | 578.84 | 889 | 870 | 166.1 |
| B | 0 | 189 | 42997 | 253.62 | 889 | 870 | 166.1 |
| B | 12 | 111 | 18684 | 107.25 | 889 | 870 | 166.1 |
| C | 14 | 238 | 137021 | 701.29 | 849 | 859 | 194.2 |
| C | 4 | 254 | 15924 | 77.59 | 849 | 859 | 194.2 |
| C | 3 | 233 | 15073 | 73.21 | 849 | 859 | 194.2 |
| D | 7 | 38 | 246853 | 1177.85 | 871 | 848 | 208.9 |
| D | 1 | 52 | 162425 | 773.62 | 871 | 848 | 208.9 |
| D | 13 | 249 | 57405 | 270.79 | 871 | 848 | 208.9 |
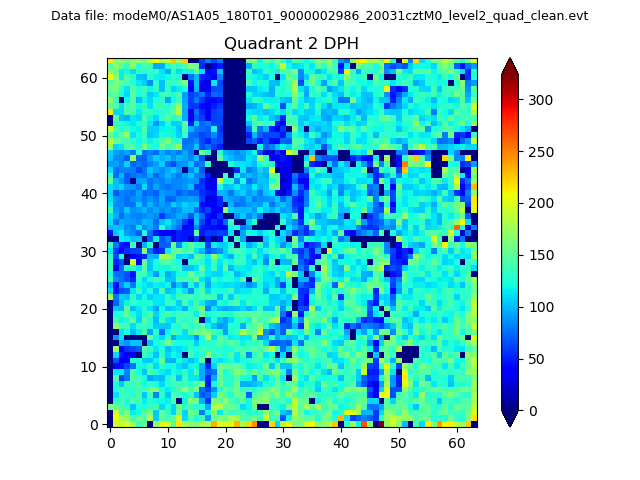
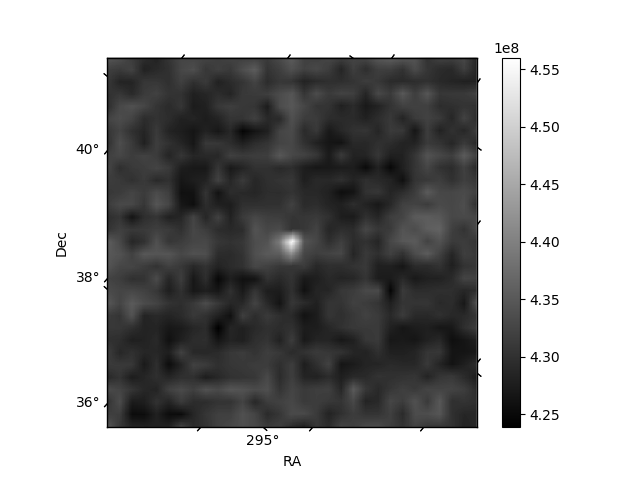
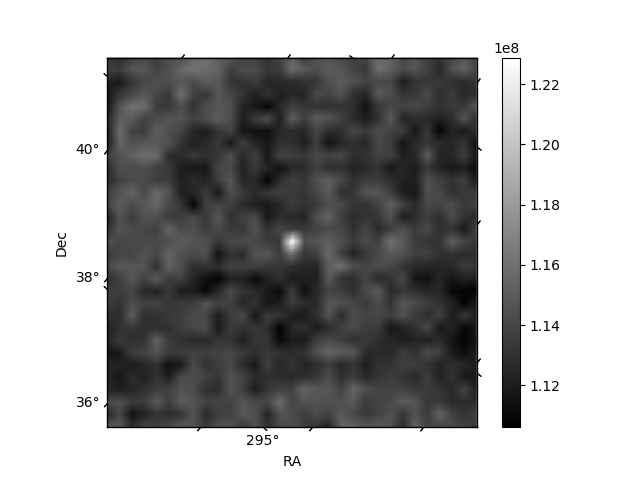
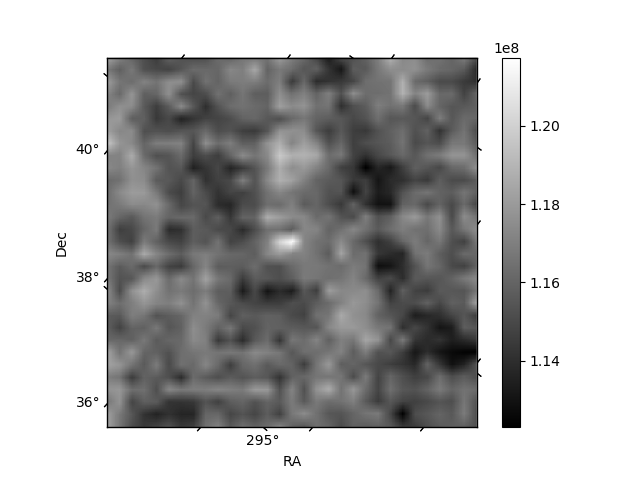
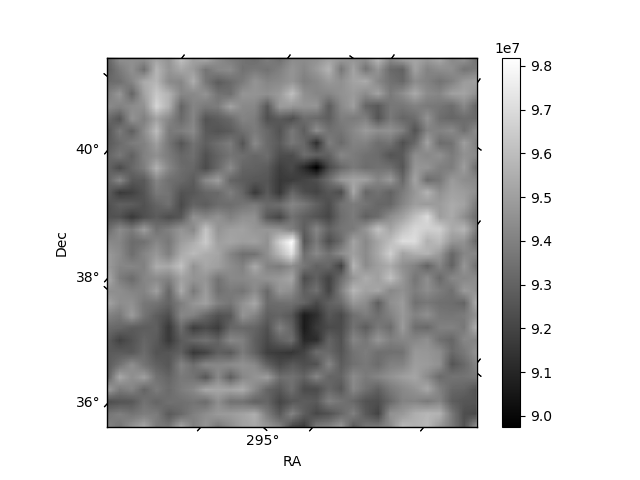
Histogram calculated using DETX and DETY for each event in the final _common_clean file
| Quadrant A | 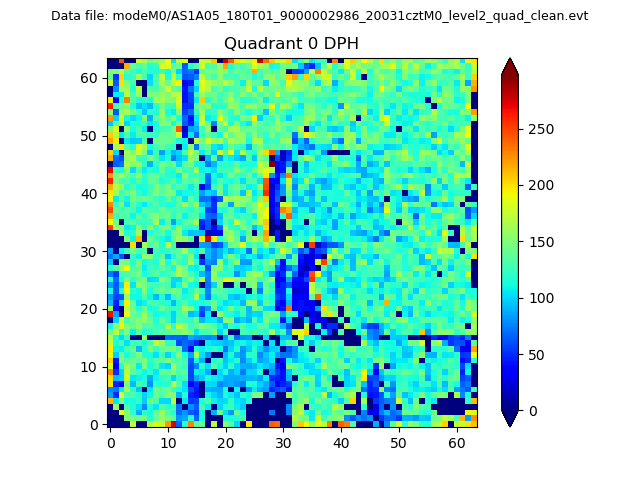 |
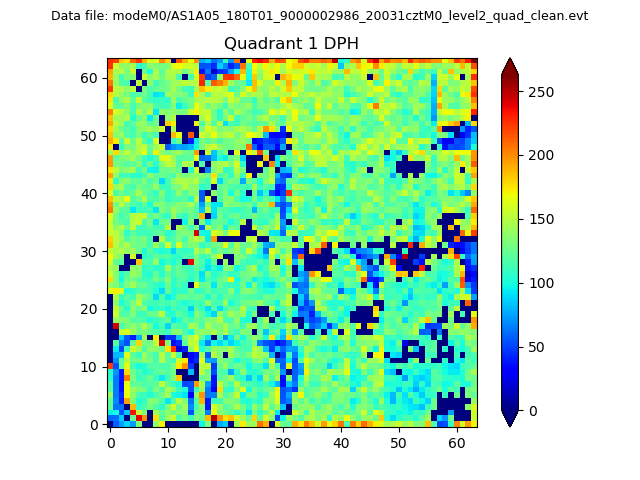 |
Quadrant B |
|---|---|---|---|
| Quadrant D | 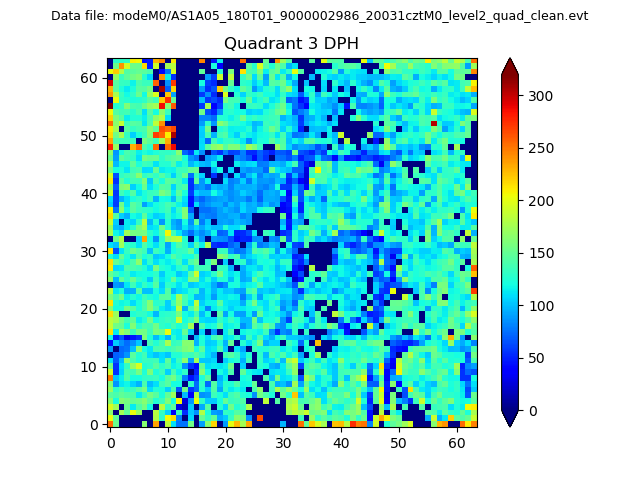 |
 |
Quadrant C |
| Plot type | Count rate plots | Images |
|---|---|---|
| Comparison with Poisson distribution Blue bars denote a histogram of data divided into 1 sec bins. Red curve is a Poisson curve with rate = median count rate of data. |
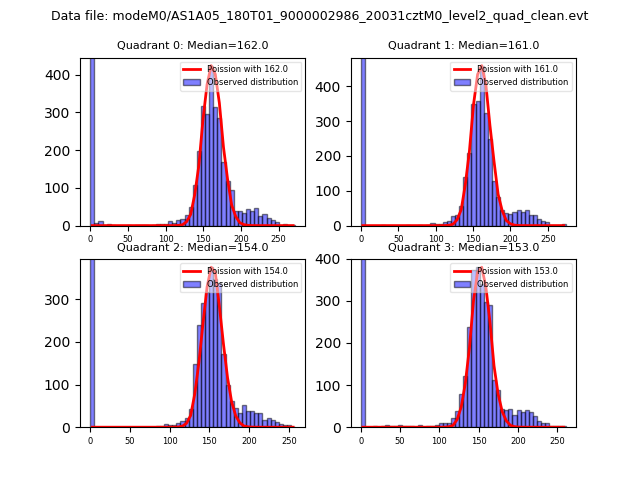 |
 |
| Quadrant-wise count rates Data is divided into 100 sec bins |
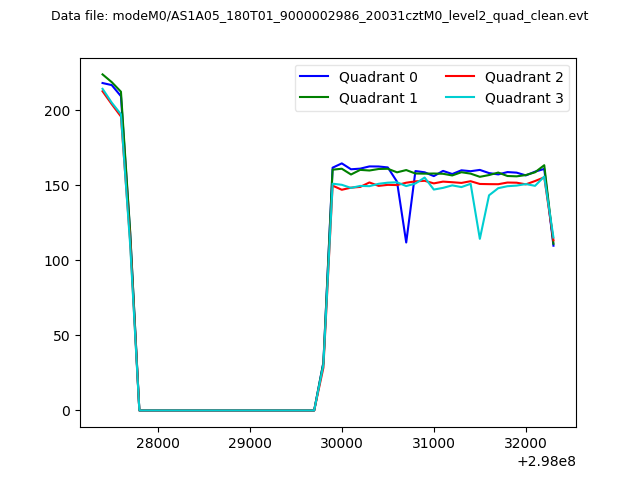 |
|
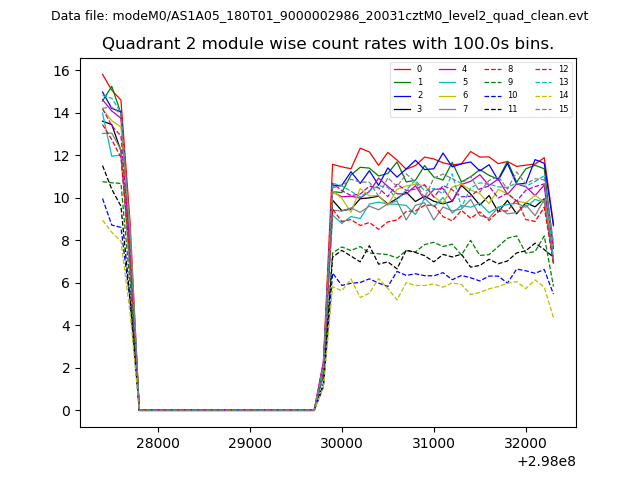
| Module-wise count rates for Quadrant A Data is divided into 100 sec bins |
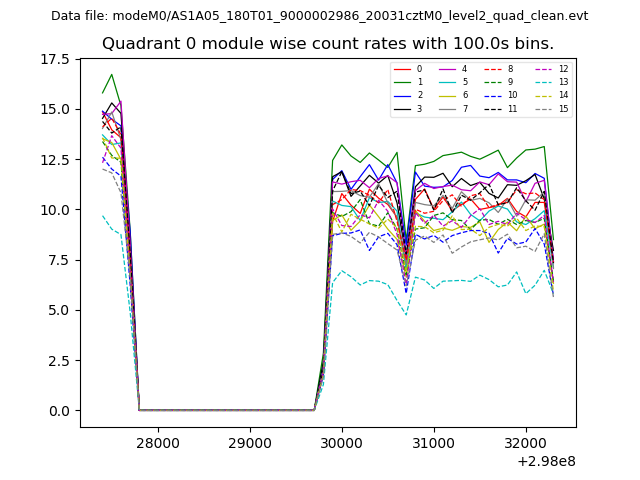 |
 |
| Module-wise count rates for Quadrant B Data is divided into 100 sec bins |
 |
 |
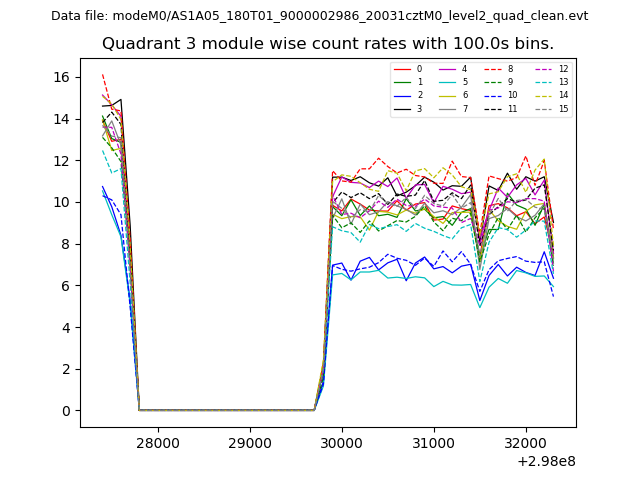
| Module-wise count rates for Quadrant C Data is divided into 100 sec bins |
 |
 |
| Module-wise count rates for Quadrant D Data is divided into 100 sec bins |
 |
 |
| Parameter | Plot |
|---|---|
| CZT HV Monitor | 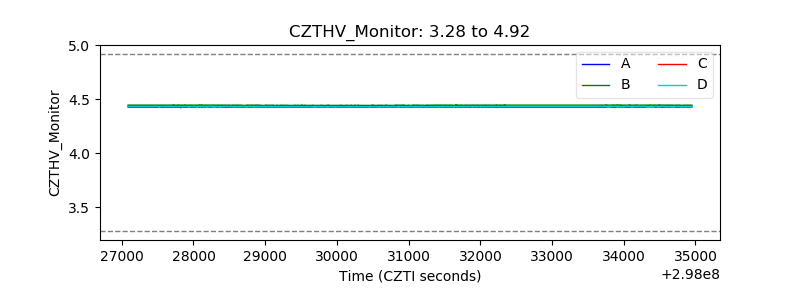 |
| D_VDD | 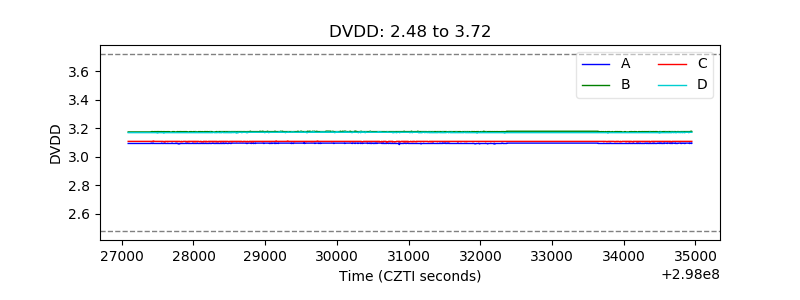 |
| Temperature 1 | 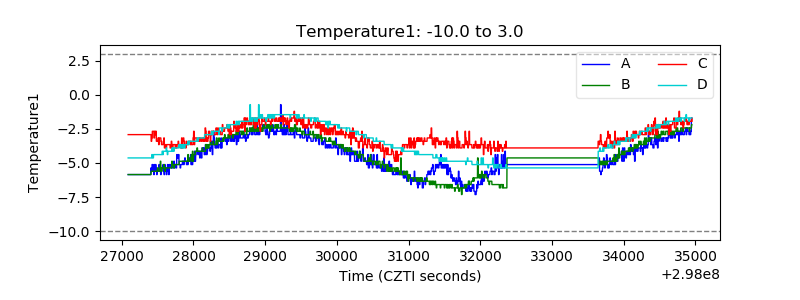 |
| Veto HV Monitor | 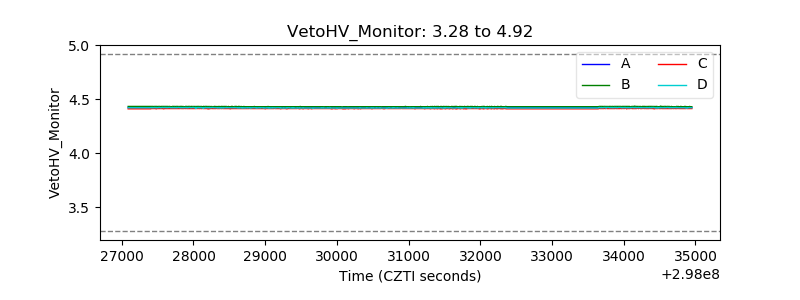 |
| Veto LLD | 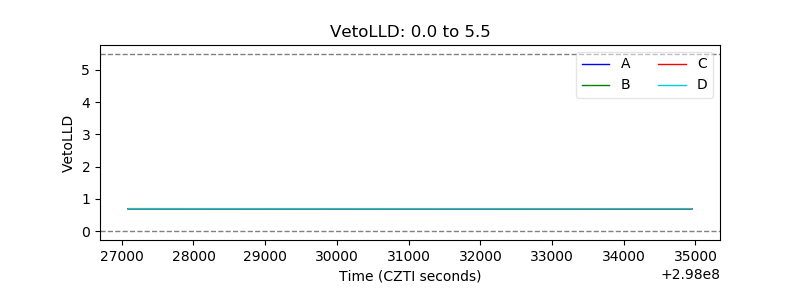 |
| Alpha Counter | 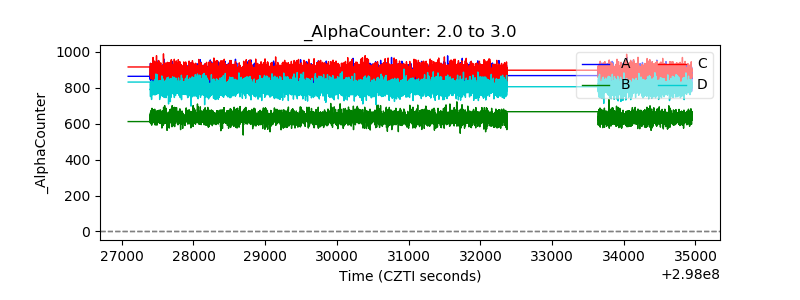 |
| _CPM_Rate | 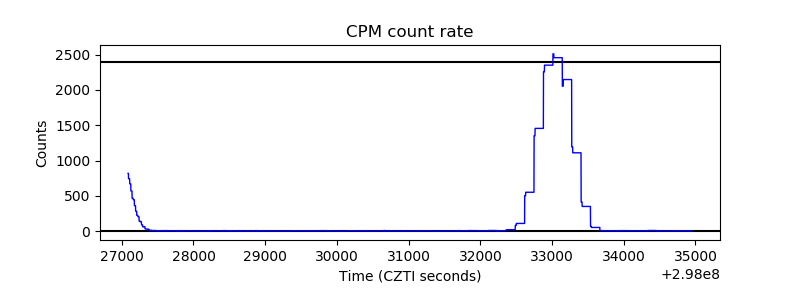 |
| CZT Counter | 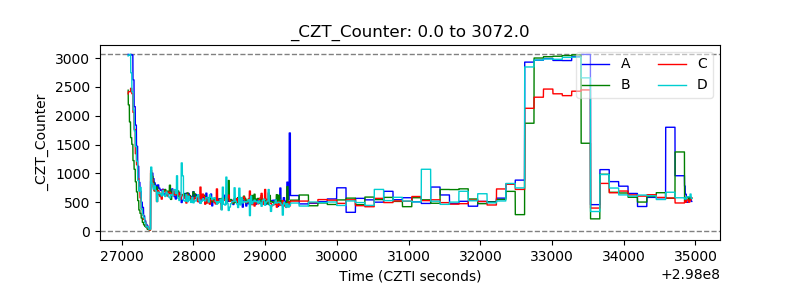 |
| +2.5 Volts monitor |  |
| +5 Volts monitor |  |
| _ROLL_ROT | 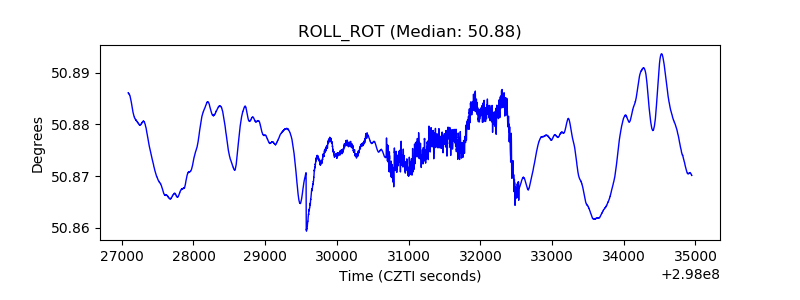 |
| _Roll_DEC | 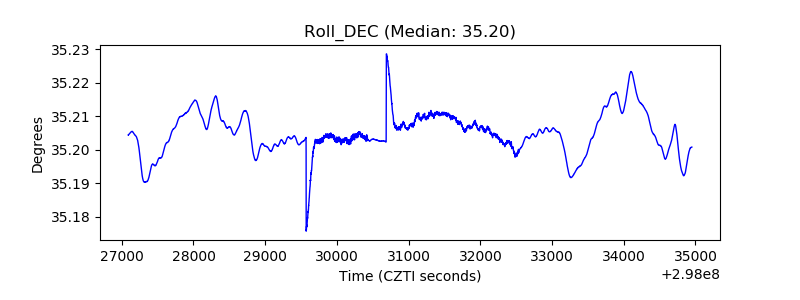 |
| _Roll_RA | 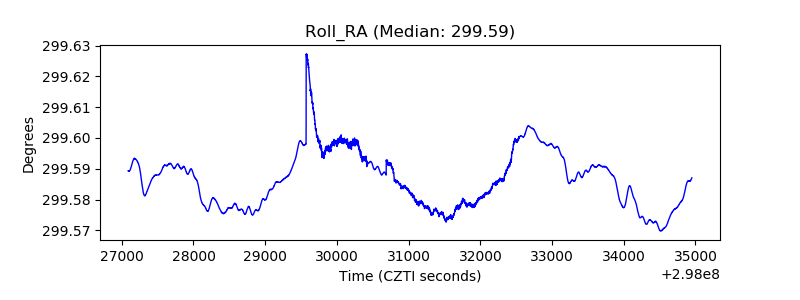 |
| Veto Counter | 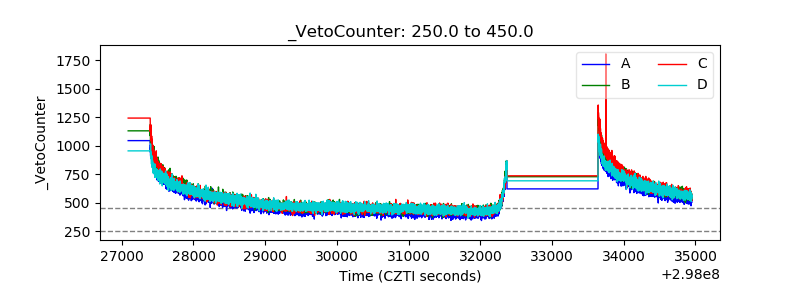 |