| Param | Original file | Final file |
|---|---|---|
| Filename | modeM0/AS1A05_180T01_9000002986_20034cztM0_level2.evt | modeM0/AS1A05_180T01_9000002986_20034cztM0_level2_quad_clean.evt |
| Size (bytes) | 489,078,720 | 105,480,000 |
| Size | 466.4 MB | 100.6 MB |
| Events in quadrant A | 3,677,340 | 702,065 |
| Events in quadrant B | 3,706,276 | 701,652 |
| Events in quadrant C | 3,531,368 | 674,093 |
| Events in quadrant D | 3,464,521 | 672,568 |
| Mode SS | |||
|---|---|---|---|
| Quadrant | BADHDUFLAG | Total packets | Discarded packets |
| A | 0 | 130 | 0 |
| B | 0 | 130 | 0 |
| C | 0 | 130 | 0 |
| D | 0 | 130 | 0 |
| Mode M9 | |||
|---|---|---|---|
| Quadrant | BADHDUFLAG | Total packets | Discarded packets |
| A | 0 | 23 | 0 |
| B | 0 | 24 | 0 |
| C | 0 | 24 | 0 |
| D | 0 | 24 | 0 |
| Mode M0 | |||
|---|---|---|---|
| Quadrant | BADHDUFLAG | Total packets | Discarded packets |
| A | 0 | 14757 | 2 |
| B | 0 | 14907 | 2 |
| C | 0 | 14161 | 2 |
| D | 0 | 14086 | 2 |
| Quadrant | Total seconds | Saturated seconds | Saturation percentage |
|---|---|---|---|
| A | 6365 | 170 | 2.670856% |
| B | 6365 | 186 | 2.922231% |
| C | 6365 | 182 | 2.859387% |
| D | 6365 | 104 | 1.633936% |
Noise dominated data is calculated using 1-second bins in cleaned event files. If a bin has >2000 counts, and if more than 50% of those come from <1% of pixels, then it is considered to be noise-dominated and hence unusable.
| Quadrant | # 1 sec bins | Bins with >0 counts | Bins with >2000 counts | High rate bins dominated by noise | Noise dominated (total time) | Noise dominated (detector-on time) | Marked lightcurve |
|---|---|---|---|---|---|---|---|
| A | 7585 | 6366 | 14 | 14 | 0.18% | 0.22% | 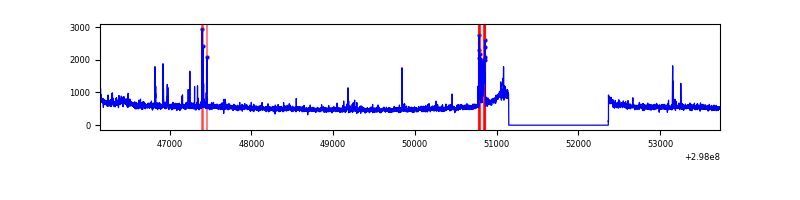 |
| B | 7585 | 6366 | 26 | 26 | 0.34% | 0.41% | 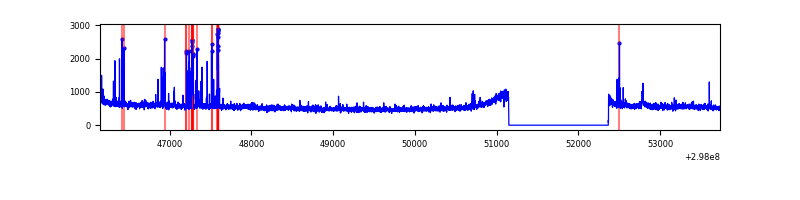 |
| C | 7585 | 6366 | 1 | 1 | 0.01% | 0.02% | 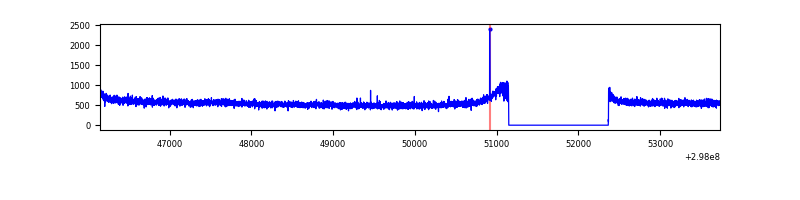 |
| D | 7585 | 6366 | 3 | 3 | 0.04% | 0.05% | 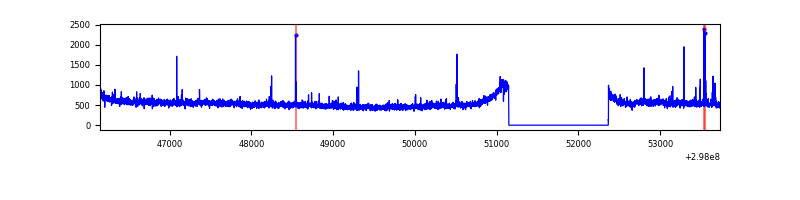 |
Top three noisy pixels from each quadrant. If the there are fewer than three noisy pixels in the level2.evt file, extra rows are filled as -1
| Pixel properties | Quadrant properties | ||||||
|---|---|---|---|---|---|---|---|
| Quadrant | DetID | PixID | Counts | Sigma | Mean | Median | Sigma |
| A | 14 | 238 | 126080 | 696.95 | 901 | 888 | 179.6 |
| A | 14 | 254 | 59793 | 327.93 | 901 | 888 | 179.6 |
| A | 11 | 29 | 22369 | 119.59 | 901 | 888 | 179.6 |
| B | 15 | 201 | 143895 | 852.59 | 890 | 873 | 167.7 |
| B | 4 | 80 | 32076 | 186.01 | 890 | 873 | 167.7 |
| B | 12 | 111 | 19051 | 108.36 | 890 | 873 | 167.7 |
| C | 14 | 238 | 137305 | 681.08 | 867 | 878 | 200.3 |
| C | 4 | 254 | 7137 | 31.25 | 867 | 878 | 200.3 |
| C | 13 | 61 | 6071 | 25.92 | 867 | 878 | 200.3 |
| D | 1 | 52 | 72252 | 334.77 | 886 | 864 | 213.2 |
| D | 2 | 234 | 22866 | 103.18 | 886 | 864 | 213.2 |
| D | 2 | 120 | 19620 | 87.95 | 886 | 864 | 213.2 |
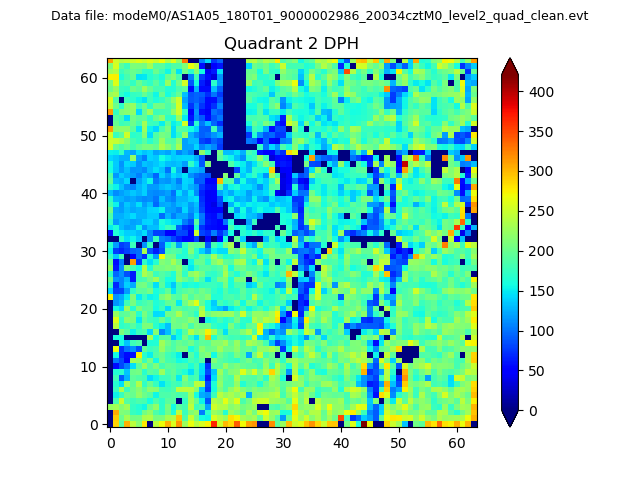
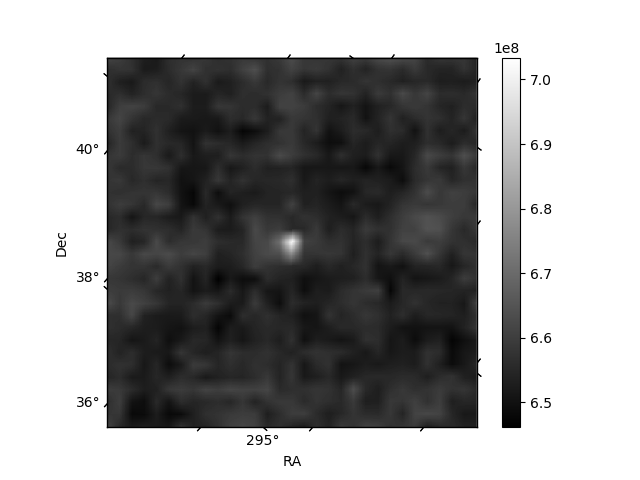
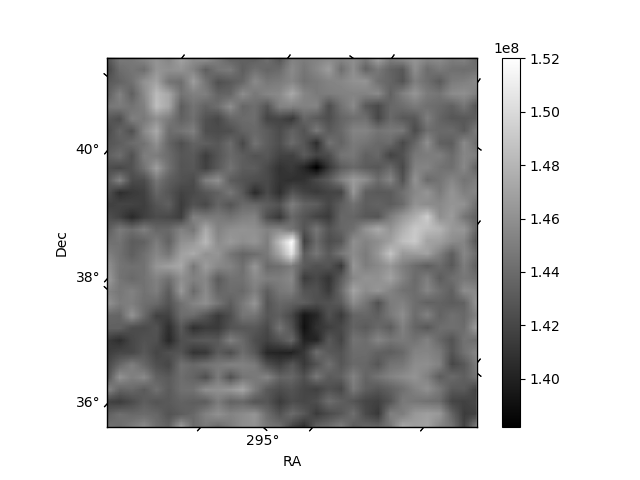
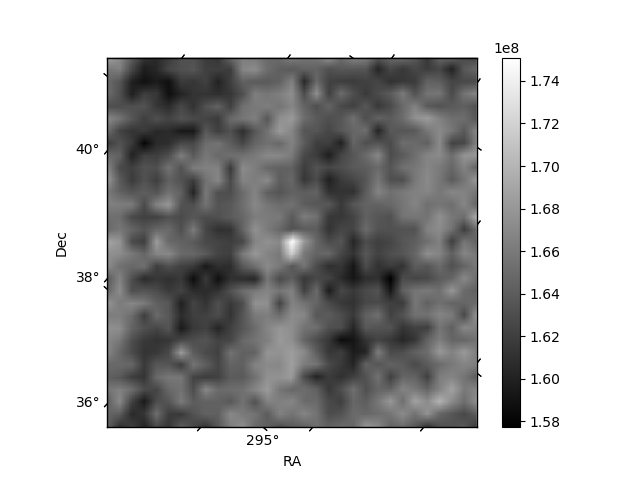
Histogram calculated using DETX and DETY for each event in the final _common_clean file
| Quadrant A | 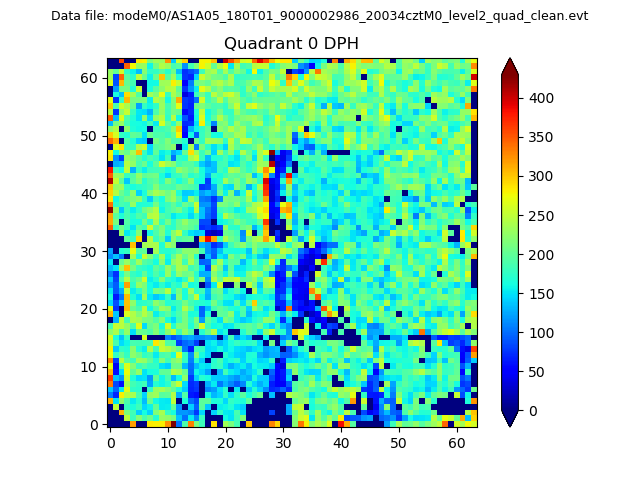 |
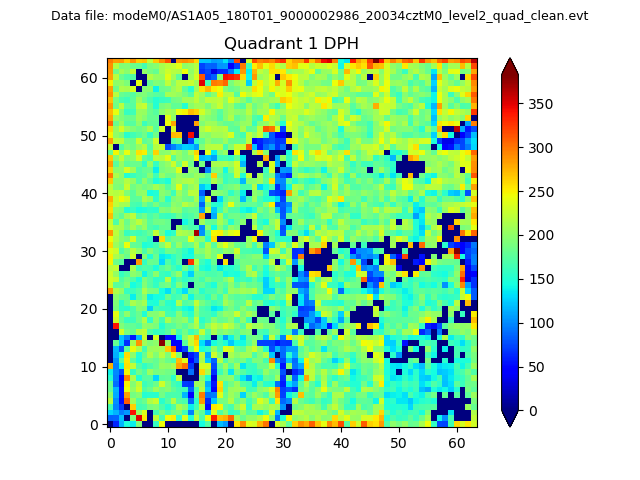 |
Quadrant B |
|---|---|---|---|
| Quadrant D | 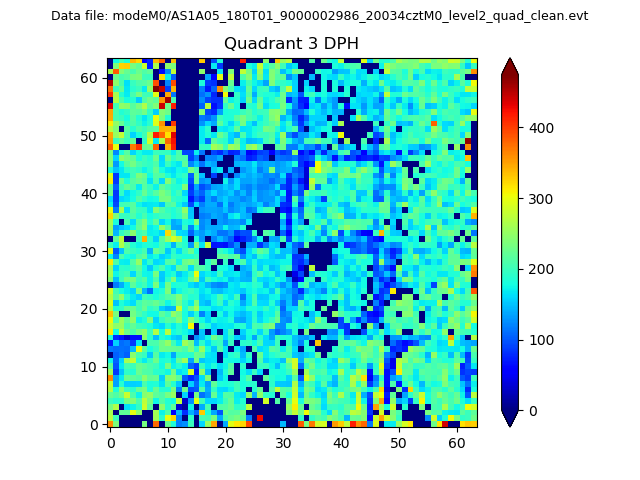 |
 |
Quadrant C |
| Plot type | Count rate plots | Images |
|---|---|---|
| Comparison with Poisson distribution Blue bars denote a histogram of data divided into 1 sec bins. Red curve is a Poisson curve with rate = median count rate of data. |
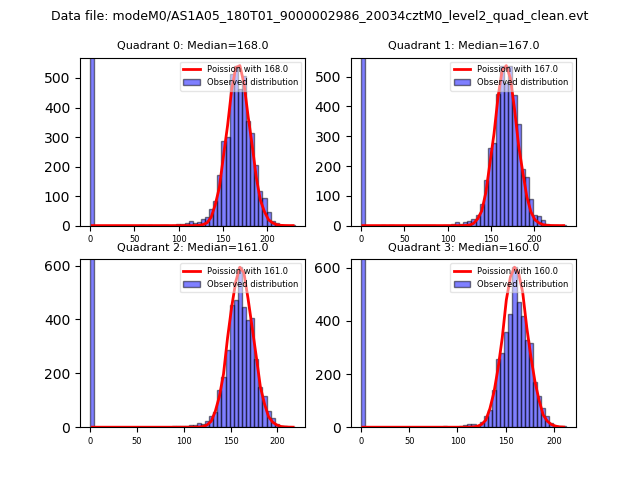 |
 |
| Quadrant-wise count rates Data is divided into 100 sec bins |
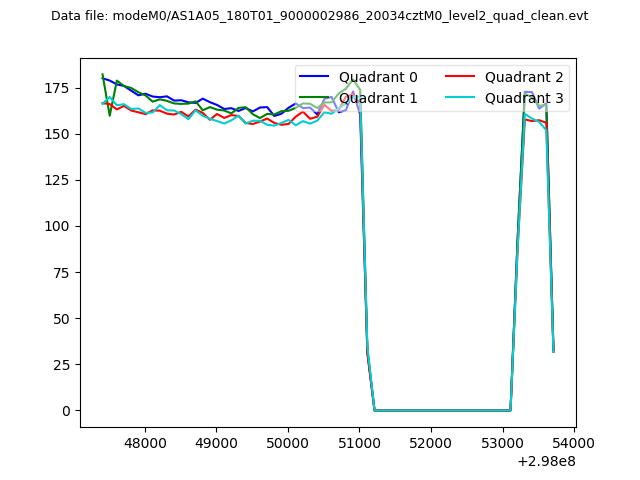 |
|
| Module-wise count rates for Quadrant A Data is divided into 100 sec bins |
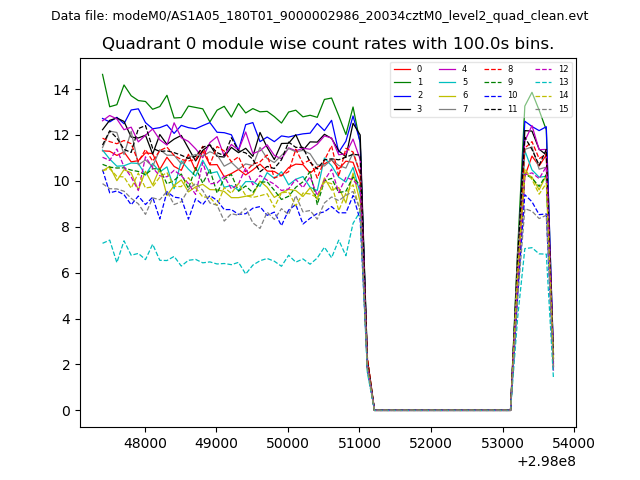 |
 |
| Module-wise count rates for Quadrant B Data is divided into 100 sec bins |
 |
 |
| Module-wise count rates for Quadrant C Data is divided into 100 sec bins |
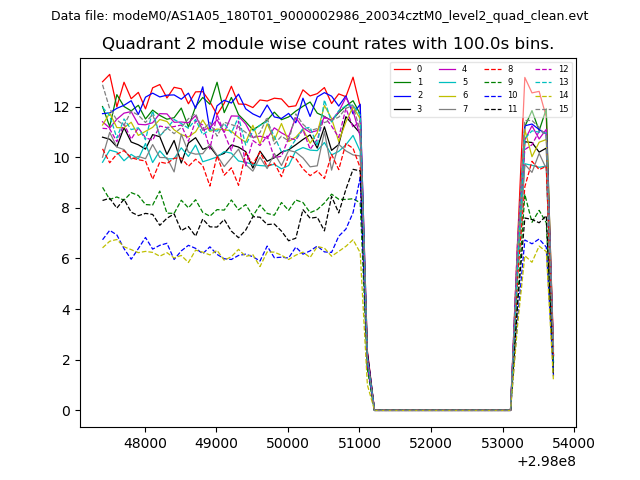 |
 |
| Module-wise count rates for Quadrant D Data is divided into 100 sec bins |
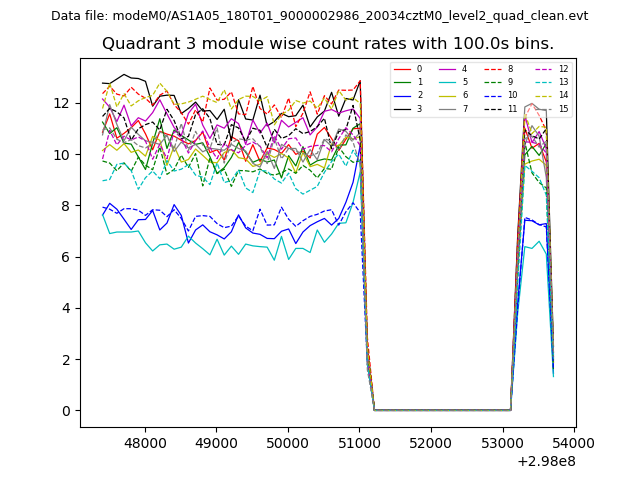 |
 |
| Parameter | Plot |
|---|---|
| CZT HV Monitor | 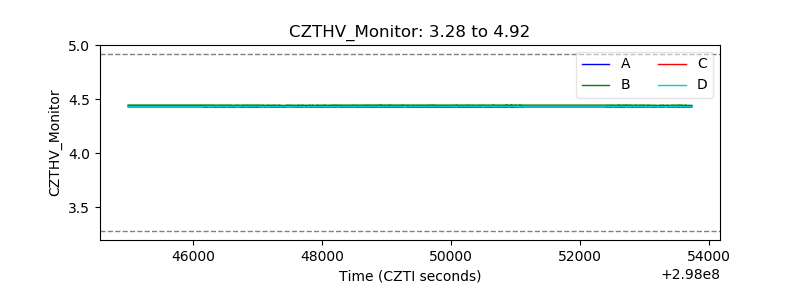 |
| D_VDD | 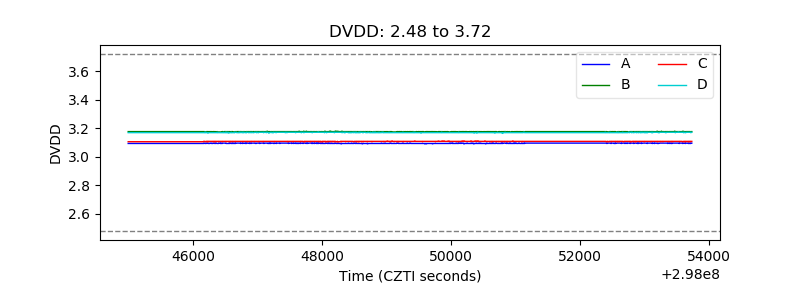 |
| Temperature 1 | 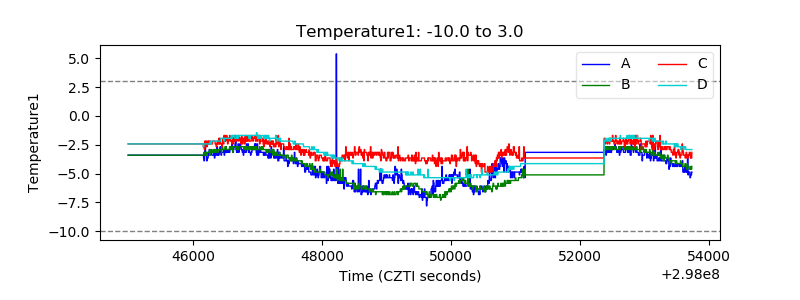 |
| Veto HV Monitor | 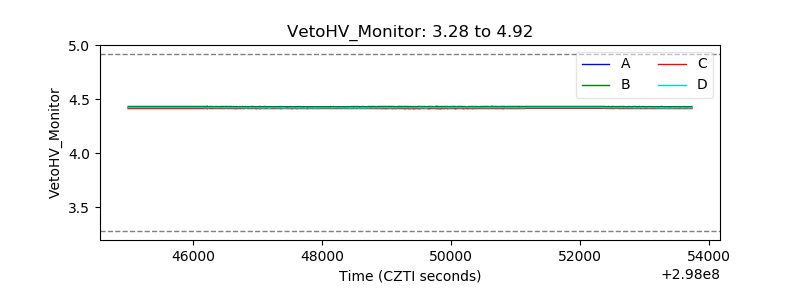 |
| Veto LLD | 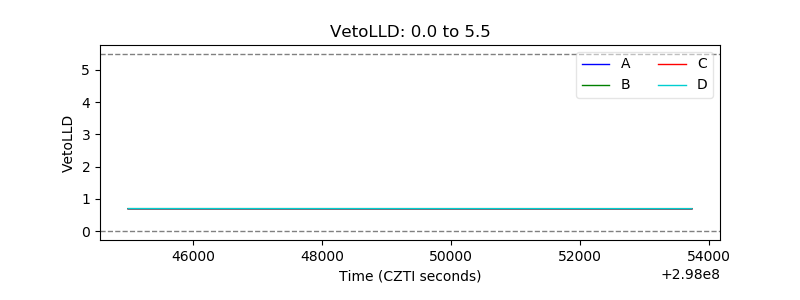 |
| Alpha Counter | 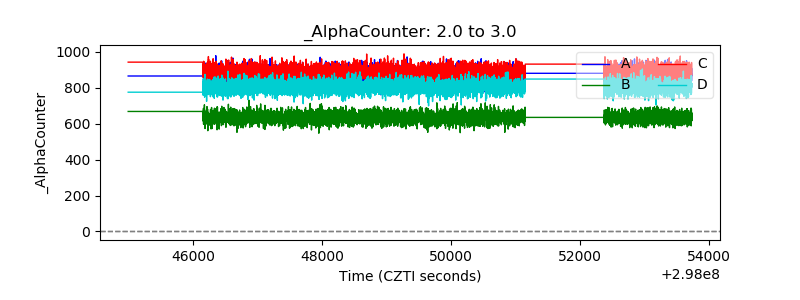 |
| _CPM_Rate | 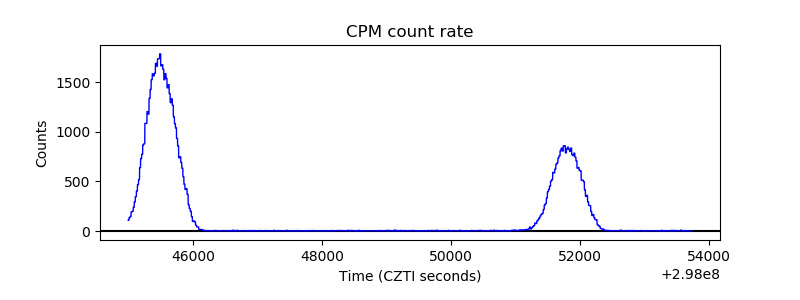 |
| CZT Counter | 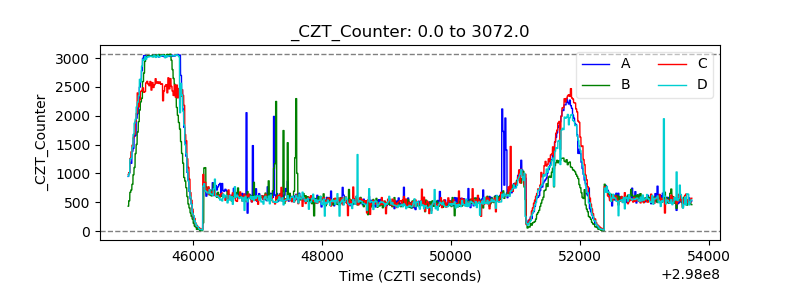 |
| +2.5 Volts monitor | 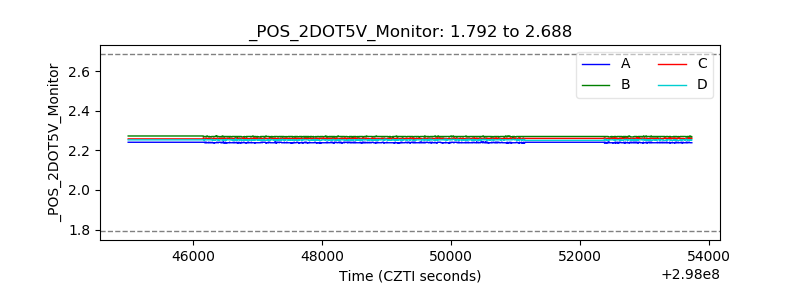 |
| +5 Volts monitor |  |
| _ROLL_ROT | 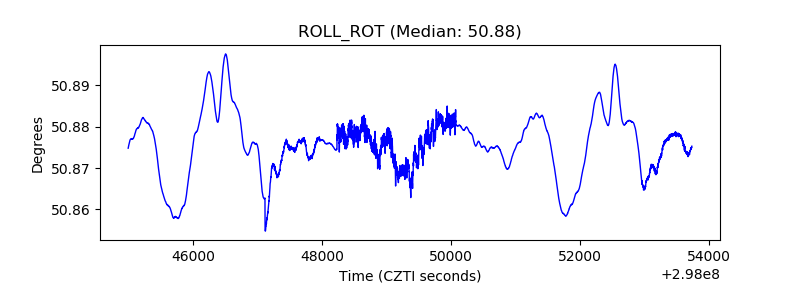 |
| _Roll_DEC | 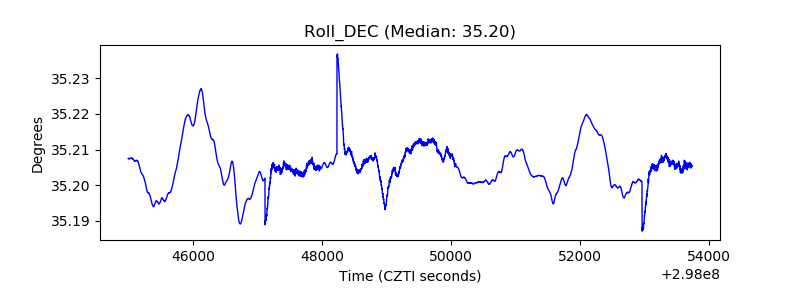 |
| _Roll_RA | 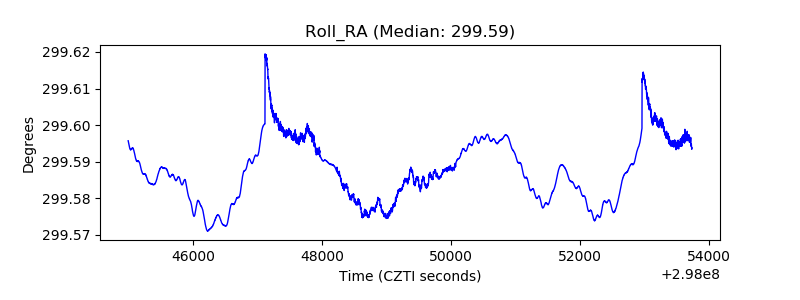 |
| Veto Counter | 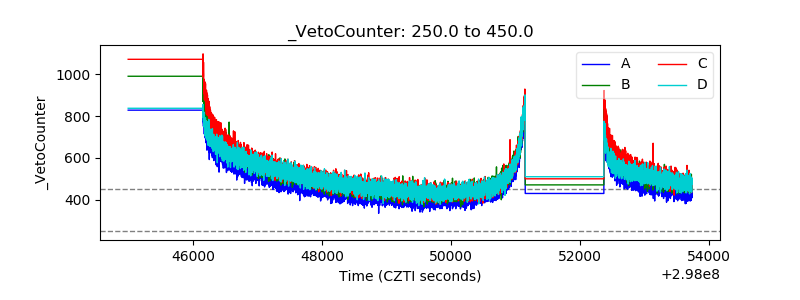 |