| Param | Original file | Final file |
|---|---|---|
| Filename | modeM0/AS1A05_180T01_9000002986_20035cztM0_level2.evt | modeM0/AS1A05_180T01_9000002986_20035cztM0_level2_quad_clean.evt |
| Size (bytes) | 487,635,840 | 108,786,240 |
| Size | 465.0 MB | 103.7 MB |
| Events in quadrant A | 3,279,626 | 736,040 |
| Events in quadrant B | 3,310,334 | 733,661 |
| Events in quadrant C | 3,287,353 | 707,212 |
| Events in quadrant D | 4,459,002 | 673,992 |
| Mode SS | |||
|---|---|---|---|
| Quadrant | BADHDUFLAG | Total packets | Discarded packets |
| A | 0 | 128 | 0 |
| B | 0 | 128 | 0 |
| C | 0 | 128 | 0 |
| D | 0 | 128 | 0 |
| Mode M9 | |||
|---|---|---|---|
| Quadrant | BADHDUFLAG | Total packets | Discarded packets |
| A | 0 | 10 | 0 |
| B | 0 | 10 | 0 |
| C | 0 | 10 | 0 |
| D | 0 | 10 | 0 |
| Mode M0 | |||
|---|---|---|---|
| Quadrant | BADHDUFLAG | Total packets | Discarded packets |
| A | 0 | 13414 | 1 |
| B | 0 | 13447 | 1 |
| C | 0 | 13316 | 1 |
| D | 0 | 17288 | 1 |
| Quadrant | Total seconds | Saturated seconds | Saturation percentage |
|---|---|---|---|
| A | 6364 | 59 | 0.927090% |
| B | 6365 | 78 | 1.225452% |
| C | 6365 | 102 | 1.602514% |
| D | 6365 | 376 | 5.907306% |
Noise dominated data is calculated using 1-second bins in cleaned event files. If a bin has >2000 counts, and if more than 50% of those come from <1% of pixels, then it is considered to be noise-dominated and hence unusable.
| Quadrant | # 1 sec bins | Bins with >0 counts | Bins with >2000 counts | High rate bins dominated by noise | Noise dominated (total time) | Noise dominated (detector-on time) | Marked lightcurve |
|---|---|---|---|---|---|---|---|
| A | 7309 | 6365 | 0 | 0 | 0.00% | 0.00% | 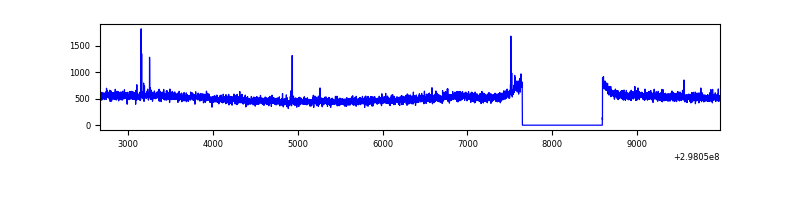 |
| B | 7310 | 6366 | 0 | 0 | 0.00% | 0.00% | 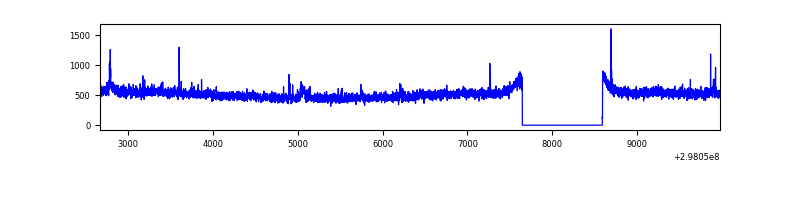 |
| C | 7310 | 6366 | 0 | 0 | 0.00% | 0.00% | 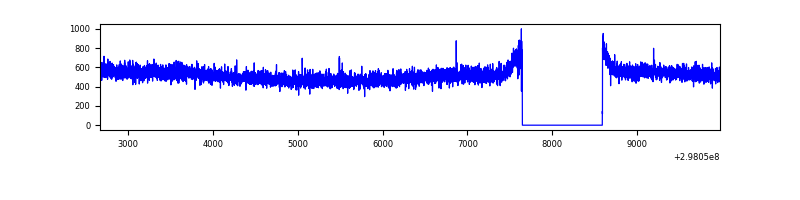 |
| D | 7310 | 6366 | 228 | 228 | 3.12% | 3.58% | 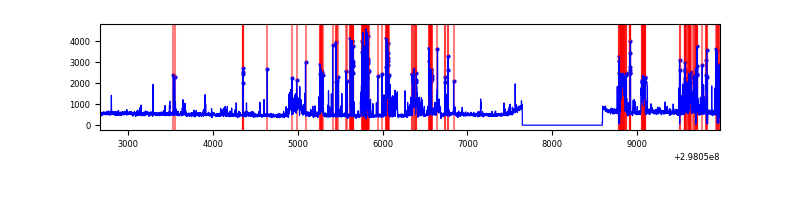 |
Top three noisy pixels from each quadrant. If the there are fewer than three noisy pixels in the level2.evt file, extra rows are filled as -1
| Pixel properties | Quadrant properties | ||||||
|---|---|---|---|---|---|---|---|
| Quadrant | DetID | PixID | Counts | Sigma | Mean | Median | Sigma |
| A | 11 | 29 | 22761 | 128.67 | 840 | 826 | 170.5 |
| A | 14 | 238 | 15860 | 88.19 | 840 | 826 | 170.5 |
| A | 14 | 254 | 8139 | 42.9 | 840 | 826 | 170.5 |
| B | 0 | 198 | 18486 | 111.74 | 833 | 817 | 158.1 |
| B | 12 | 111 | 18127 | 109.47 | 833 | 817 | 158.1 |
| B | 11 | 111 | 15868 | 95.18 | 833 | 817 | 158.1 |
| C | 14 | 238 | 128321 | 674.21 | 808 | 817 | 189.1 |
| C | 13 | 61 | 5648 | 25.55 | 808 | 817 | 189.1 |
| C | 4 | 254 | 5085 | 22.57 | 808 | 817 | 189.1 |
| D | 1 | 52 | 1302663 | 6754.32 | 801 | 782 | 192.7 |
| D | 8 | 195 | 114151 | 588.17 | 801 | 782 | 192.7 |
| D | 2 | 234 | 23899 | 119.93 | 801 | 782 | 192.7 |
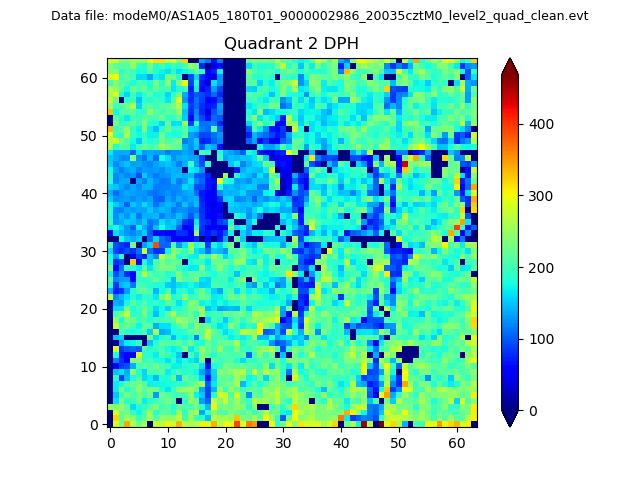
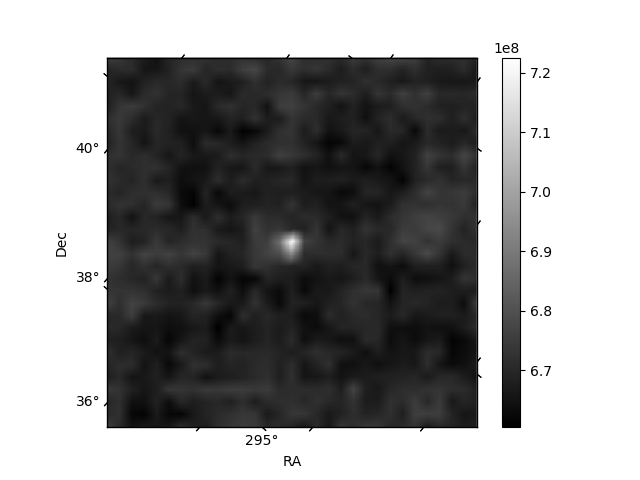
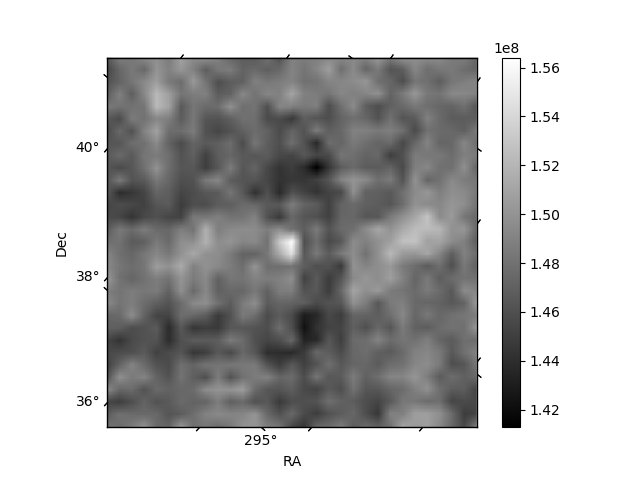
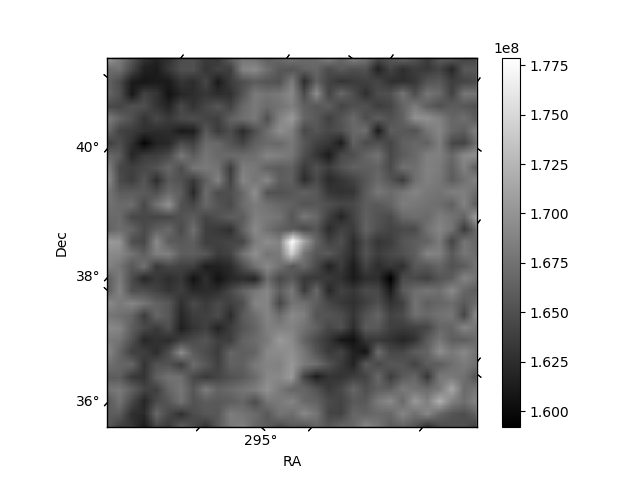
Histogram calculated using DETX and DETY for each event in the final _common_clean file
| Quadrant A | 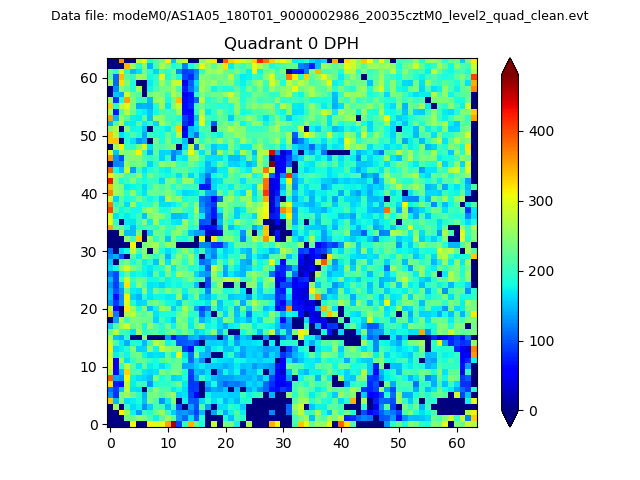 |
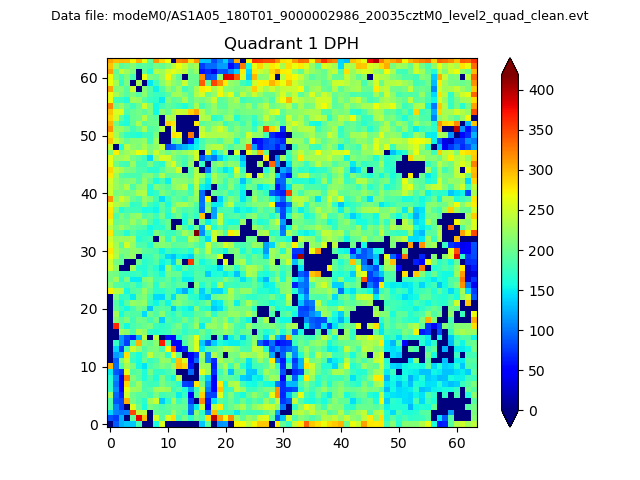 |
Quadrant B |
|---|---|---|---|
| Quadrant D | 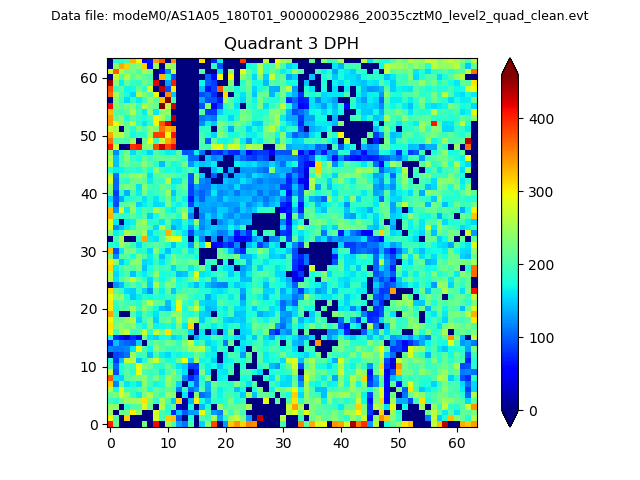 |
 |
Quadrant C |
| Plot type | Count rate plots | Images |
|---|---|---|
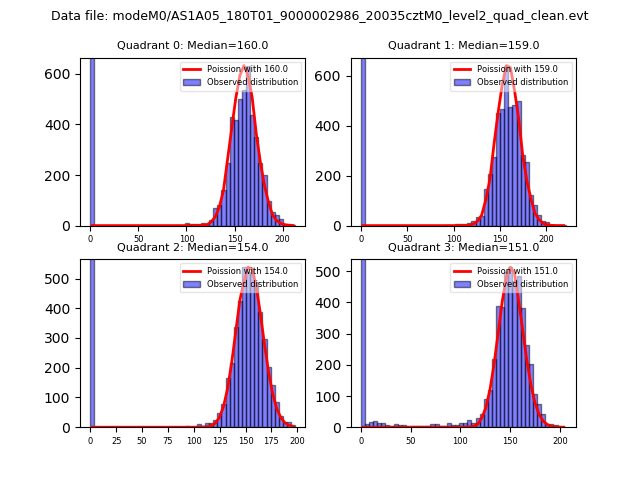
| Comparison with Poisson distribution Blue bars denote a histogram of data divided into 1 sec bins. Red curve is a Poisson curve with rate = median count rate of data. |
 |
 |
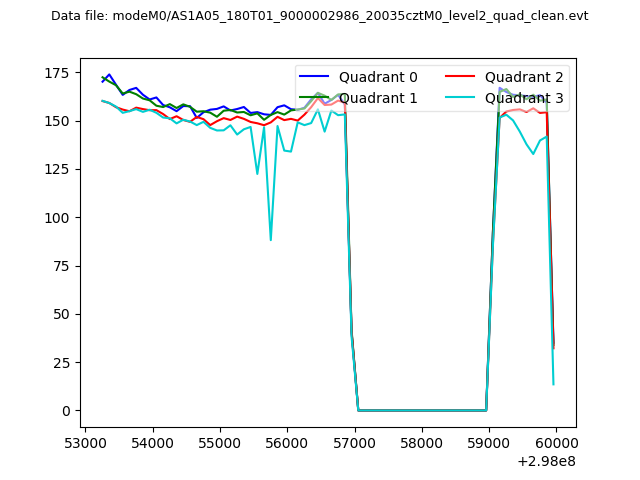
| Quadrant-wise count rates Data is divided into 100 sec bins |
 |
|
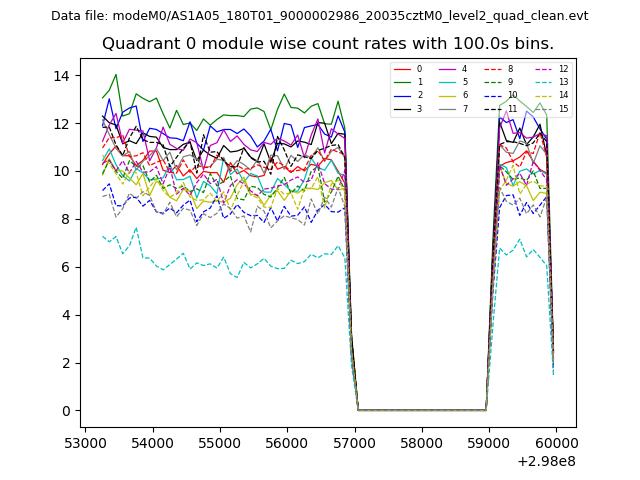
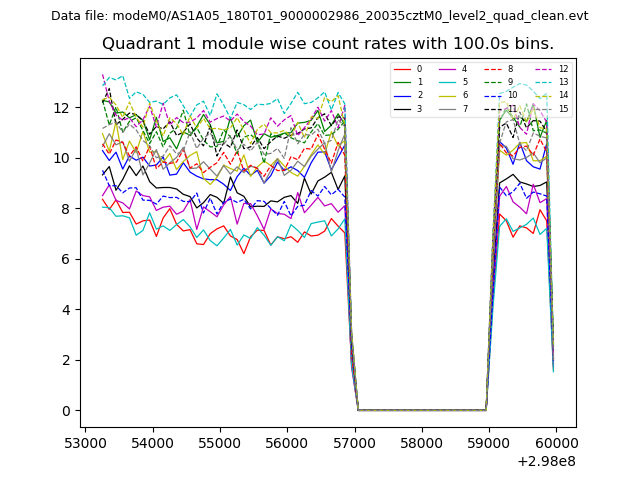
| Module-wise count rates for Quadrant A Data is divided into 100 sec bins |
 |
 |
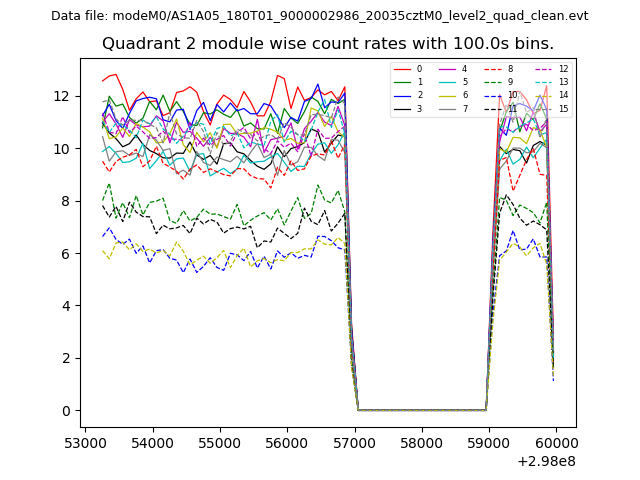
| Module-wise count rates for Quadrant B Data is divided into 100 sec bins |
 |
 |
| Module-wise count rates for Quadrant C Data is divided into 100 sec bins |
 |
 |
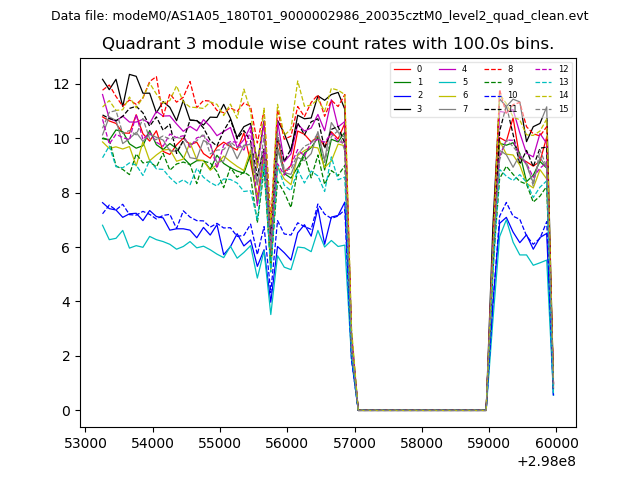
| Module-wise count rates for Quadrant D Data is divided into 100 sec bins |
 |
 |
| Parameter | Plot |
|---|---|
| CZT HV Monitor | 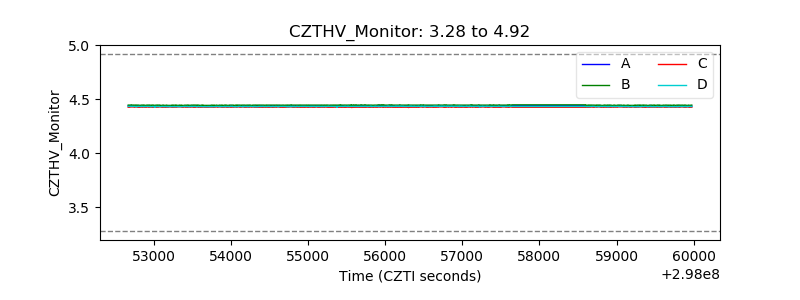 |
| D_VDD | 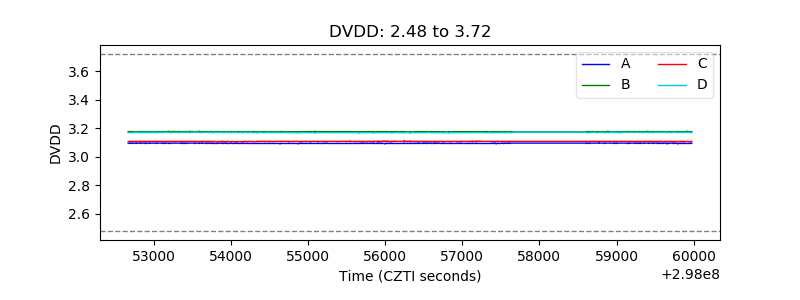 |
| Temperature 1 | 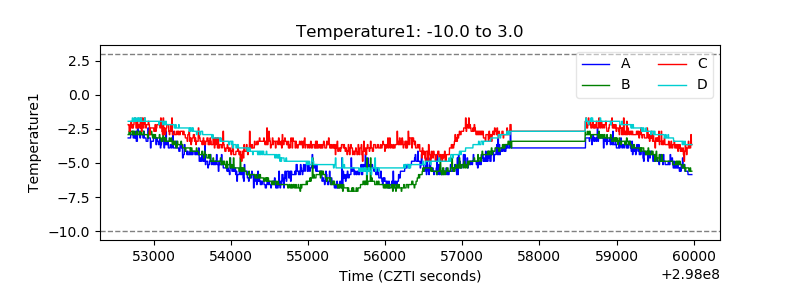 |
| Veto HV Monitor | 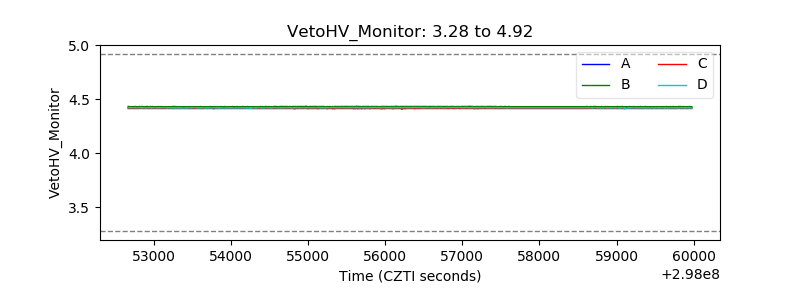 |
| Veto LLD | 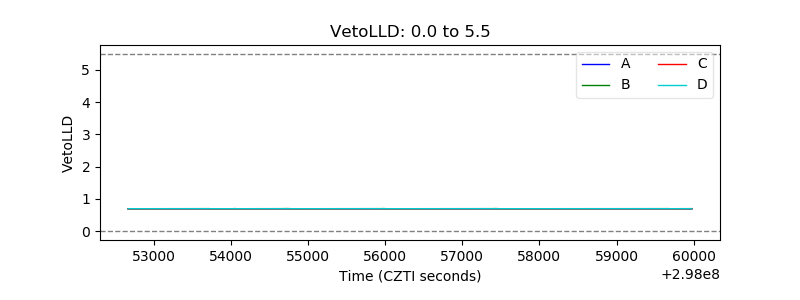 |
| Alpha Counter | 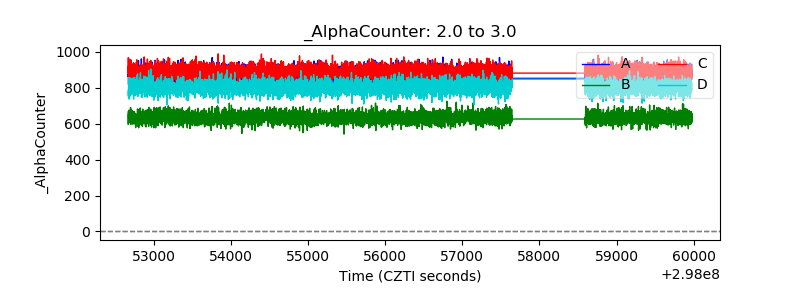 |
| _CPM_Rate | 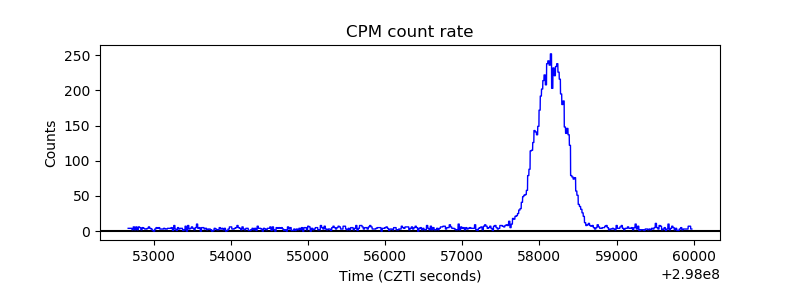 |
| CZT Counter | 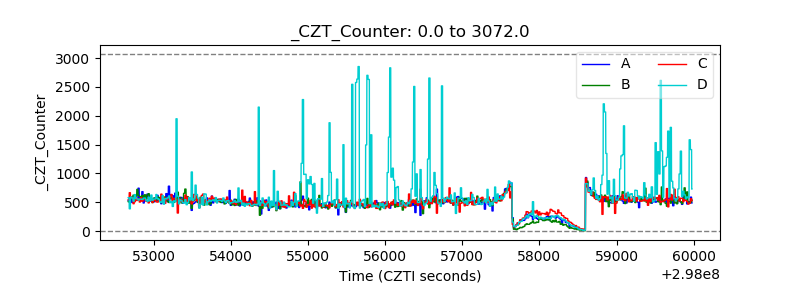 |
| +2.5 Volts monitor | 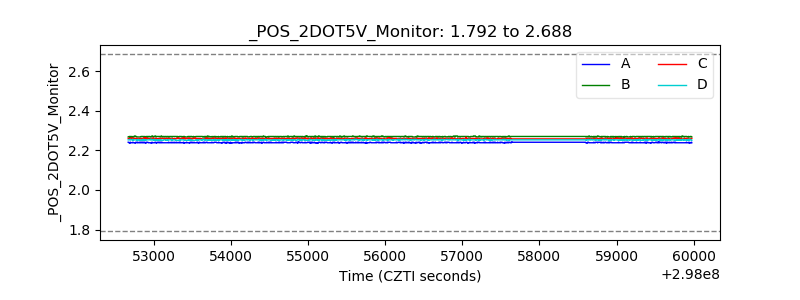 |
| +5 Volts monitor |  |
| _ROLL_ROT | 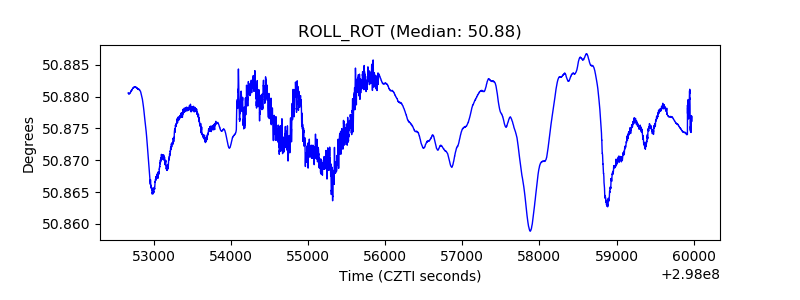 |
| _Roll_DEC | 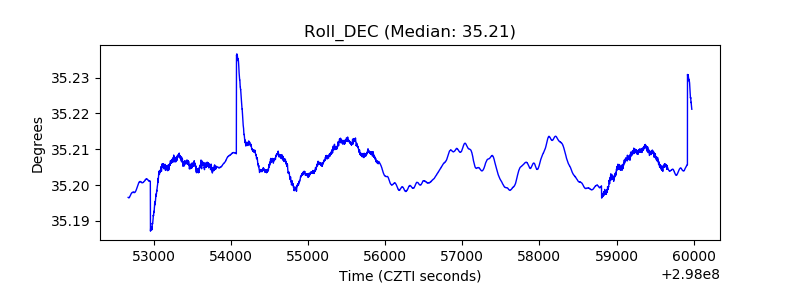 |
| _Roll_RA | 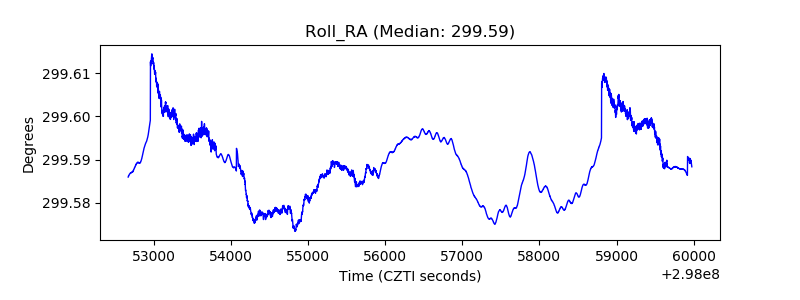 |
| Veto Counter | 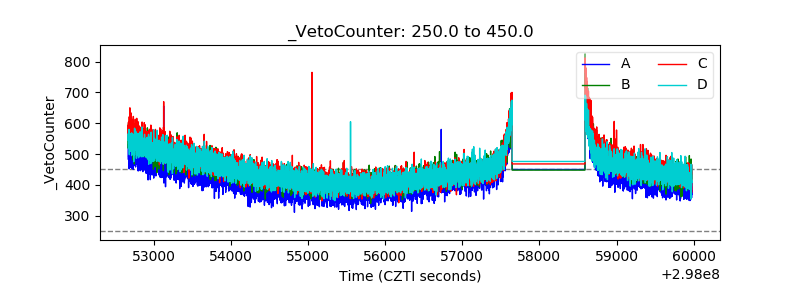 |