| Param | Original file | Final file |
|---|---|---|
| Filename | modeM0/AS1A05_180T01_9000002986_20036cztM0_level2.evt | modeM0/AS1A05_180T01_9000002986_20036cztM0_level2_quad_clean.evt |
| Size (bytes) | 578,615,040 | 117,296,640 |
| Size | 551.8 MB | 111.9 MB |
| Events in quadrant A | 3,724,588 | 797,595 |
| Events in quadrant B | 3,730,662 | 791,899 |
| Events in quadrant C | 3,655,920 | 762,828 |
| Events in quadrant D | 5,924,427 | 699,422 |
| Mode SS | |||
|---|---|---|---|
| Quadrant | BADHDUFLAG | Total packets | Discarded packets |
| A | 0 | 148 | 0 |
| B | 0 | 148 | 0 |
| C | 0 | 148 | 0 |
| D | 0 | 148 | 0 |
| Mode M9 | |||
|---|---|---|---|
| Quadrant | BADHDUFLAG | Total packets | Discarded packets |
| A | 0 | 15 | 0 |
| B | 0 | 15 | 0 |
| C | 0 | 15 | 0 |
| D | 0 | 15 | 0 |
| Mode M0 | |||
|---|---|---|---|
| Quadrant | BADHDUFLAG | Total packets | Discarded packets |
| A | 0 | 15385 | 3 |
| B | 0 | 15374 | 3 |
| C | 0 | 15049 | 3 |
| D | 0 | 22447 | 3 |
| Quadrant | Total seconds | Saturated seconds | Saturation percentage |
|---|---|---|---|
| A | 7188 | 83 | 1.154702% |
| B | 7189 | 122 | 1.697037% |
| C | 7189 | 123 | 1.710947% |
| D | 7189 | 909 | 12.644318% |
Noise dominated data is calculated using 1-second bins in cleaned event files. If a bin has >2000 counts, and if more than 50% of those come from <1% of pixels, then it is considered to be noise-dominated and hence unusable.
| Quadrant | # 1 sec bins | Bins with >0 counts | Bins with >2000 counts | High rate bins dominated by noise | Noise dominated (total time) | Noise dominated (detector-on time) | Marked lightcurve |
|---|---|---|---|---|---|---|---|
| A | 8683 | 7191 | 17 | 17 | 0.20% | 0.24% | 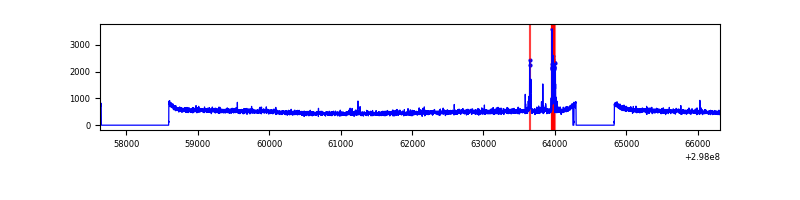 |
| B | 8684 | 7192 | 3 | 3 | 0.03% | 0.04% | 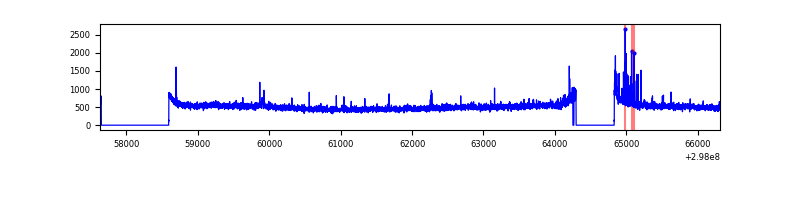 |
| C | 8684 | 7192 | 2 | 2 | 0.02% | 0.03% | 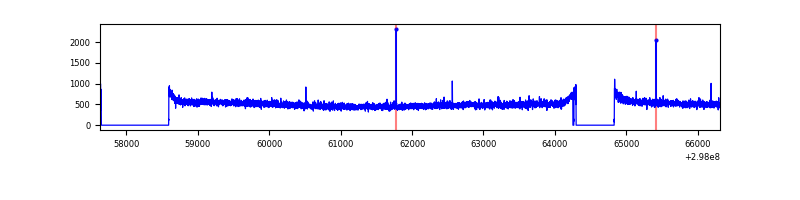 |
| D | 8684 | 7192 | 579 | 579 | 6.67% | 8.05% | 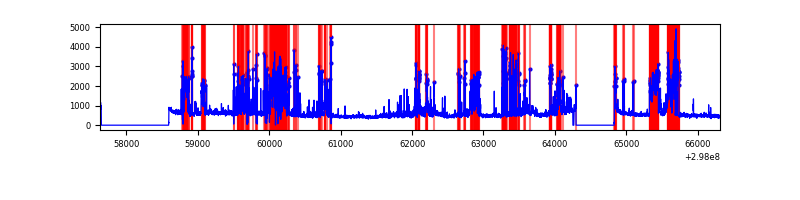 |
Top three noisy pixels from each quadrant. If the there are fewer than three noisy pixels in the level2.evt file, extra rows are filled as -1
| Pixel properties | Quadrant properties | ||||||
|---|---|---|---|---|---|---|---|
| Quadrant | DetID | PixID | Counts | Sigma | Mean | Median | Sigma |
| A | 14 | 238 | 80500 | 419.55 | 932 | 916 | 189.7 |
| A | 11 | 29 | 26910 | 137.04 | 932 | 916 | 189.7 |
| A | 14 | 254 | 23461 | 118.85 | 932 | 916 | 189.7 |
| B | 0 | 197 | 56600 | 310.0 | 926 | 904 | 179.7 |
| B | 12 | 111 | 20529 | 109.23 | 926 | 904 | 179.7 |
| B | 11 | 111 | 17849 | 94.31 | 926 | 904 | 179.7 |
| C | 14 | 238 | 140373 | 661.49 | 896 | 904 | 210.8 |
| C | 3 | 9 | 9401 | 40.3 | 896 | 904 | 210.8 |
| C | 10 | 91 | 6427 | 26.19 | 896 | 904 | 210.8 |
| D | 1 | 52 | 2034879 | 9800.0 | 853 | 831 | 207.6 |
| D | 13 | 249 | 527115 | 2535.62 | 853 | 831 | 207.6 |
| D | 8 | 195 | 139434 | 667.79 | 853 | 831 | 207.6 |
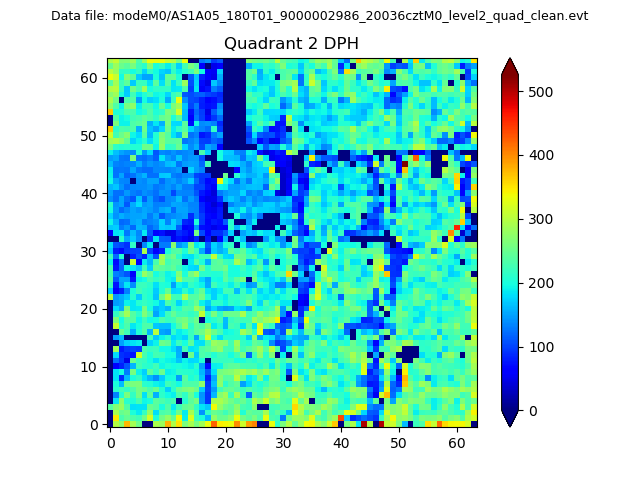
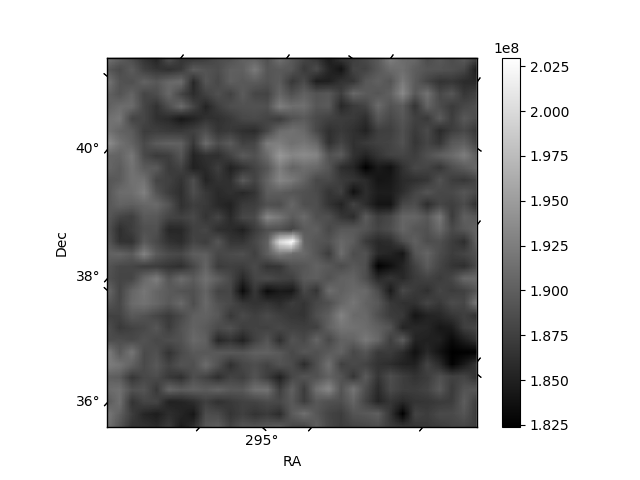
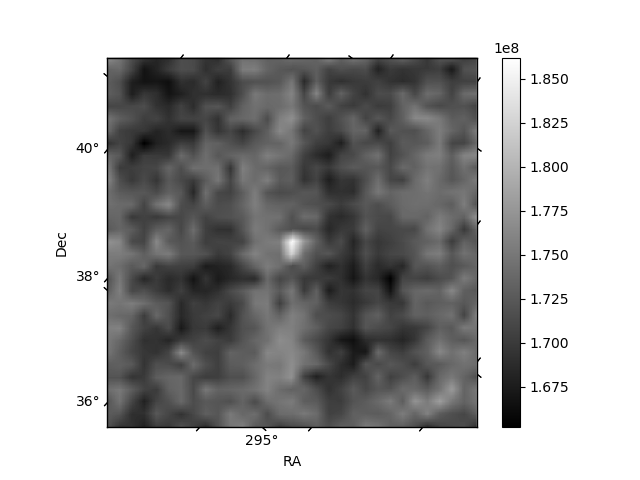
Histogram calculated using DETX and DETY for each event in the final _common_clean file
| Quadrant A | 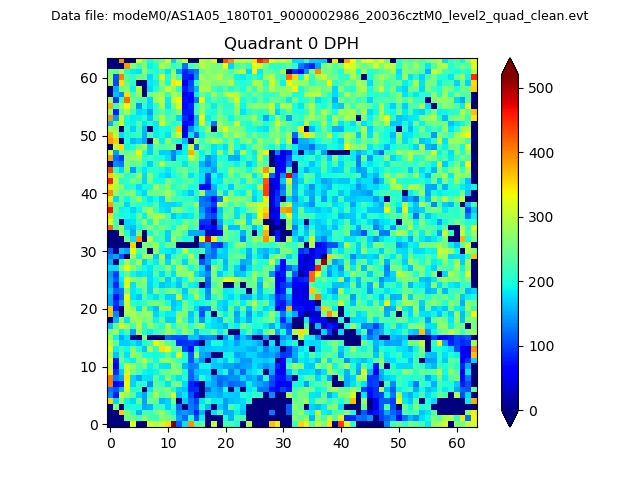 |
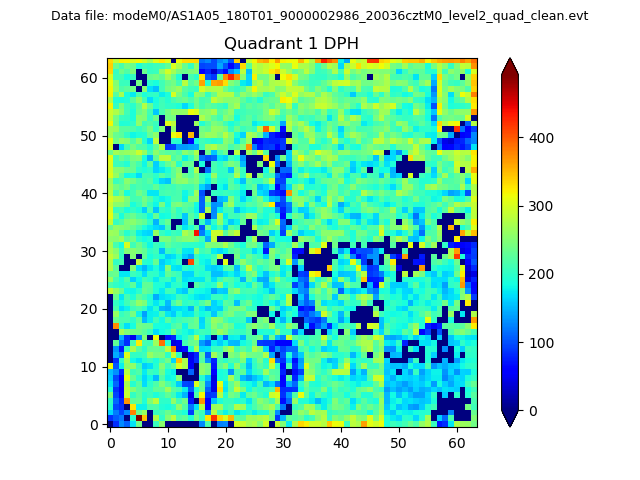 |
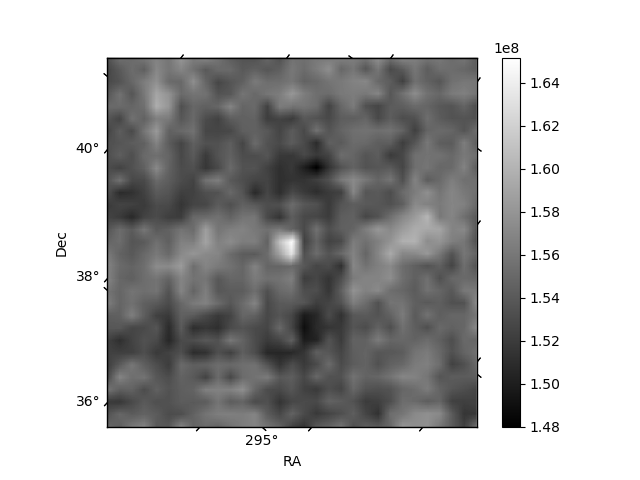
Quadrant B |
|---|---|---|---|
| Quadrant D | 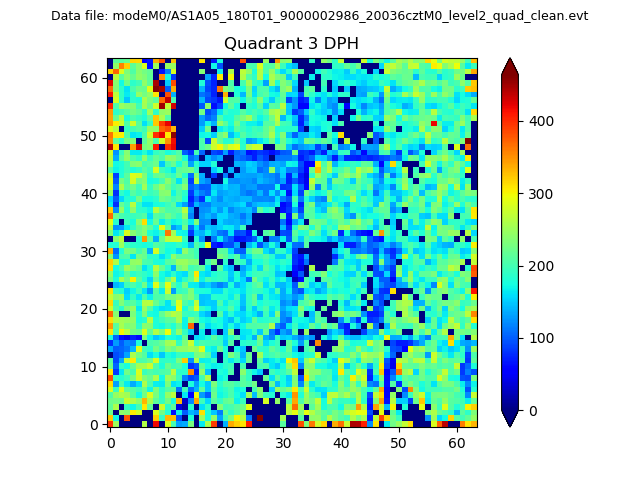 |
 |
Quadrant C |
| Plot type | Count rate plots | Images |
|---|---|---|
| Comparison with Poisson distribution Blue bars denote a histogram of data divided into 1 sec bins. Red curve is a Poisson curve with rate = median count rate of data. |
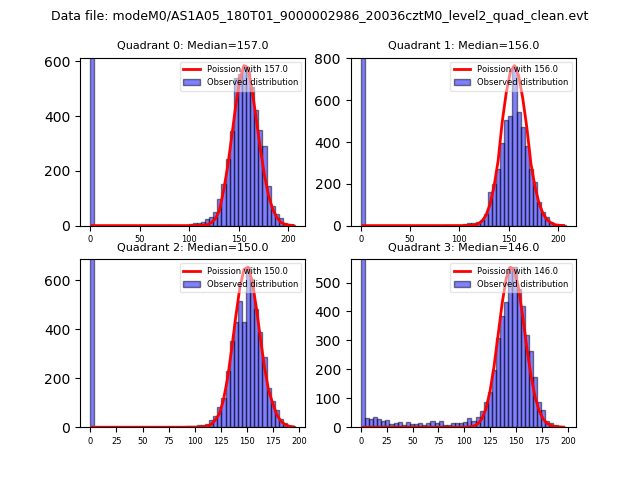 |
 |
| Quadrant-wise count rates Data is divided into 100 sec bins |
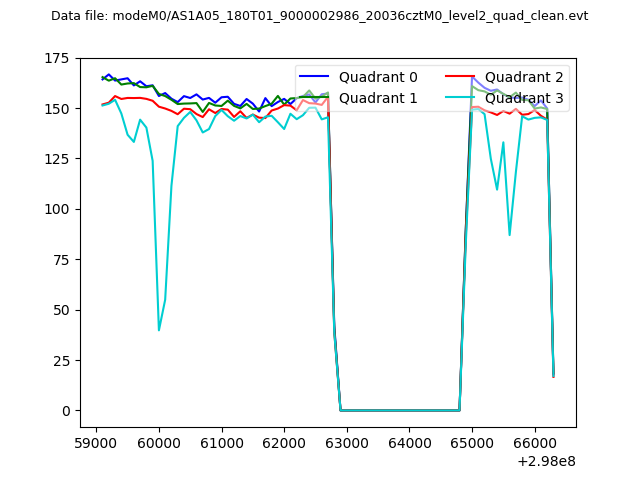 |
|
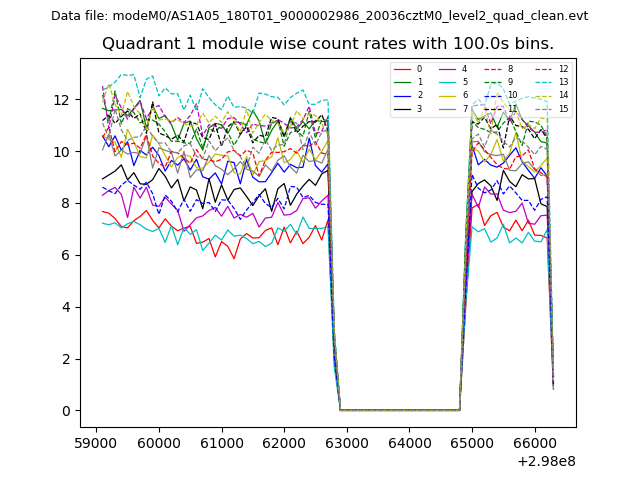
| Module-wise count rates for Quadrant A Data is divided into 100 sec bins |
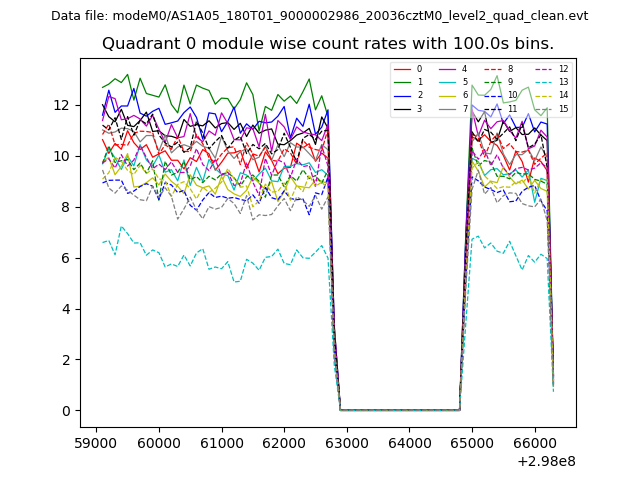 |
 |
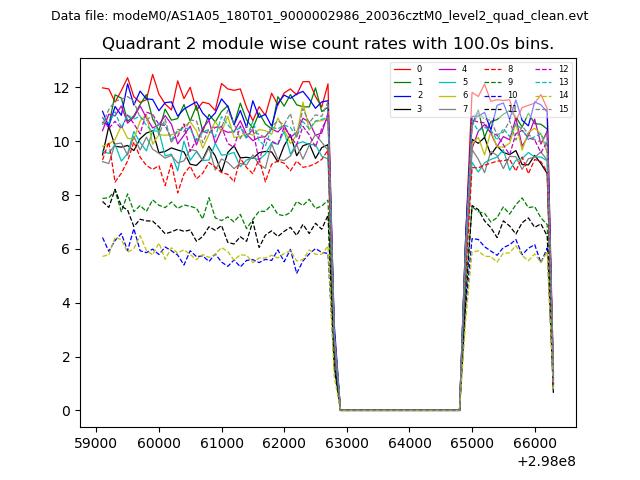
| Module-wise count rates for Quadrant B Data is divided into 100 sec bins |
 |
 |
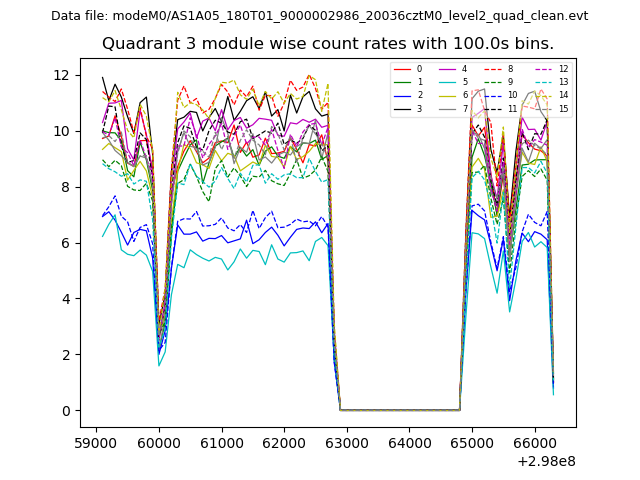
| Module-wise count rates for Quadrant C Data is divided into 100 sec bins |
 |
 |
| Module-wise count rates for Quadrant D Data is divided into 100 sec bins |
 |
 |
| Parameter | Plot |
|---|---|
| CZT HV Monitor | 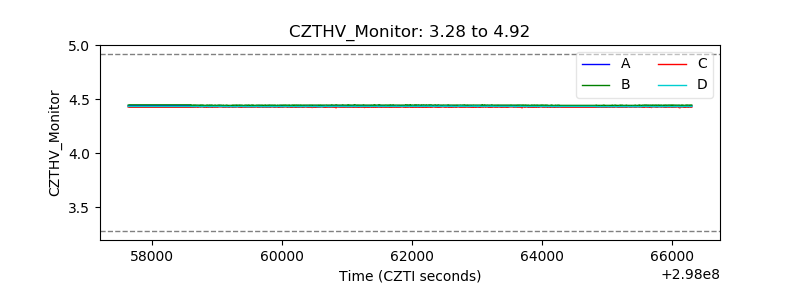 |
| D_VDD | 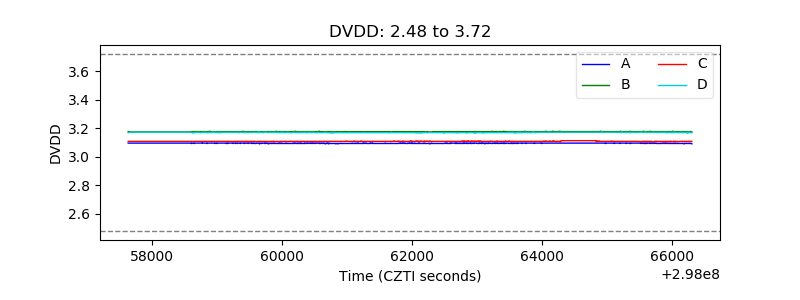 |
| Temperature 1 | 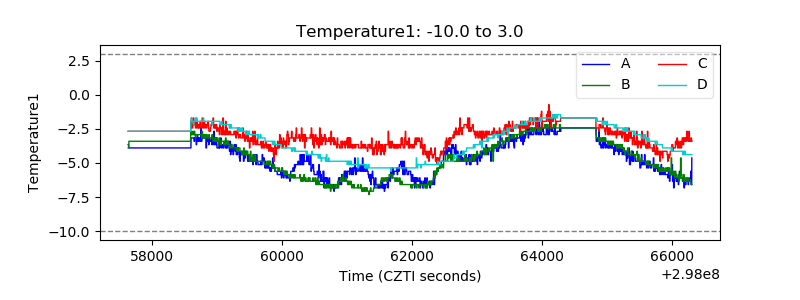 |
| Veto HV Monitor | 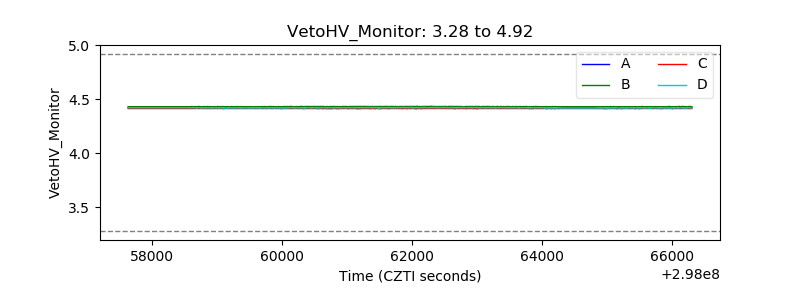 |
| Veto LLD | 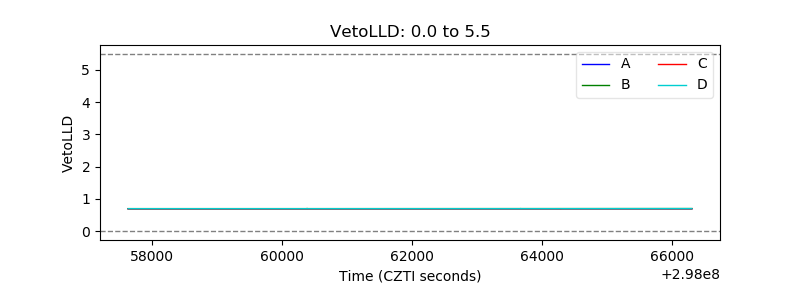 |
| Alpha Counter | 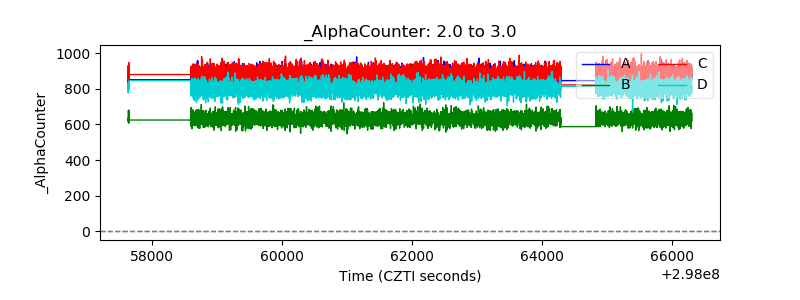 |
| _CPM_Rate | 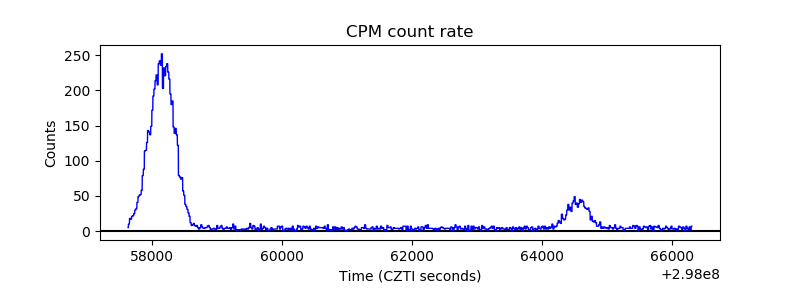 |
| CZT Counter |  |
| +2.5 Volts monitor |  |
| +5 Volts monitor |  |
| _ROLL_ROT | 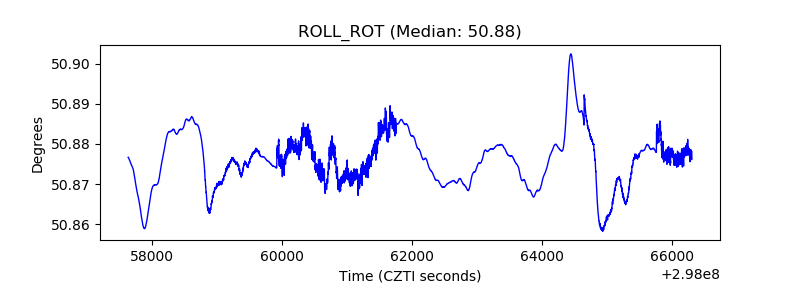 |
| _Roll_DEC | 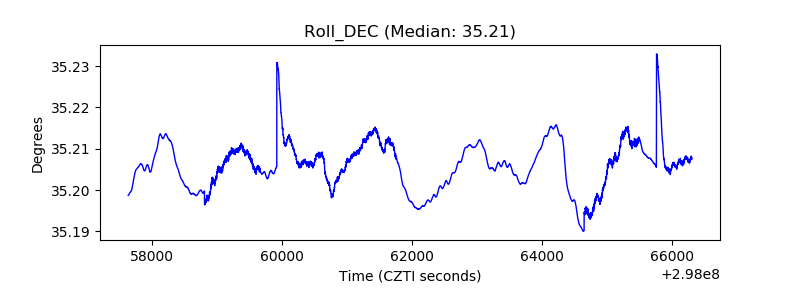 |
| _Roll_RA |  |
| Veto Counter | 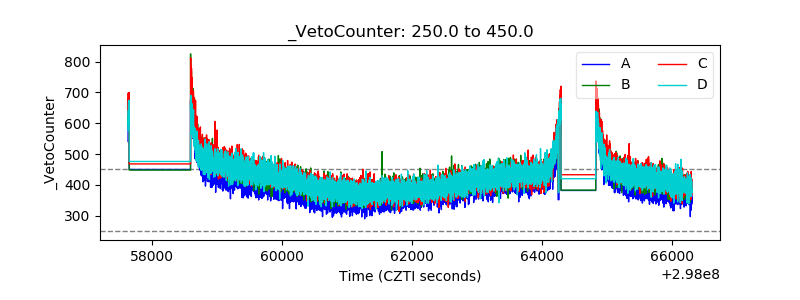 |