| Param | Original file | Final file |
|---|---|---|
| Filename | modeM0/AS1A05_180T01_9000002986_20037cztM0_level2.evt | modeM0/AS1A05_180T01_9000002986_20037cztM0_level2_quad_clean.evt |
| Size (bytes) | 539,631,360 | 119,183,040 |
| Size | 514.6 MB | 113.7 MB |
| Events in quadrant A | 3,766,841 | 799,537 |
| Events in quadrant B | 3,865,785 | 792,831 |
| Events in quadrant C | 3,823,575 | 761,532 |
| Events in quadrant D | 4,377,015 | 733,606 |
| Mode SS | |||
|---|---|---|---|
| Quadrant | BADHDUFLAG | Total packets | Discarded packets |
| A | 0 | 156 | 0 |
| B | 0 | 156 | 0 |
| C | 0 | 156 | 0 |
| D | 0 | 156 | 0 |
| Mode M9 | |||
|---|---|---|---|
| Quadrant | BADHDUFLAG | Total packets | Discarded packets |
| A | 0 | 6 | 0 |
| B | 0 | 7 | 0 |
| C | 0 | 7 | 0 |
| D | 0 | 7 | 0 |
| Mode M0 | |||
|---|---|---|---|
| Quadrant | BADHDUFLAG | Total packets | Discarded packets |
| A | 0 | 15839 | 2 |
| B | 0 | 16146 | 2 |
| C | 0 | 15892 | 2 |
| D | 0 | 18002 | 2 |
| Quadrant | Total seconds | Saturated seconds | Saturation percentage |
|---|---|---|---|
| A | 7506 | 66 | 0.879297% |
| B | 7506 | 120 | 1.598721% |
| C | 7506 | 141 | 1.878497% |
| D | 7506 | 337 | 4.489742% |
Noise dominated data is calculated using 1-second bins in cleaned event files. If a bin has >2000 counts, and if more than 50% of those come from <1% of pixels, then it is considered to be noise-dominated and hence unusable.
| Quadrant | # 1 sec bins | Bins with >0 counts | Bins with >2000 counts | High rate bins dominated by noise | Noise dominated (total time) | Noise dominated (detector-on time) | Marked lightcurve |
|---|---|---|---|---|---|---|---|
| A | 7711 | 7508 | 0 | 0 | 0.00% | 0.00% | 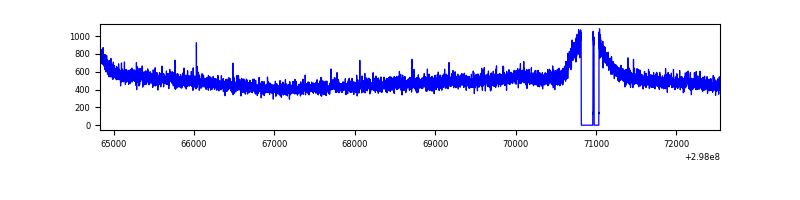 |
| B | 7711 | 7508 | 3 | 3 | 0.04% | 0.04% | 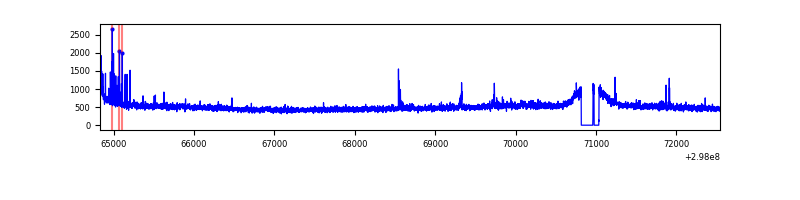 |
| C | 7711 | 7508 | 1 | 1 | 0.01% | 0.01% | 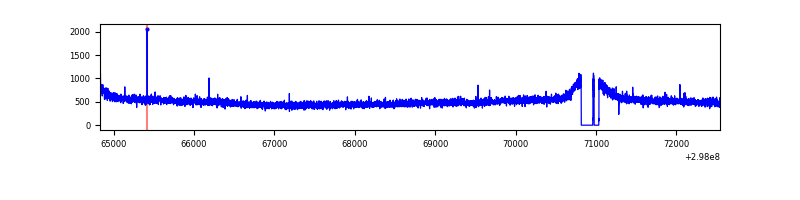 |
| D | 7711 | 7508 | 218 | 218 | 2.83% | 2.90% | 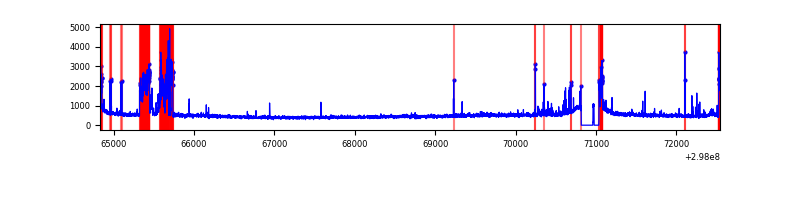 |
Top three noisy pixels from each quadrant. If the there are fewer than three noisy pixels in the level2.evt file, extra rows are filled as -1
| Pixel properties | Quadrant properties | ||||||
|---|---|---|---|---|---|---|---|
| Quadrant | DetID | PixID | Counts | Sigma | Mean | Median | Sigma |
| A | 11 | 29 | 24553 | 119.98 | 965 | 949 | 196.7 |
| A | 15 | 191 | 15835 | 75.66 | 965 | 949 | 196.7 |
| A | 3 | 1 | 8562 | 38.7 | 965 | 949 | 196.7 |
| B | 0 | 197 | 56884 | 302.69 | 957 | 935 | 184.8 |
| B | 12 | 111 | 21793 | 112.84 | 957 | 935 | 184.8 |
| B | 11 | 111 | 18986 | 97.66 | 957 | 935 | 184.8 |
| C | 14 | 238 | 144694 | 656.57 | 927 | 936 | 219.0 |
| C | 10 | 91 | 44244 | 197.79 | 927 | 936 | 219.0 |
| C | 13 | 61 | 6532 | 25.56 | 927 | 936 | 219.0 |
| D | 13 | 249 | 527148 | 2327.89 | 922 | 900 | 226.1 |
| D | 1 | 52 | 301825 | 1331.16 | 922 | 900 | 226.1 |
| D | 8 | 195 | 50264 | 218.36 | 922 | 900 | 226.1 |
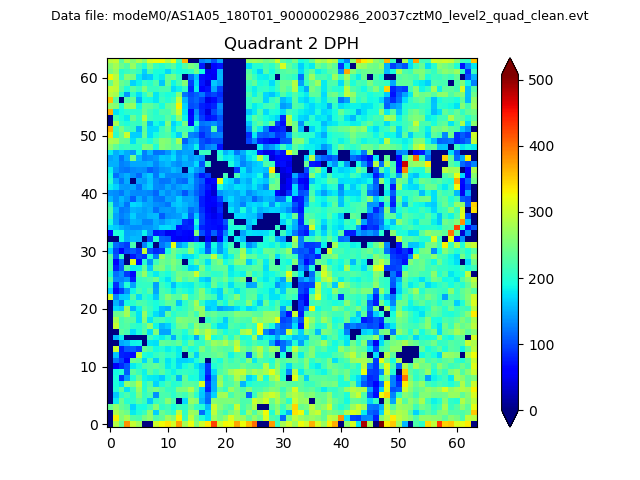
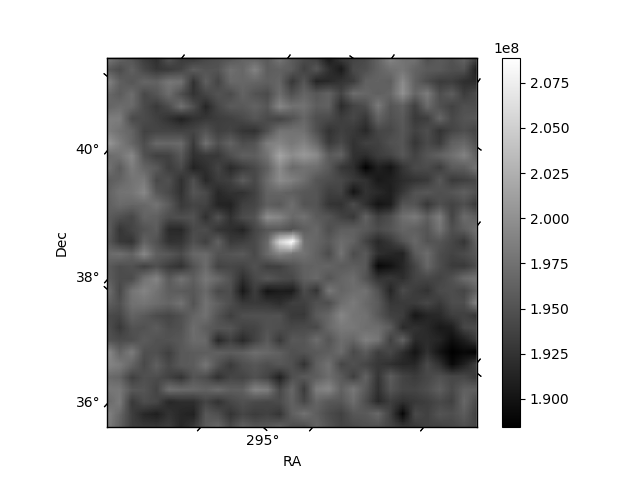
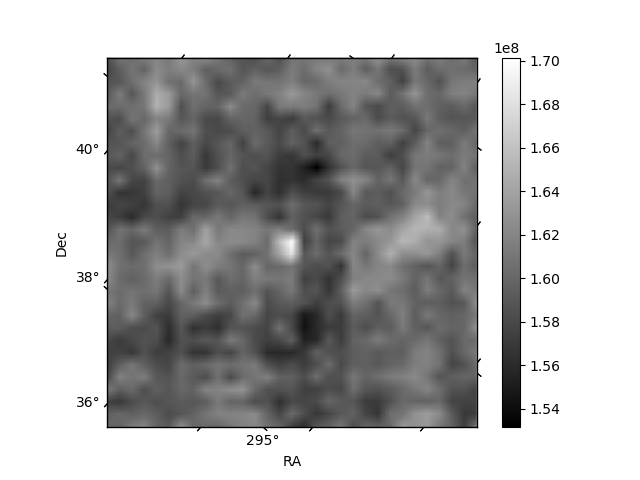
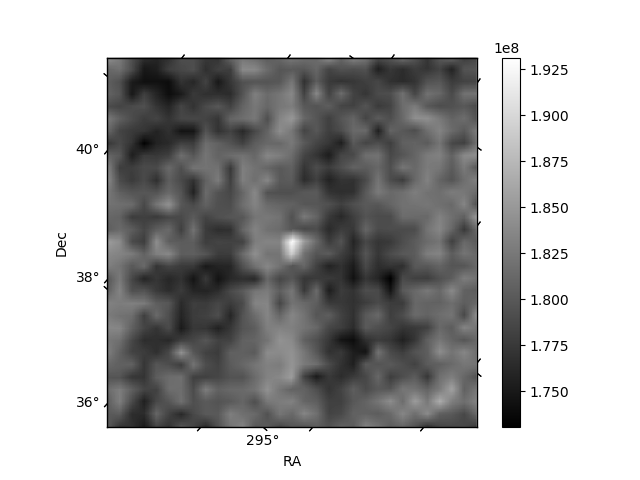
Histogram calculated using DETX and DETY for each event in the final _common_clean file
| Quadrant A |  |
 |
Quadrant B |
|---|---|---|---|
| Quadrant D | 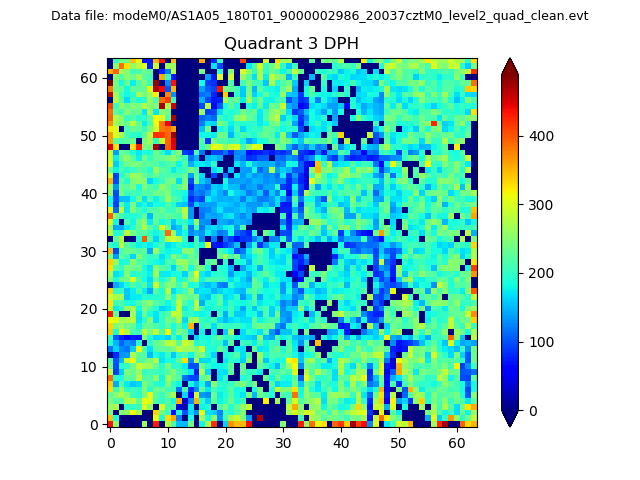 |
 |
Quadrant C |
| Plot type | Count rate plots | Images |
|---|---|---|
| Comparison with Poisson distribution Blue bars denote a histogram of data divided into 1 sec bins. Red curve is a Poisson curve with rate = median count rate of data. |
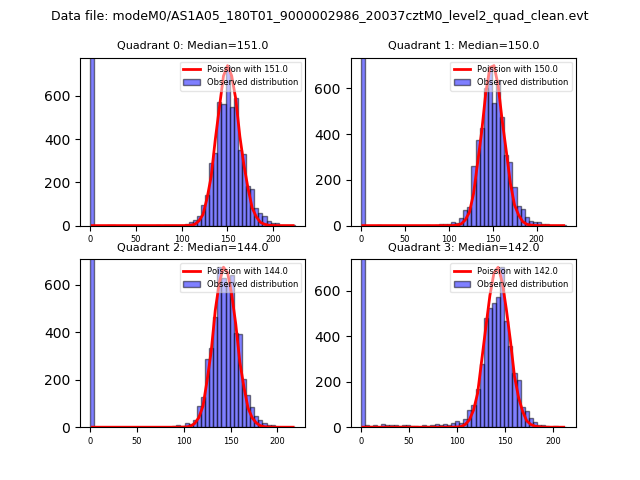 |
 |
| Quadrant-wise count rates Data is divided into 100 sec bins |
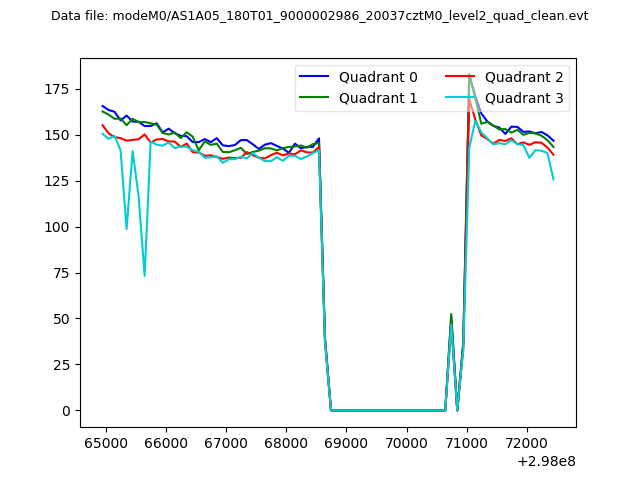 |
|
| Module-wise count rates for Quadrant A Data is divided into 100 sec bins |
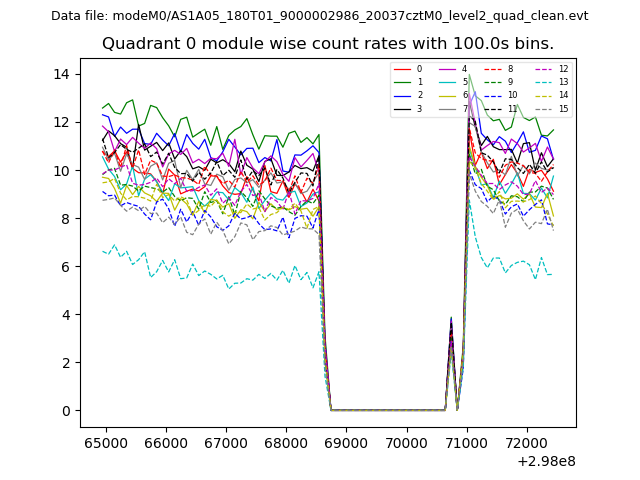 |
 |
| Module-wise count rates for Quadrant B Data is divided into 100 sec bins |
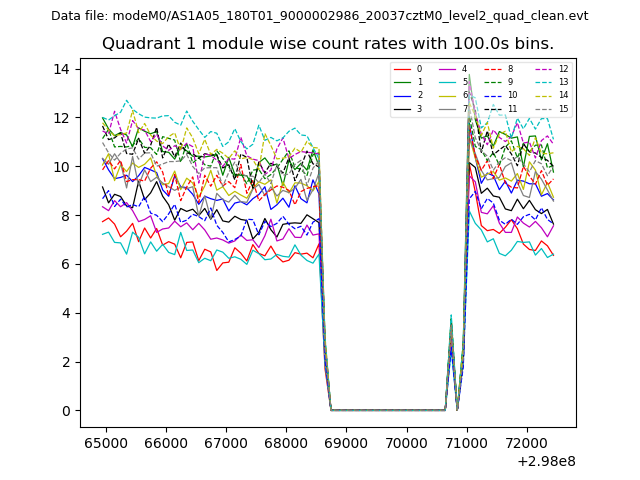 |
 |
| Module-wise count rates for Quadrant C Data is divided into 100 sec bins |
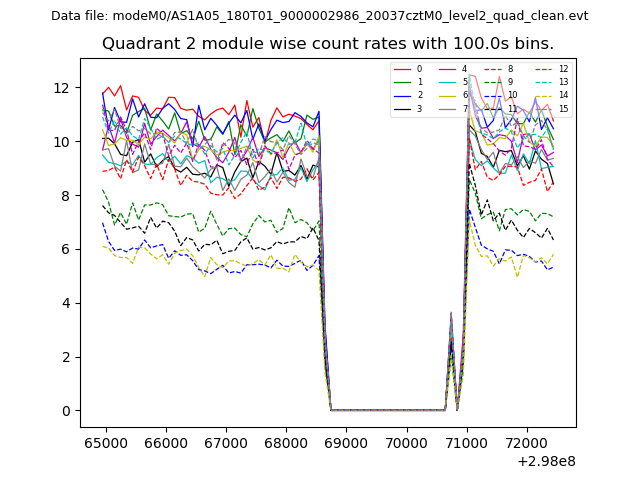 |
 |
| Module-wise count rates for Quadrant D Data is divided into 100 sec bins |
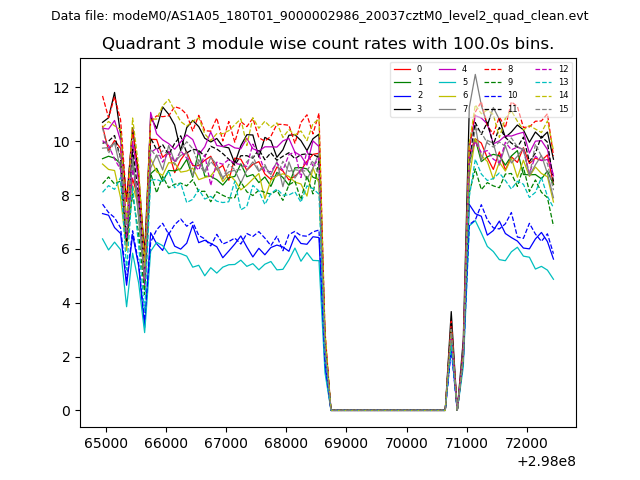 |
 |
| Parameter | Plot |
|---|---|
| CZT HV Monitor | 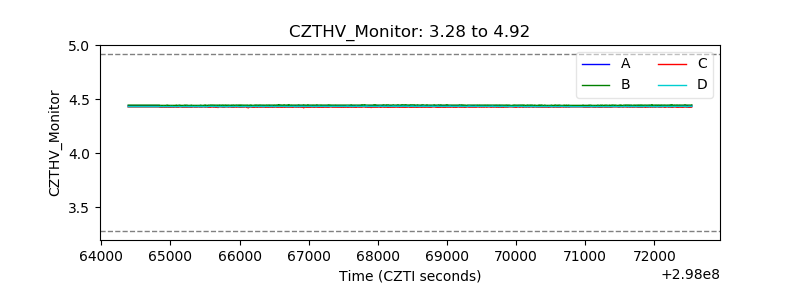 |
| D_VDD | 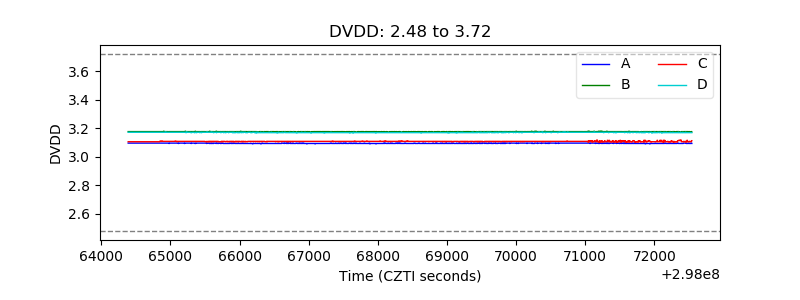 |
| Temperature 1 | 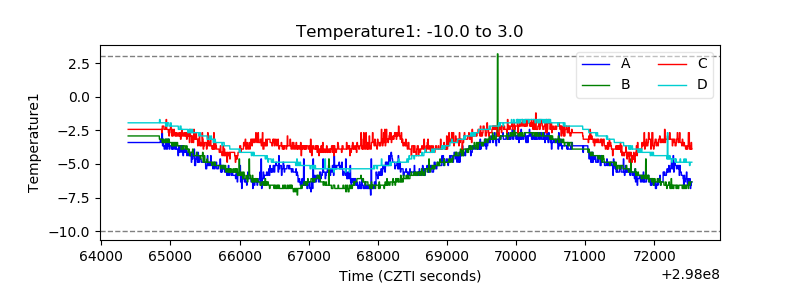 |
| Veto HV Monitor | 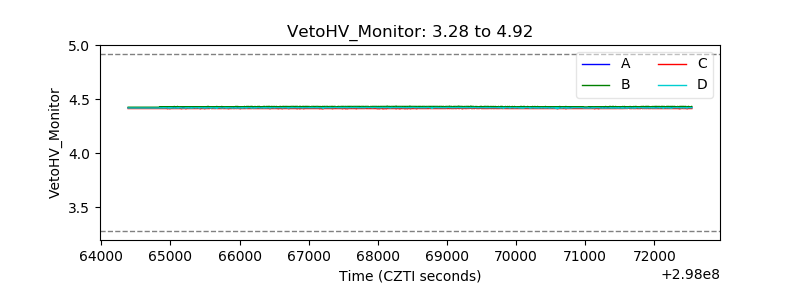 |
| Veto LLD | 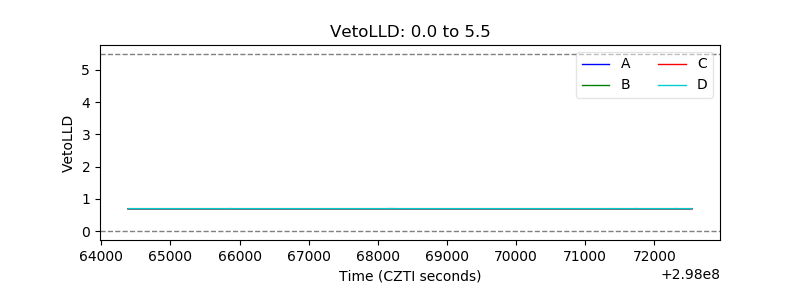 |
| Alpha Counter | 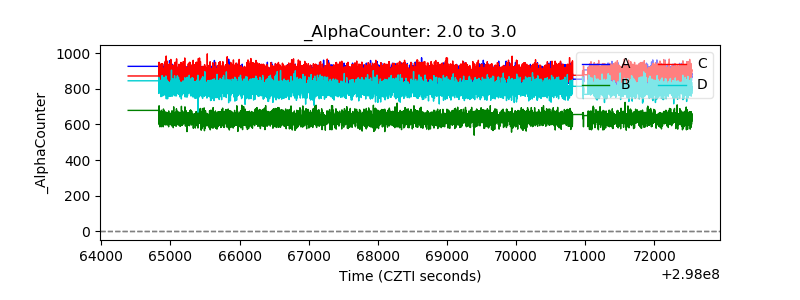 |
| _CPM_Rate |  |
| CZT Counter | 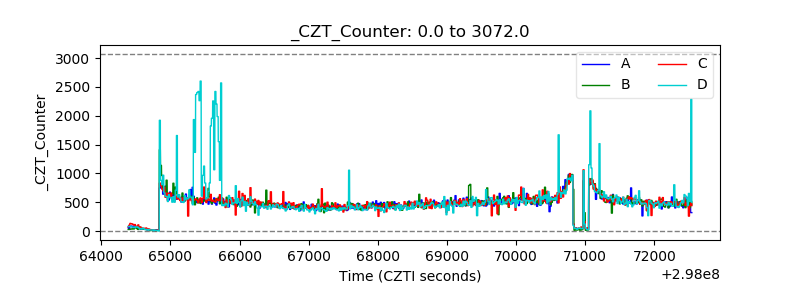 |
| +2.5 Volts monitor | 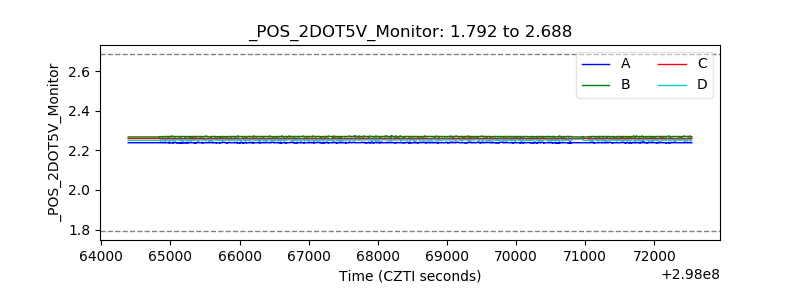 |
| +5 Volts monitor | 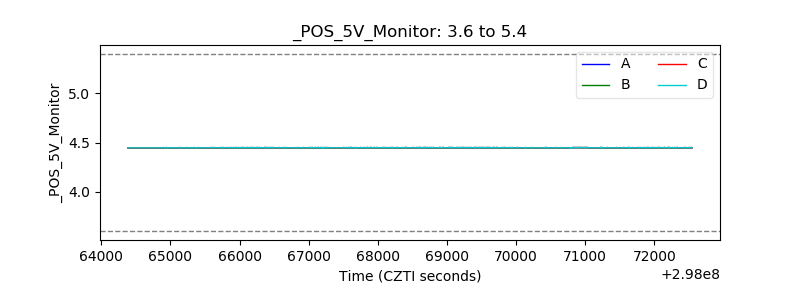 |
| _ROLL_ROT | 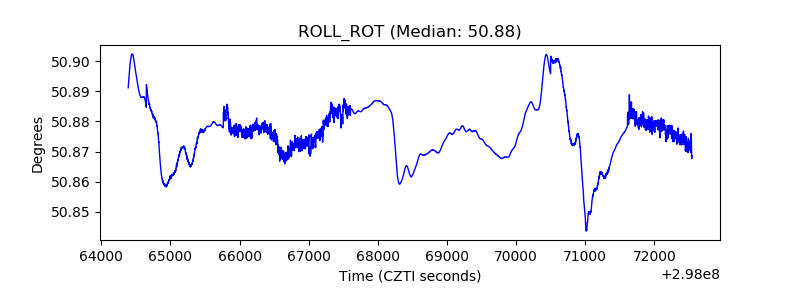 |
| _Roll_DEC | 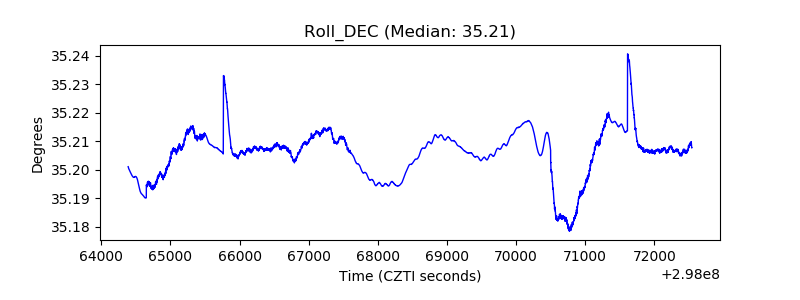 |
| _Roll_RA | 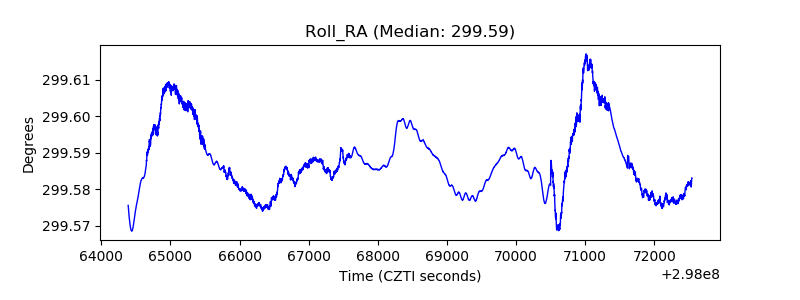 |
| Veto Counter | 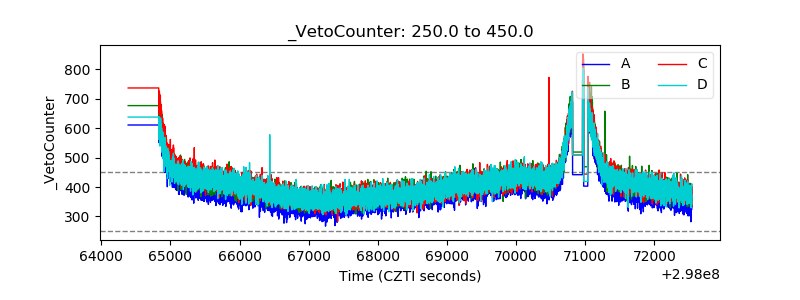 |