| Param | Original file | Final file |
|---|---|---|
| Filename | modeM0/AS1A05_180T01_9000002986_20038cztM0_level2.evt | modeM0/AS1A05_180T01_9000002986_20038cztM0_level2_quad_clean.evt |
| Size (bytes) | 553,754,880 | 126,172,800 |
| Size | 528.1 MB | 120.3 MB |
| Events in quadrant A | 3,927,364 | 844,615 |
| Events in quadrant B | 3,955,101 | 839,414 |
| Events in quadrant C | 3,873,217 | 807,811 |
| Events in quadrant D | 4,492,287 | 793,926 |
| Mode SS | |||
|---|---|---|---|
| Quadrant | BADHDUFLAG | Total packets | Discarded packets |
| A | 0 | 156 | 0 |
| B | 0 | 156 | 0 |
| C | 0 | 156 | 0 |
| D | 0 | 156 | 0 |
| Mode M9 | |||
|---|---|---|---|
| Quadrant | BADHDUFLAG | Total packets | Discarded packets |
| A | 0 | 2 | 0 |
| B | 0 | 2 | 0 |
| C | 0 | 2 | 0 |
| D | 0 | 2 | 0 |
| Mode M0 | |||
|---|---|---|---|
| Quadrant | BADHDUFLAG | Total packets | Discarded packets |
| A | 0 | 16554 | 2 |
| B | 0 | 16631 | 2 |
| C | 0 | 16288 | 2 |
| D | 0 | 18612 | 2 |
| Quadrant | Total seconds | Saturated seconds | Saturation percentage |
|---|---|---|---|
| A | 7698 | 114 | 1.480904% |
| B | 7699 | 150 | 1.948305% |
| C | 7699 | 192 | 2.493830% |
| D | 7699 | 255 | 3.312118% |
Noise dominated data is calculated using 1-second bins in cleaned event files. If a bin has >2000 counts, and if more than 50% of those come from <1% of pixels, then it is considered to be noise-dominated and hence unusable.
| Quadrant | # 1 sec bins | Bins with >0 counts | Bins with >2000 counts | High rate bins dominated by noise | Noise dominated (total time) | Noise dominated (detector-on time) | Marked lightcurve |
|---|---|---|---|---|---|---|---|
| A | 7933 | 7699 | 12 | 12 | 0.15% | 0.16% | 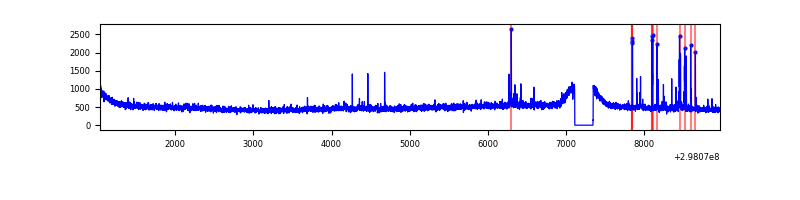 |
| B | 7934 | 7700 | 3 | 3 | 0.04% | 0.04% | 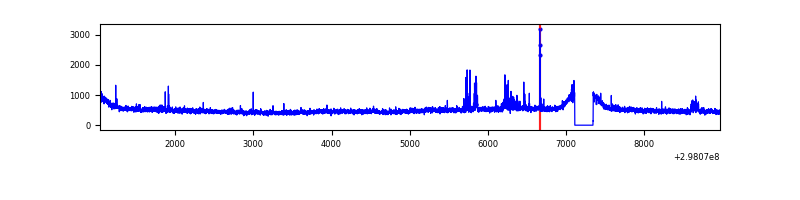 |
| C | 7934 | 7700 | 0 | 0 | 0.00% | 0.00% | 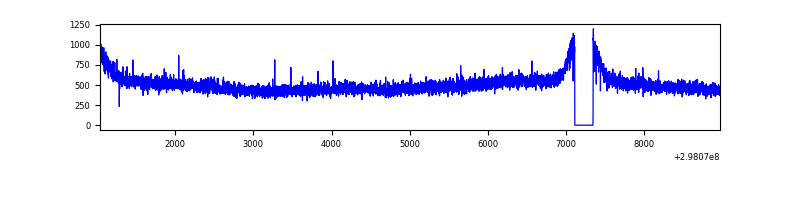 |
| D | 7934 | 7700 | 142 | 142 | 1.79% | 1.84% | 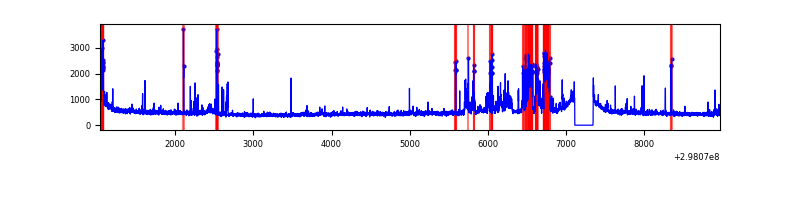 |
Top three noisy pixels from each quadrant. If the there are fewer than three noisy pixels in the level2.evt file, extra rows are filled as -1
| Pixel properties | Quadrant properties | ||||||
|---|---|---|---|---|---|---|---|
| Quadrant | DetID | PixID | Counts | Sigma | Mean | Median | Sigma |
| A | 14 | 238 | 90566 | 446.02 | 984 | 967 | 200.9 |
| A | 14 | 254 | 26350 | 126.36 | 984 | 967 | 200.9 |
| A | 10 | 253 | 13820 | 63.98 | 984 | 967 | 200.9 |
| B | 7 | 220 | 48326 | 251.9 | 976 | 955 | 188.1 |
| B | 4 | 80 | 29049 | 149.39 | 976 | 955 | 188.1 |
| B | 12 | 111 | 22368 | 113.87 | 976 | 955 | 188.1 |
| C | 14 | 238 | 147408 | 652.81 | 947 | 958 | 224.3 |
| C | 8 | 128 | 14515 | 60.43 | 947 | 958 | 224.3 |
| C | 3 | 233 | 8128 | 31.96 | 947 | 958 | 224.3 |
| D | 1 | 52 | 845901 | 3583.2 | 950 | 925 | 235.8 |
| D | 2 | 234 | 32124 | 132.3 | 950 | 925 | 235.8 |
| D | 8 | 195 | 29543 | 121.36 | 950 | 925 | 235.8 |
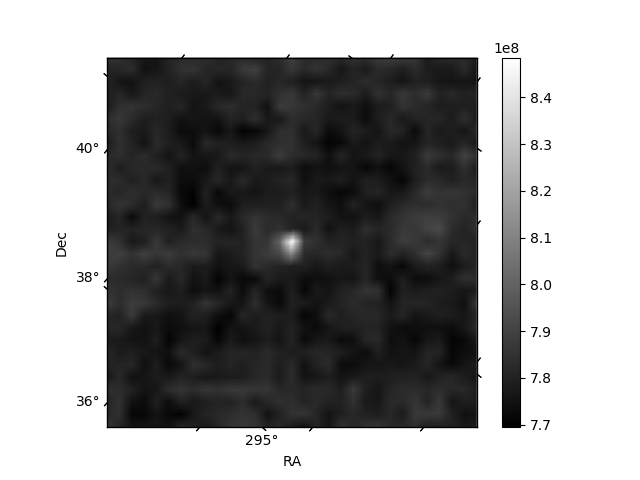
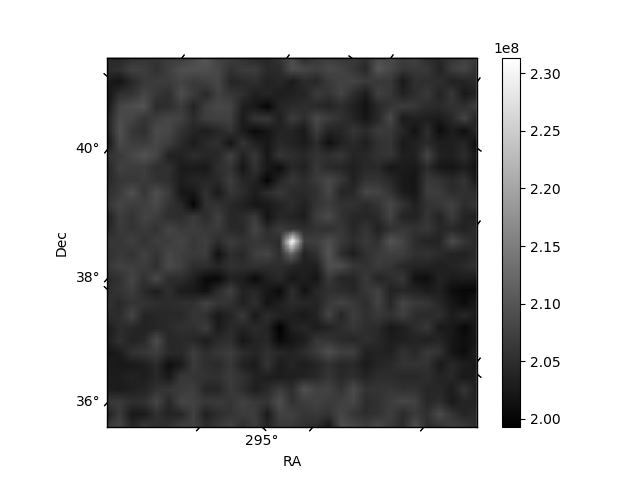
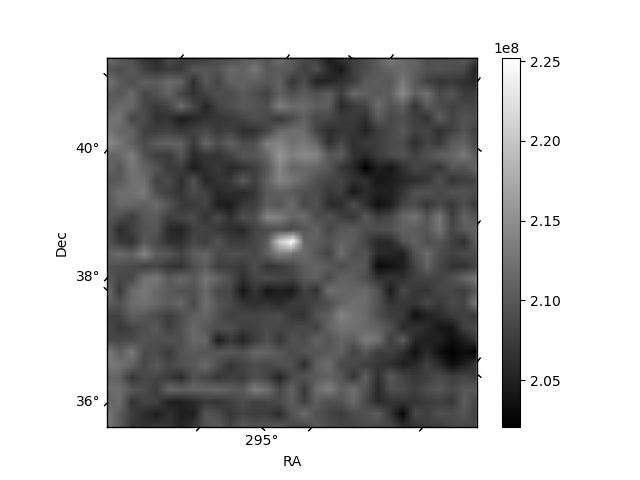
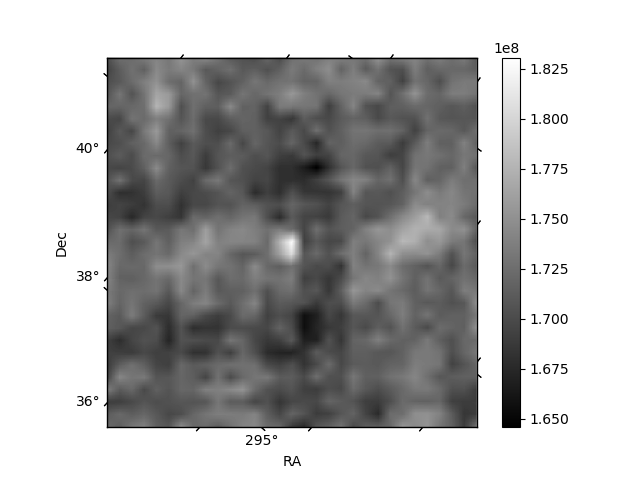
Histogram calculated using DETX and DETY for each event in the final _common_clean file
| Quadrant A | 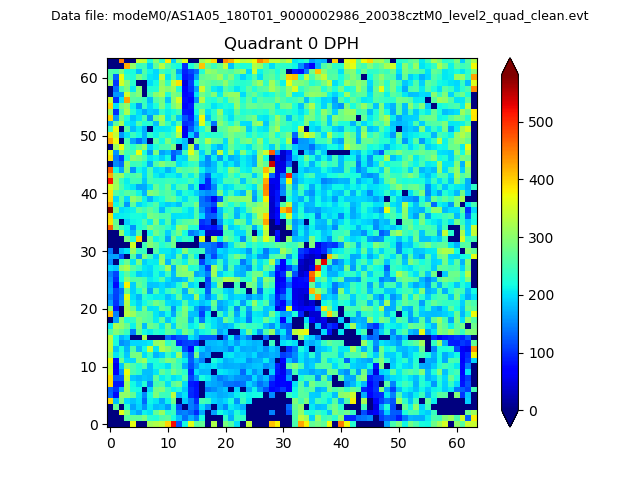 |
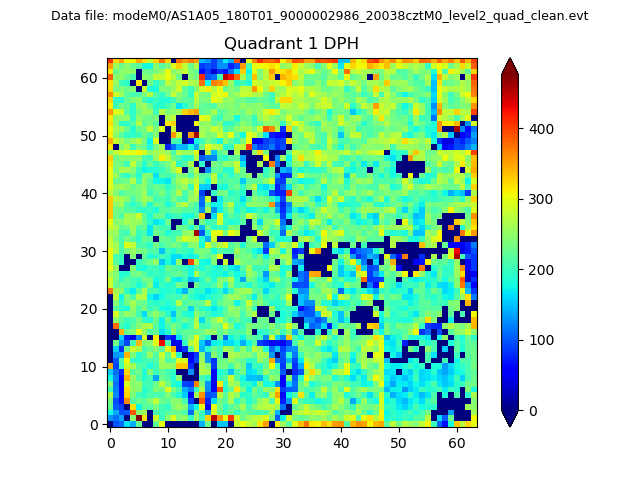 |
Quadrant B |
|---|---|---|---|
| Quadrant D | 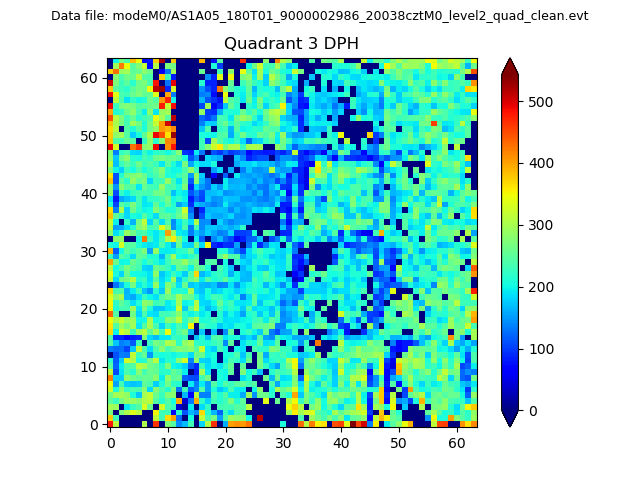 |
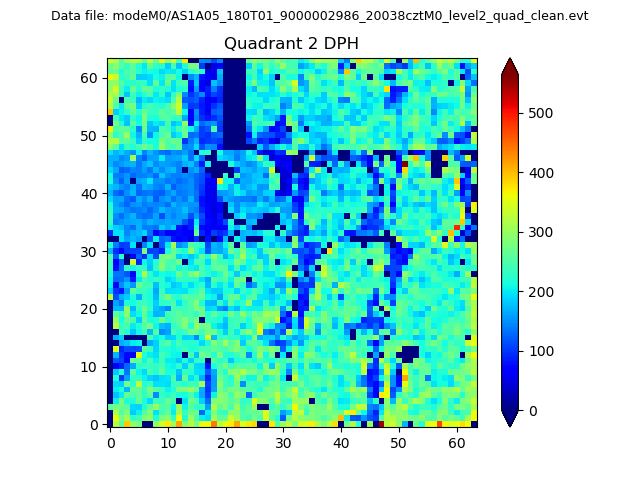 |
Quadrant C |
| Plot type | Count rate plots | Images |
|---|---|---|
| Comparison with Poisson distribution Blue bars denote a histogram of data divided into 1 sec bins. Red curve is a Poisson curve with rate = median count rate of data. |
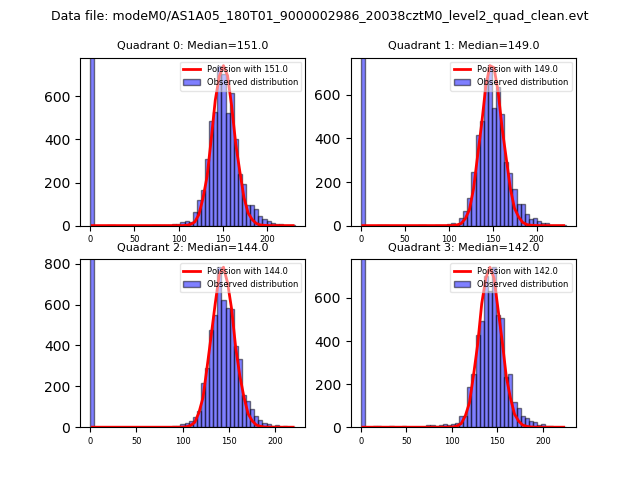 |
 |
| Quadrant-wise count rates Data is divided into 100 sec bins |
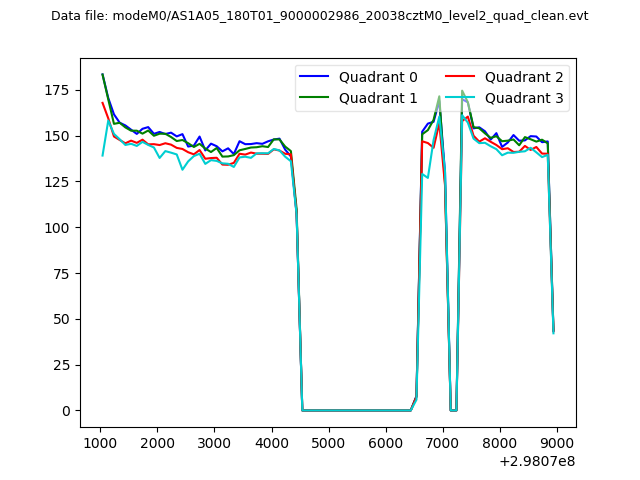 |
|
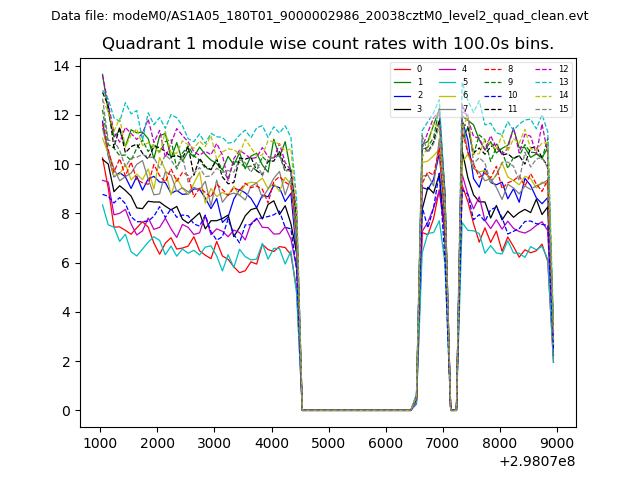
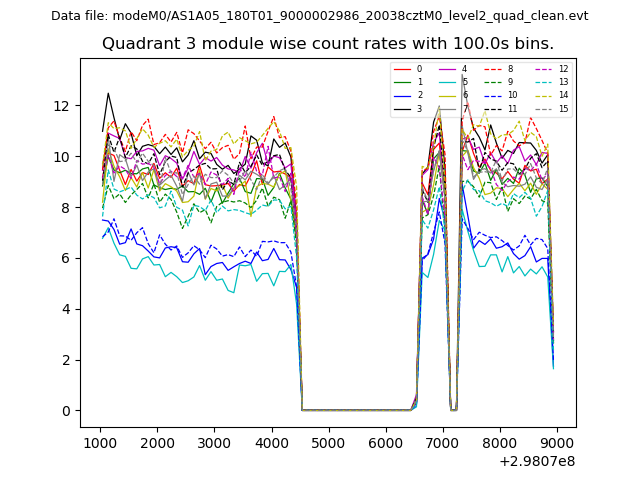
| Module-wise count rates for Quadrant A Data is divided into 100 sec bins |
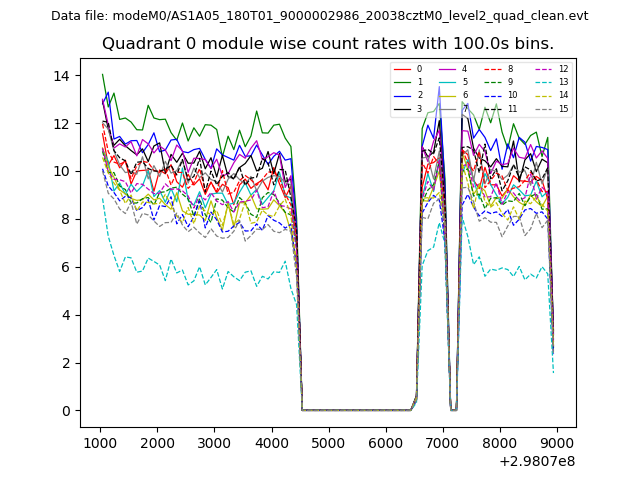 |
 |
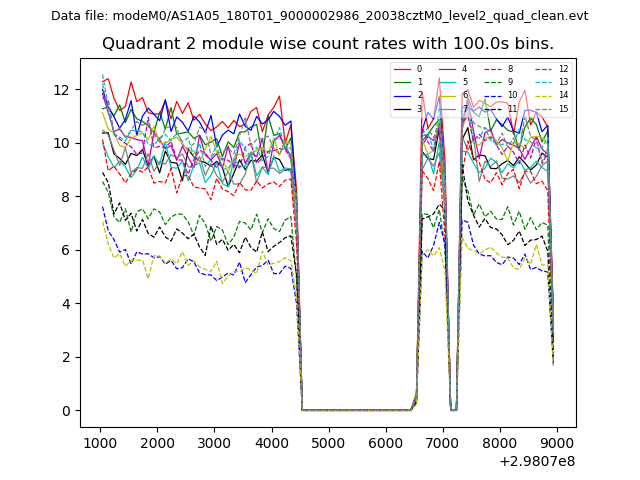
| Module-wise count rates for Quadrant B Data is divided into 100 sec bins |
 |
 |
| Module-wise count rates for Quadrant C Data is divided into 100 sec bins |
 |
 |
| Module-wise count rates for Quadrant D Data is divided into 100 sec bins |
 |
 |
| Parameter | Plot |
|---|---|
| CZT HV Monitor | 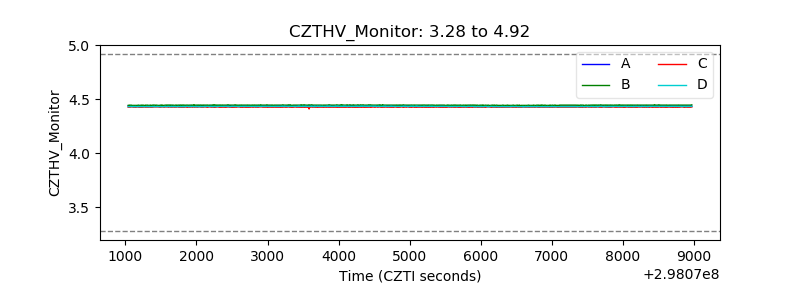 |
| D_VDD | 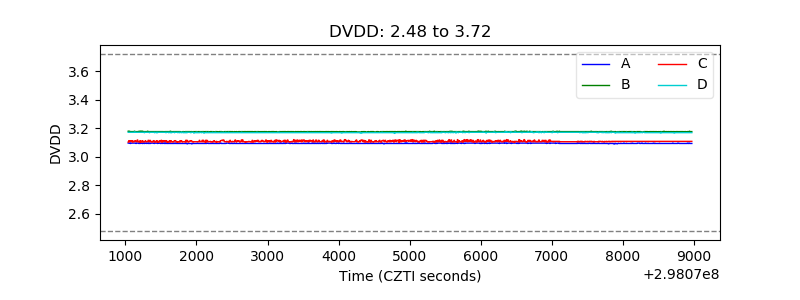 |
| Temperature 1 | 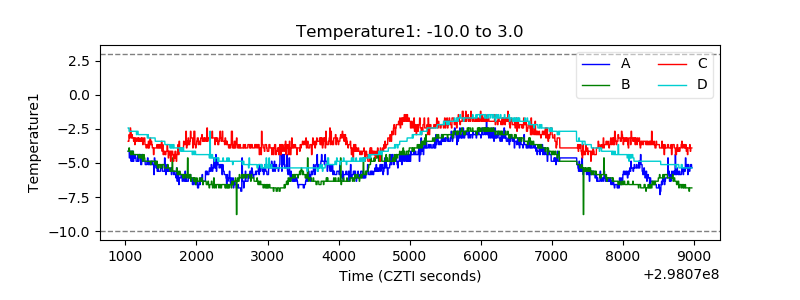 |
| Veto HV Monitor | 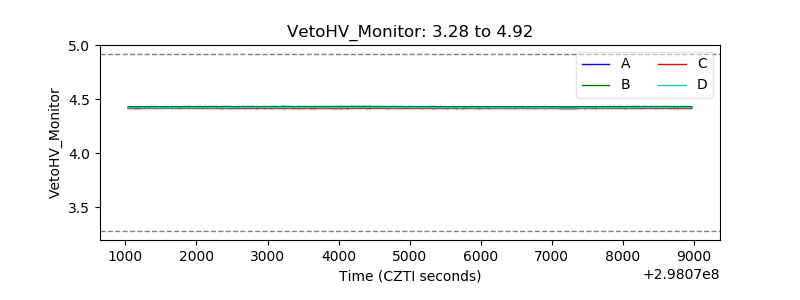 |
| Veto LLD | 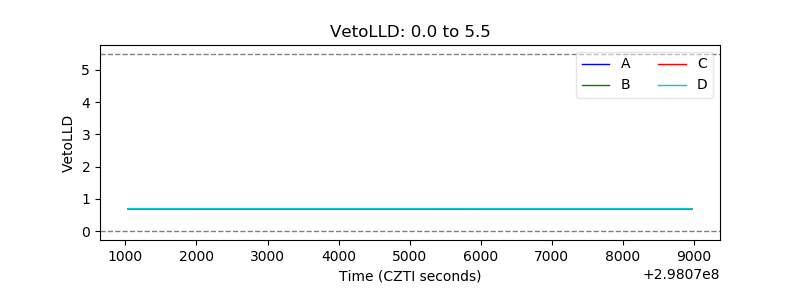 |
| Alpha Counter | 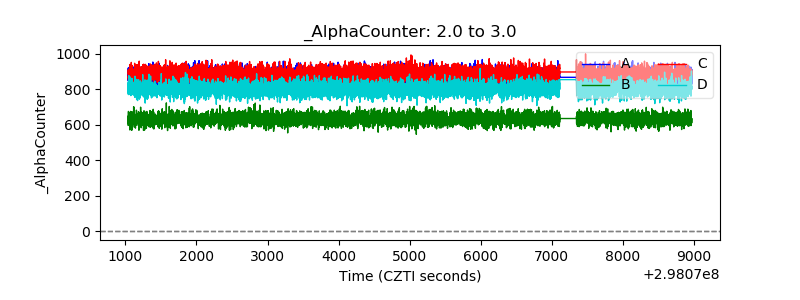 |
| _CPM_Rate | 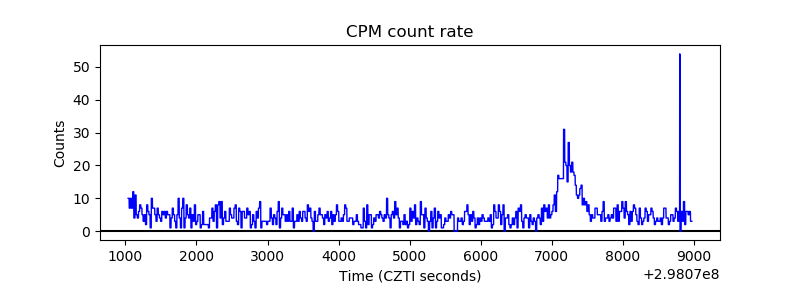 |
| CZT Counter | 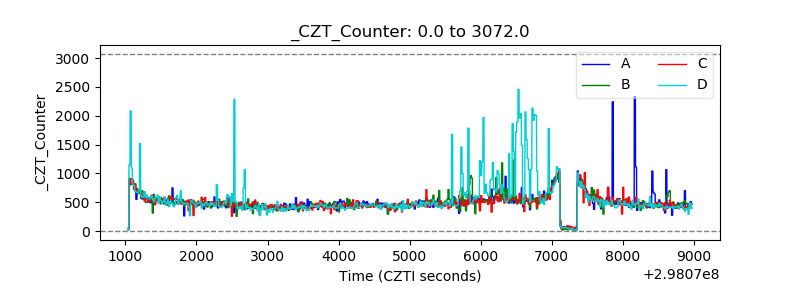 |
| +2.5 Volts monitor | 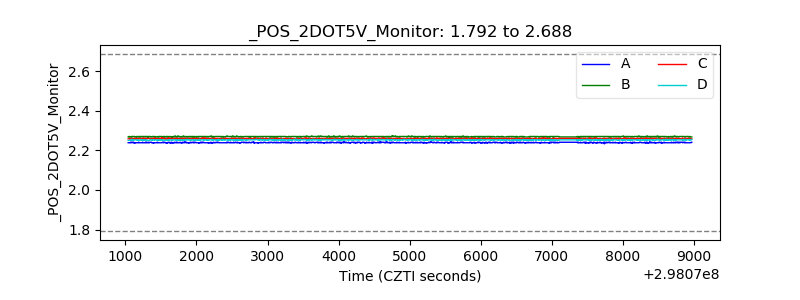 |
| +5 Volts monitor |  |
| _ROLL_ROT | 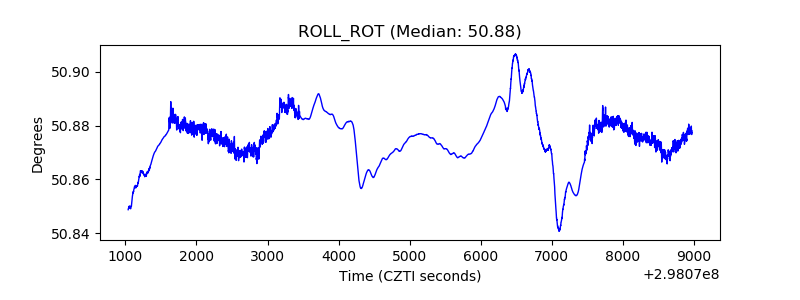 |
| _Roll_DEC | 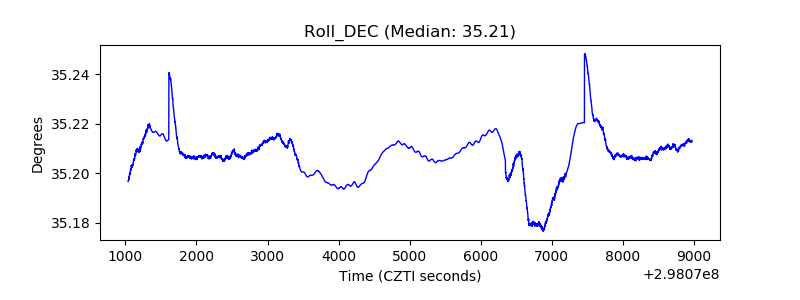 |
| _Roll_RA | 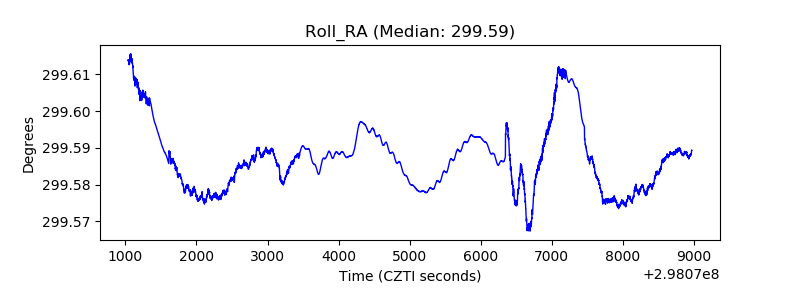 |
| Veto Counter |  |