| Param | Original file | Final file |
|---|---|---|
| Filename | modeM0/AS1A05_180T01_9000002986_20044cztM0_level2.evt | modeM0/AS1A05_180T01_9000002986_20044cztM0_level2_quad_clean.evt |
| Size (bytes) | 420,952,320 | 83,522,880 |
| Size | 401.5 MB | 79.7 MB |
| Events in quadrant A | 3,158,597 | 537,971 |
| Events in quadrant B | 3,121,103 | 540,276 |
| Events in quadrant C | 3,104,000 | 512,355 |
| Events in quadrant D | 2,950,427 | 513,058 |
| Mode SS | |||
|---|---|---|---|
| Quadrant | BADHDUFLAG | Total packets | Discarded packets |
| A | 0 | 122 | 0 |
| B | 0 | 122 | 0 |
| C | 0 | 122 | 0 |
| D | 0 | 122 | 0 |
| Mode M9 | |||
|---|---|---|---|
| Quadrant | BADHDUFLAG | Total packets | Discarded packets |
| A | 0 | 12 | 0 |
| B | 0 | 12 | 0 |
| C | 0 | 12 | 0 |
| D | 0 | 12 | 0 |
| Mode M0 | |||
|---|---|---|---|
| Quadrant | BADHDUFLAG | Total packets | Discarded packets |
| A | 0 | 13085 | 2 |
| B | 0 | 12910 | 1 |
| C | 0 | 12894 | 1 |
| D | 0 | 12637 | 1 |
| Quadrant | Total seconds | Saturated seconds | Saturation percentage |
|---|---|---|---|
| A | 6102 | 89 | 1.458538% |
| B | 6103 | 60 | 0.983123% |
| C | 6103 | 68 | 1.114206% |
| D | 6103 | 30 | 0.491562% |
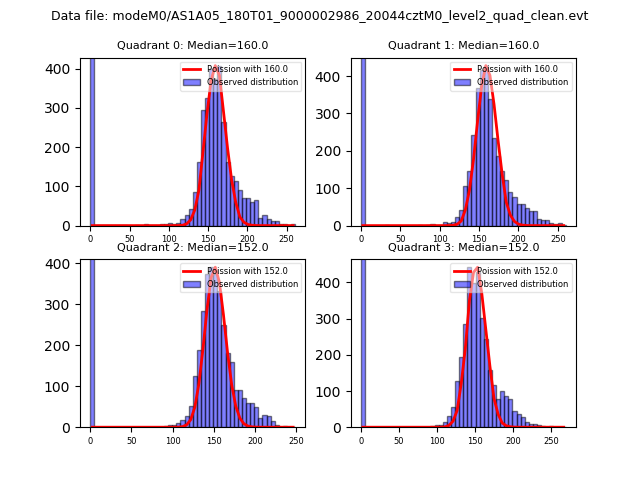
Noise dominated data is calculated using 1-second bins in cleaned event files. If a bin has >2000 counts, and if more than 50% of those come from <1% of pixels, then it is considered to be noise-dominated and hence unusable.
| Quadrant | # 1 sec bins | Bins with >0 counts | Bins with >2000 counts | High rate bins dominated by noise | Noise dominated (total time) | Noise dominated (detector-on time) | Marked lightcurve |
|---|---|---|---|---|---|---|---|
| A | 7222 | 6103 | 16 | 16 | 0.22% | 0.26% | 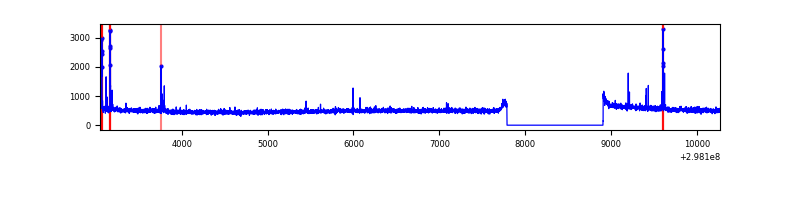 |
| B | 7223 | 6104 | 0 | 0 | 0.00% | 0.00% | 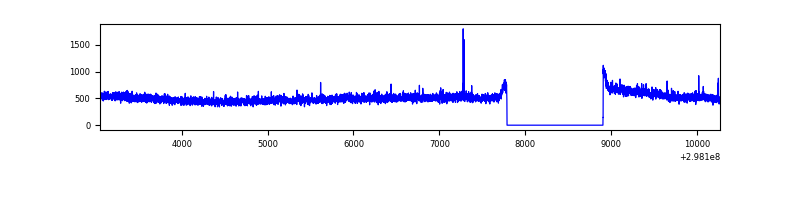 |
| C | 7223 | 6104 | 0 | 0 | 0.00% | 0.00% | 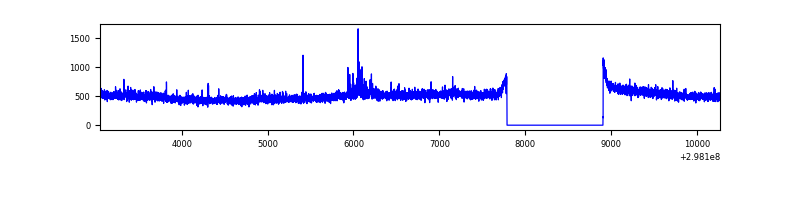 |
| D | 7223 | 6104 | 3 | 3 | 0.04% | 0.05% | 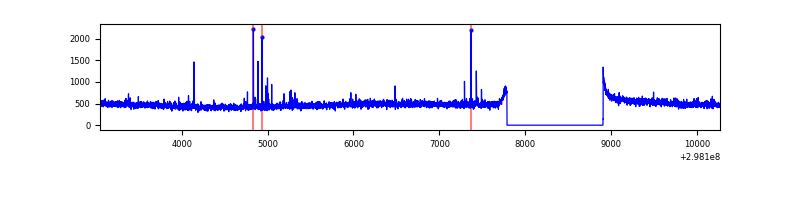 |
Top three noisy pixels from each quadrant. If the there are fewer than three noisy pixels in the level2.evt file, extra rows are filled as -1
| Pixel properties | Quadrant properties | ||||||
|---|---|---|---|---|---|---|---|
| Quadrant | DetID | PixID | Counts | Sigma | Mean | Median | Sigma |
| A | 14 | 238 | 89814 | 553.44 | 796 | 783 | 160.9 |
| A | 0 | 226 | 6888 | 37.95 | 796 | 783 | 160.9 |
| A | 3 | 137 | 6088 | 32.98 | 796 | 783 | 160.9 |
| B | 0 | 198 | 29864 | 194.81 | 784 | 767 | 149.4 |
| B | 12 | 111 | 17594 | 112.66 | 784 | 767 | 149.4 |
| B | 11 | 111 | 15476 | 98.48 | 784 | 767 | 149.4 |
| C | 14 | 238 | 119770 | 675.91 | 749 | 757 | 176.1 |
| C | 7 | 220 | 54081 | 302.84 | 749 | 757 | 176.1 |
| C | 3 | 233 | 9930 | 52.09 | 749 | 757 | 176.1 |
| D | 2 | 234 | 27388 | 144.21 | 768 | 749 | 184.7 |
| D | 7 | 96 | 22825 | 119.51 | 768 | 749 | 184.7 |
| D | 1 | 52 | 18589 | 96.58 | 768 | 749 | 184.7 |
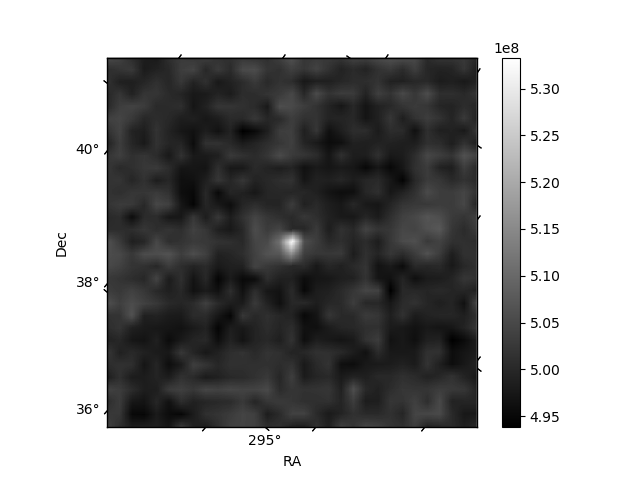
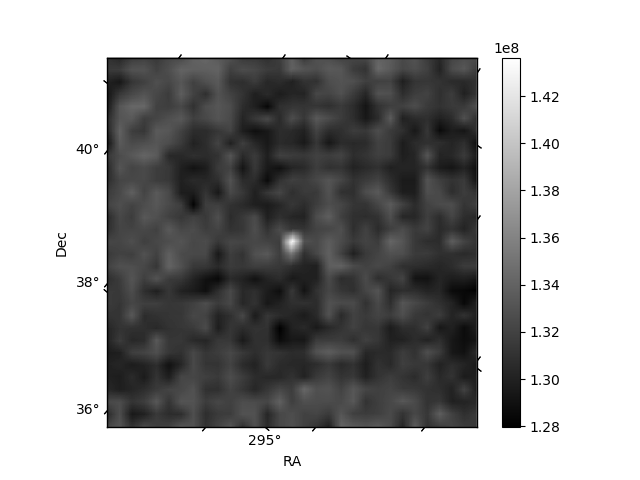
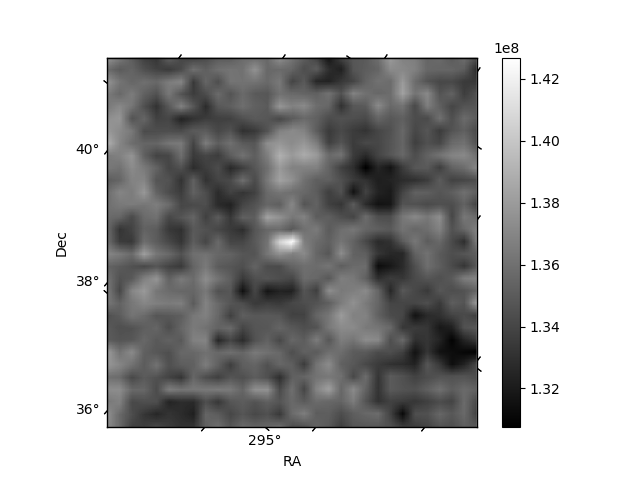
Histogram calculated using DETX and DETY for each event in the final _common_clean file
| Quadrant A |  |
 |
Quadrant B |
|---|---|---|---|
| Quadrant D |  |
 |
Quadrant C |
| Plot type | Count rate plots | Images |
|---|---|---|
| Comparison with Poisson distribution Blue bars denote a histogram of data divided into 1 sec bins. Red curve is a Poisson curve with rate = median count rate of data. |
 |
 |
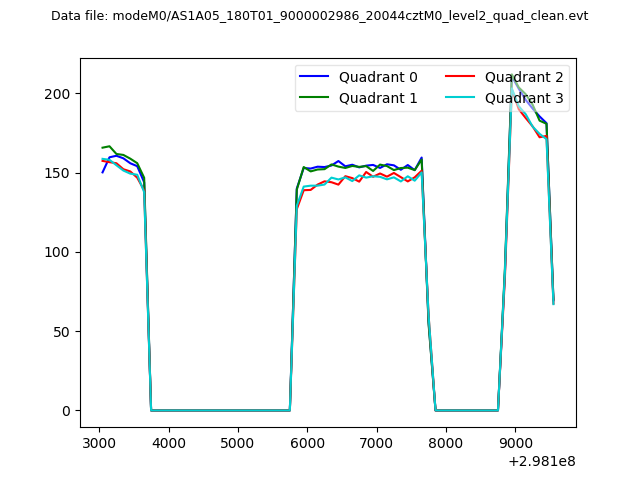
| Quadrant-wise count rates Data is divided into 100 sec bins |
 |
|
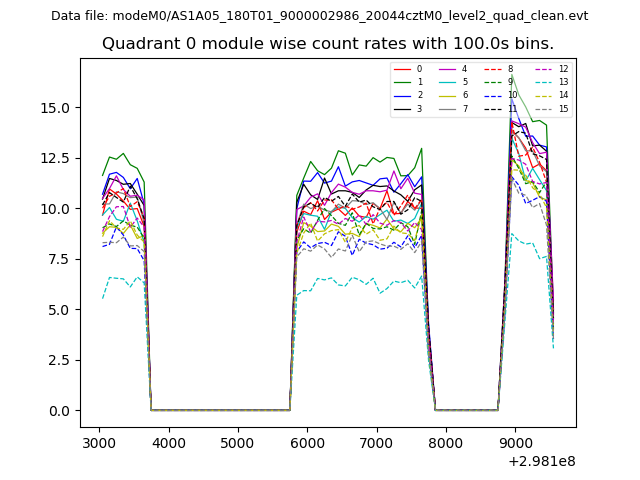
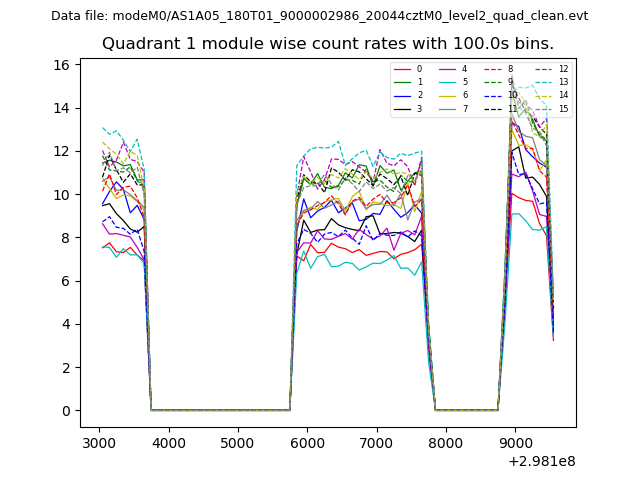
| Module-wise count rates for Quadrant A Data is divided into 100 sec bins |
 |
 |
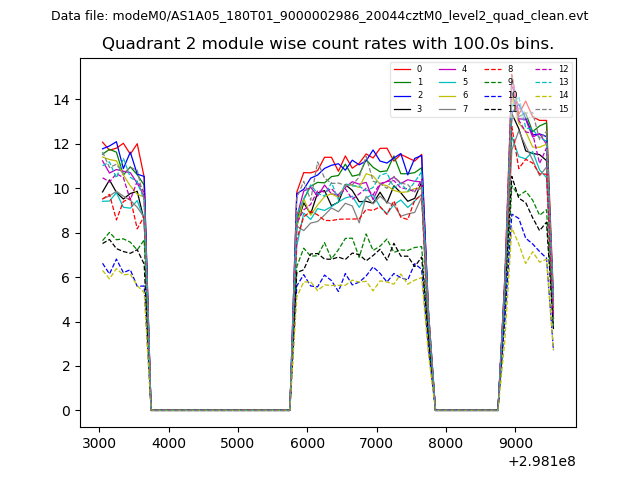
| Module-wise count rates for Quadrant B Data is divided into 100 sec bins |
 |
 |
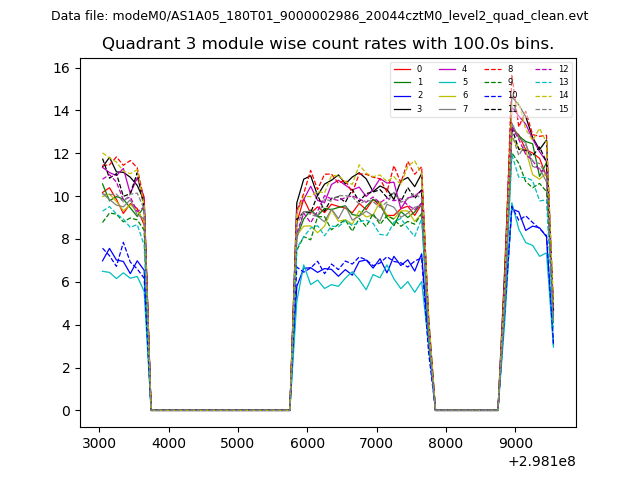
| Module-wise count rates for Quadrant C Data is divided into 100 sec bins |
 |
 |
| Module-wise count rates for Quadrant D Data is divided into 100 sec bins |
 |
 |
| Parameter | Plot |
|---|---|
| CZT HV Monitor | 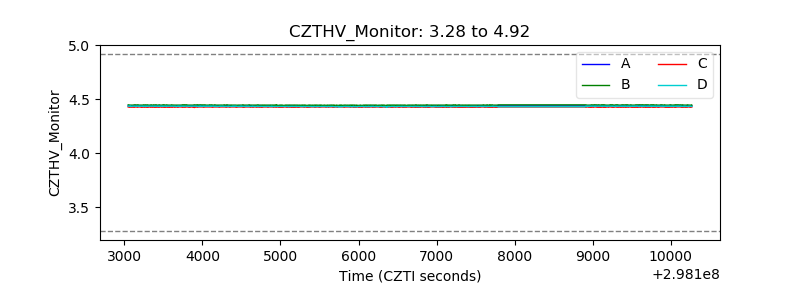 |
| D_VDD | 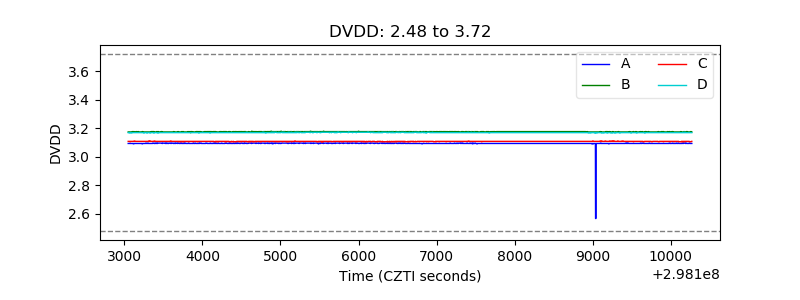 |
| Temperature 1 | 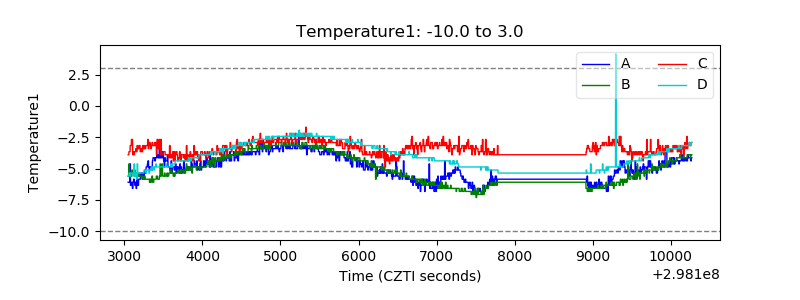 |
| Veto HV Monitor |  |
| Veto LLD | 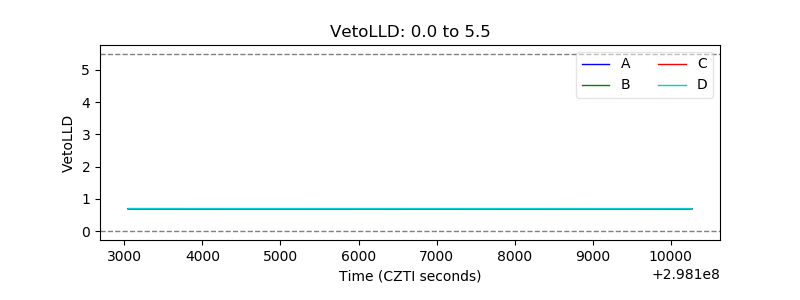 |
| Alpha Counter | 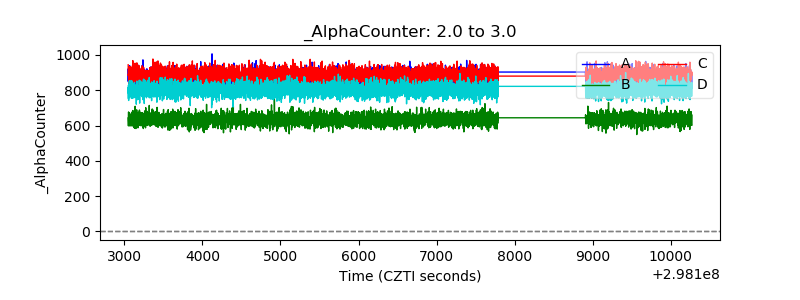 |
| _CPM_Rate |  |
| CZT Counter | 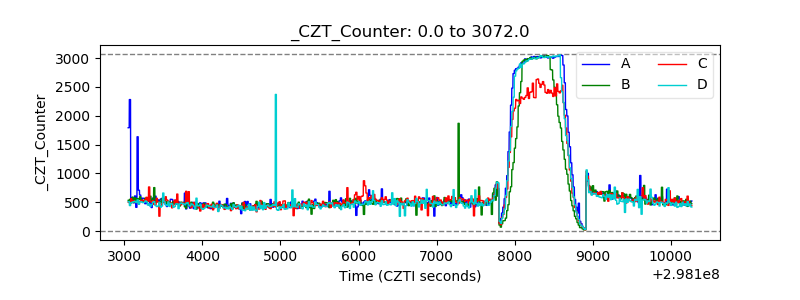 |
| +2.5 Volts monitor | 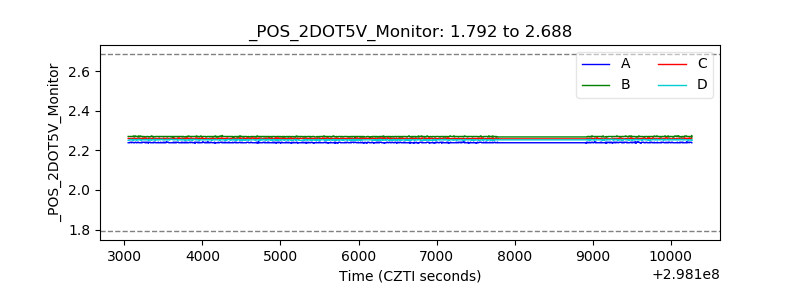 |
| +5 Volts monitor |  |
| _ROLL_ROT | 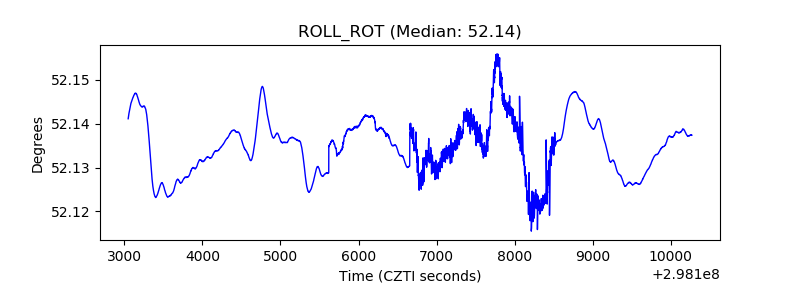 |
| _Roll_DEC | 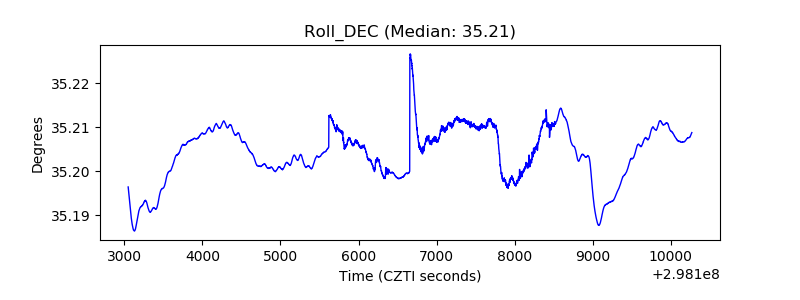 |
| _Roll_RA | 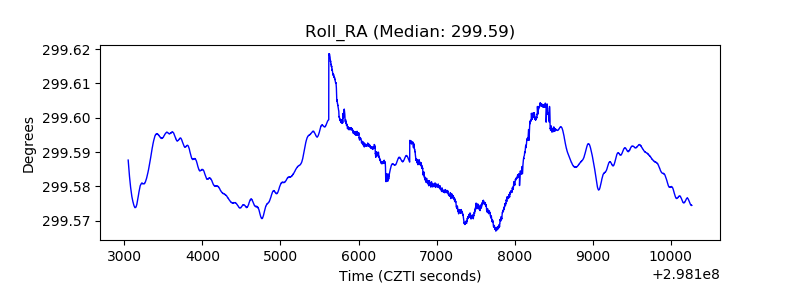 |
| Veto Counter | 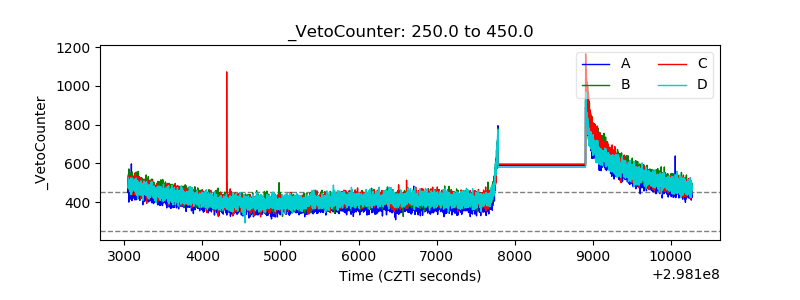 |