| Param | Original file | Final file |
|---|---|---|
| Filename | modeM0/AS1A05_180T01_9000002986_20046cztM0_level2.evt | modeM0/AS1A05_180T01_9000002986_20046cztM0_level2_quad_clean.evt |
| Size (bytes) | 528,592,320 | 75,712,320 |
| Size | 504.1 MB | 72.2 MB |
| Events in quadrant A | 3,829,152 | 474,756 |
| Events in quadrant B | 3,637,243 | 475,252 |
| Events in quadrant C | 3,630,618 | 450,352 |
| Events in quadrant D | 4,476,457 | 444,340 |
| Mode SS | |||
|---|---|---|---|
| Quadrant | BADHDUFLAG | Total packets | Discarded packets |
| A | 0 | 132 | 0 |
| B | 0 | 132 | 0 |
| C | 0 | 132 | 0 |
| D | 0 | 132 | 0 |
| Mode M9 | |||
|---|---|---|---|
| Quadrant | BADHDUFLAG | Total packets | Discarded packets |
| A | 0 | 14 | 0 |
| B | 0 | 15 | 0 |
| C | 0 | 15 | 0 |
| D | 0 | 15 | 0 |
| Mode M0 | |||
|---|---|---|---|
| Quadrant | BADHDUFLAG | Total packets | Discarded packets |
| A | 0 | 15463 | 2 |
| B | 0 | 14760 | 2 |
| C | 0 | 14546 | 2 |
| D | 0 | 17422 | 2 |
| Quadrant | Total seconds | Saturated seconds | Saturation percentage |
|---|---|---|---|
| A | 6414 | 124 | 1.933271% |
| B | 6414 | 93 | 1.449953% |
| C | 6414 | 112 | 1.746180% |
| D | 6414 | 164 | 2.556907% |
Noise dominated data is calculated using 1-second bins in cleaned event files. If a bin has >2000 counts, and if more than 50% of those come from <1% of pixels, then it is considered to be noise-dominated and hence unusable.
| Quadrant | # 1 sec bins | Bins with >0 counts | Bins with >2000 counts | High rate bins dominated by noise | Noise dominated (total time) | Noise dominated (detector-on time) | Marked lightcurve |
|---|---|---|---|---|---|---|---|
| A | 7739 | 6415 | 25 | 25 | 0.32% | 0.39% | 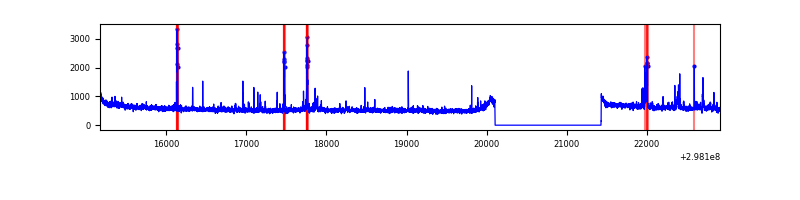 |
| B | 7739 | 6415 | 0 | 0 | 0.00% | 0.00% | 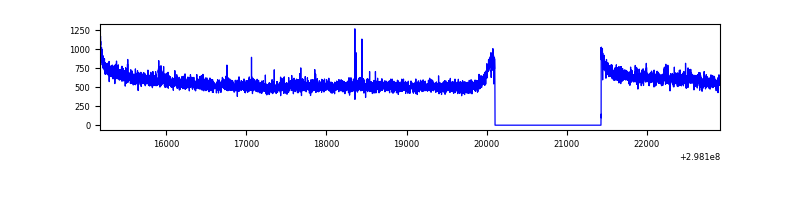 |
| C | 7739 | 6415 | 0 | 0 | 0.00% | 0.00% | 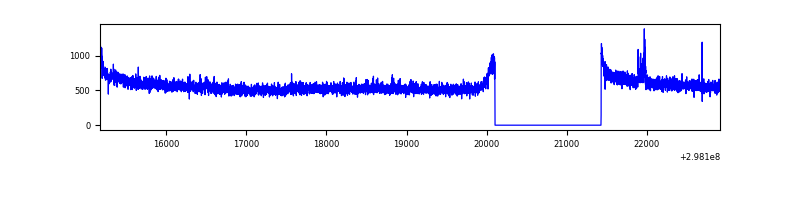 |
| D | 7739 | 6415 | 71 | 71 | 0.92% | 1.11% | 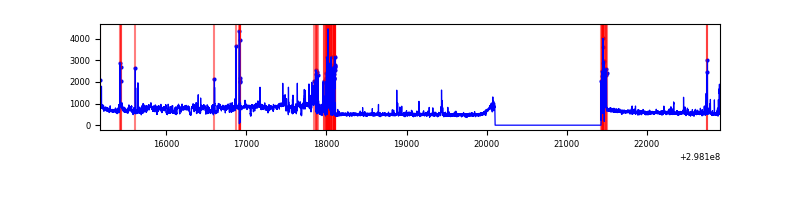 |
Top three noisy pixels from each quadrant. If the there are fewer than three noisy pixels in the level2.evt file, extra rows are filled as -1
| Pixel properties | Quadrant properties | ||||||
|---|---|---|---|---|---|---|---|
| Quadrant | DetID | PixID | Counts | Sigma | Mean | Median | Sigma |
| A | 14 | 238 | 207056 | 1120.58 | 938 | 926 | 183.9 |
| A | 14 | 254 | 8538 | 41.38 | 938 | 926 | 183.9 |
| A | 0 | 226 | 8025 | 38.59 | 938 | 926 | 183.9 |
| B | 12 | 111 | 19559 | 109.22 | 922 | 903 | 170.8 |
| B | 11 | 111 | 16992 | 94.19 | 922 | 903 | 170.8 |
| B | 14 | 111 | 15373 | 84.71 | 922 | 903 | 170.8 |
| C | 14 | 238 | 143560 | 710.43 | 881 | 891 | 200.8 |
| C | 3 | 233 | 31175 | 150.8 | 881 | 891 | 200.8 |
| C | 5 | 4 | 19014 | 90.25 | 881 | 891 | 200.8 |
| D | 1 | 52 | 719394 | 3324.36 | 898 | 875 | 216.1 |
| D | 12 | 218 | 304838 | 1406.34 | 898 | 875 | 216.1 |
| D | 7 | 96 | 37541 | 169.64 | 898 | 875 | 216.1 |
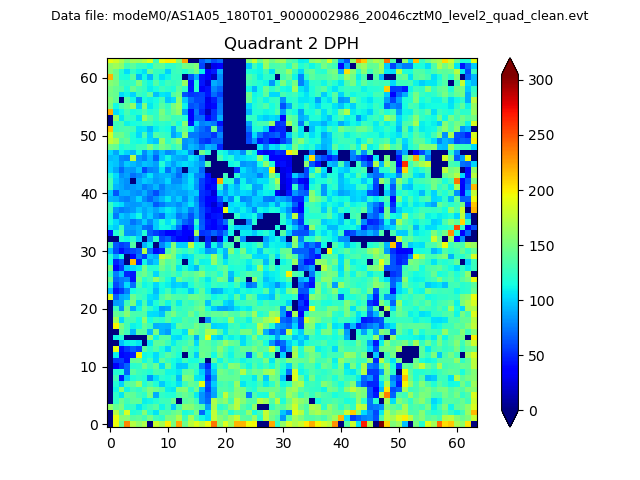
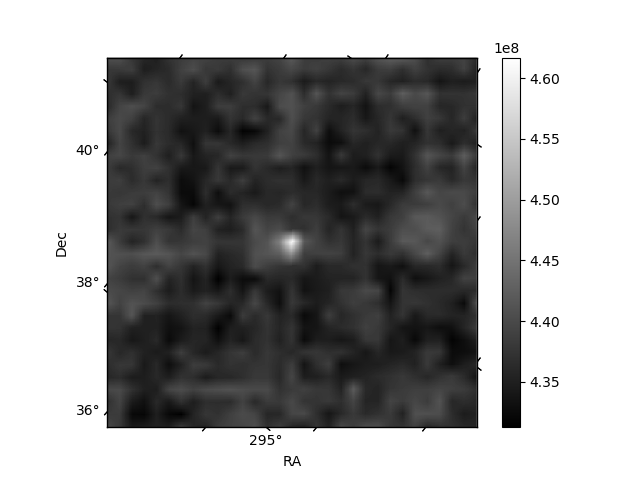
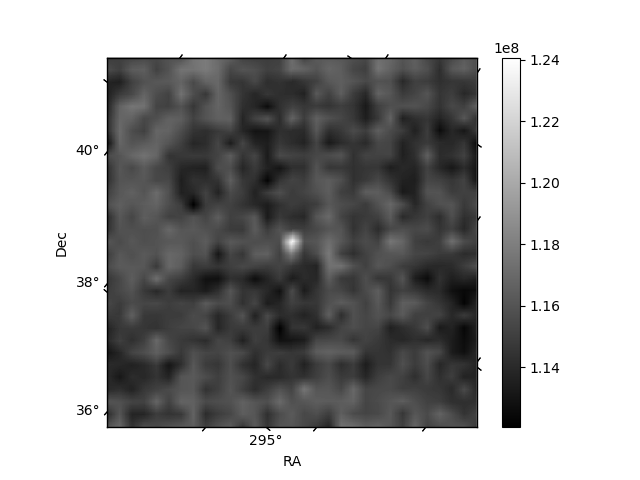
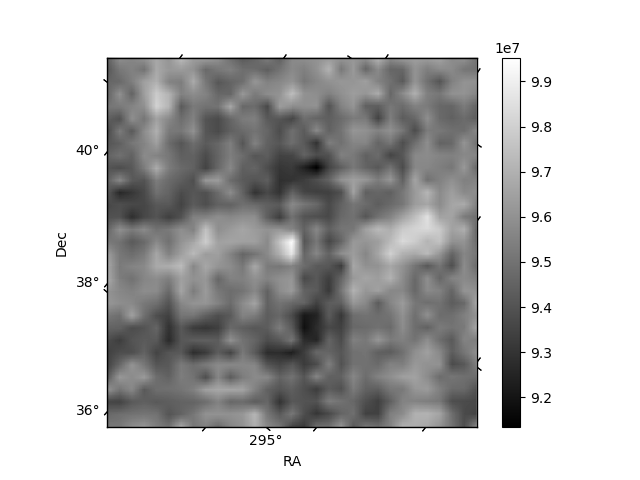
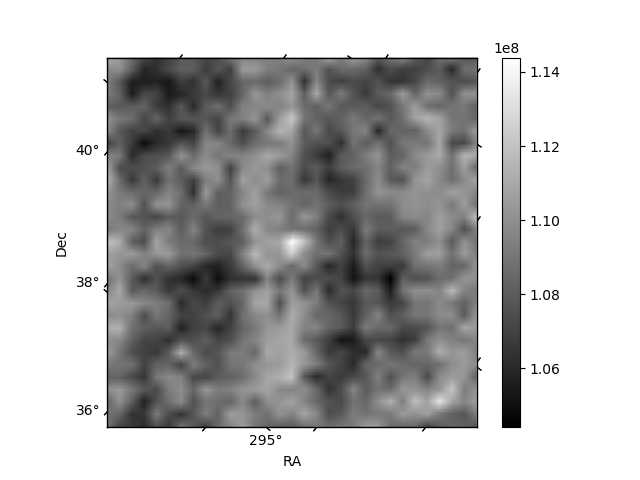
Histogram calculated using DETX and DETY for each event in the final _common_clean file
| Quadrant A | 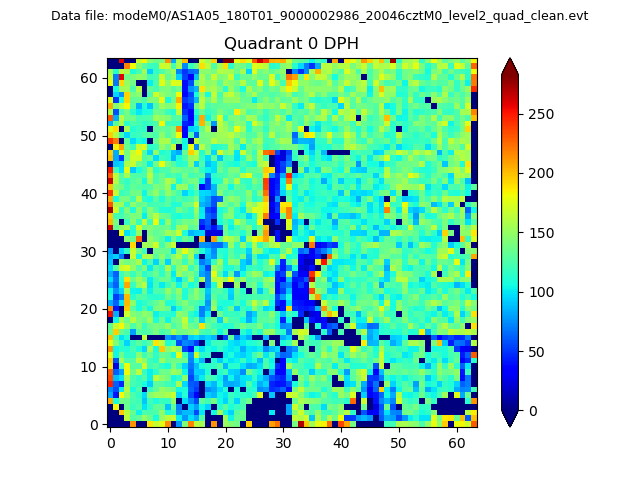 |
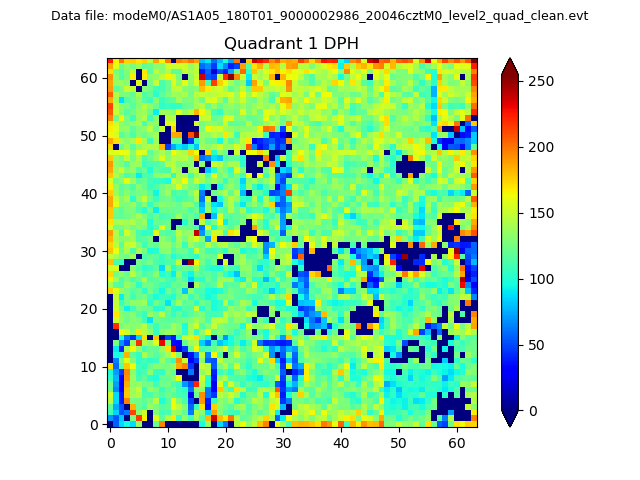 |
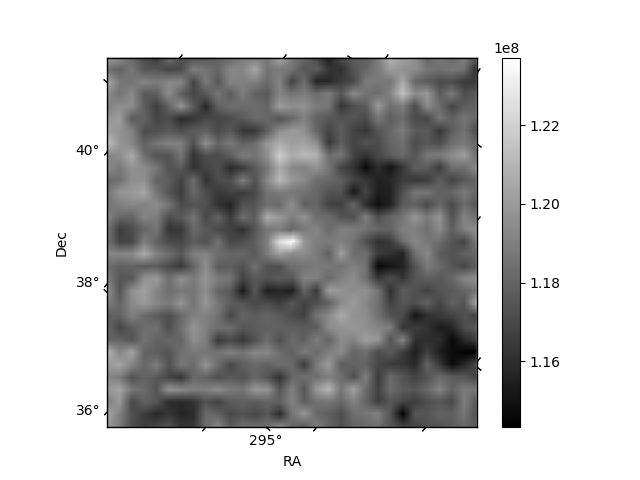
Quadrant B |
|---|---|---|---|
| Quadrant D | 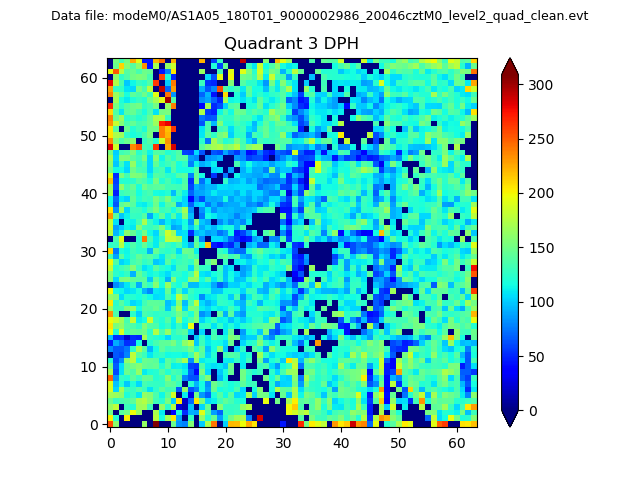 |
 |
Quadrant C |
| Plot type | Count rate plots | Images |
|---|---|---|
| Comparison with Poisson distribution Blue bars denote a histogram of data divided into 1 sec bins. Red curve is a Poisson curve with rate = median count rate of data. |
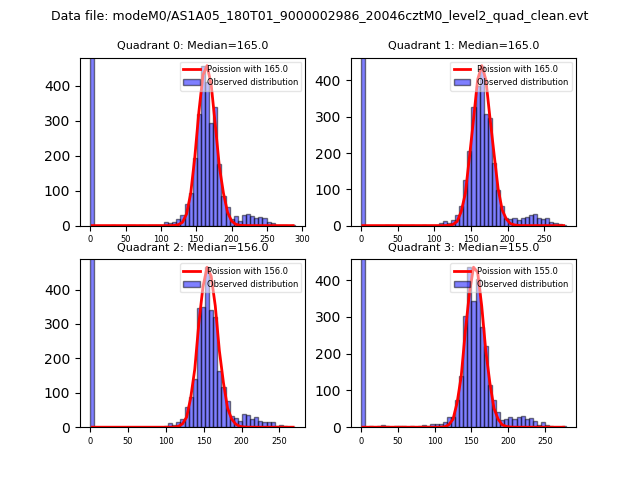 |
 |
| Quadrant-wise count rates Data is divided into 100 sec bins |
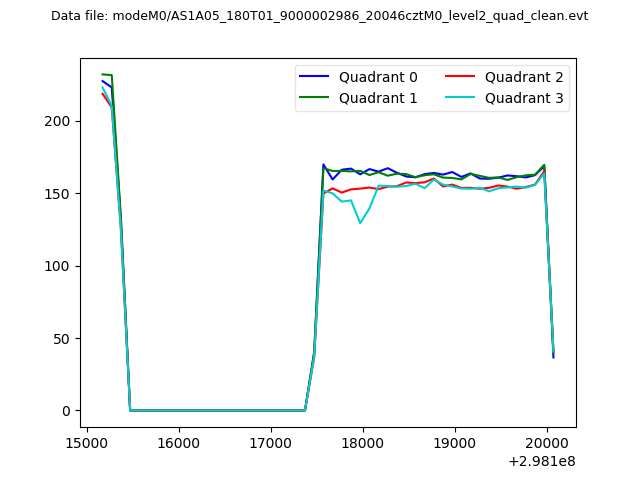 |
|
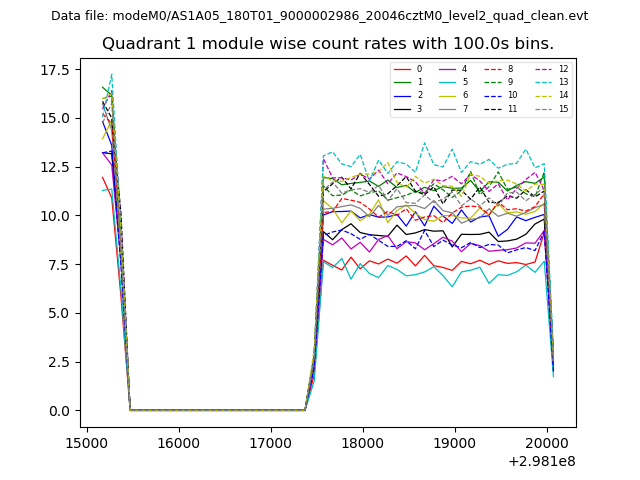
| Module-wise count rates for Quadrant A Data is divided into 100 sec bins |
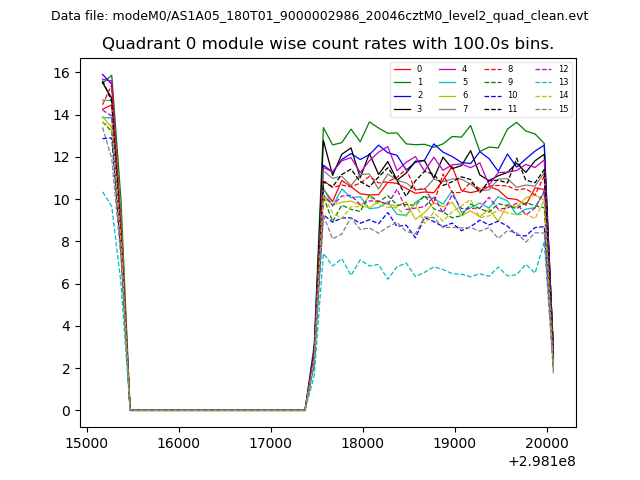 |
 |
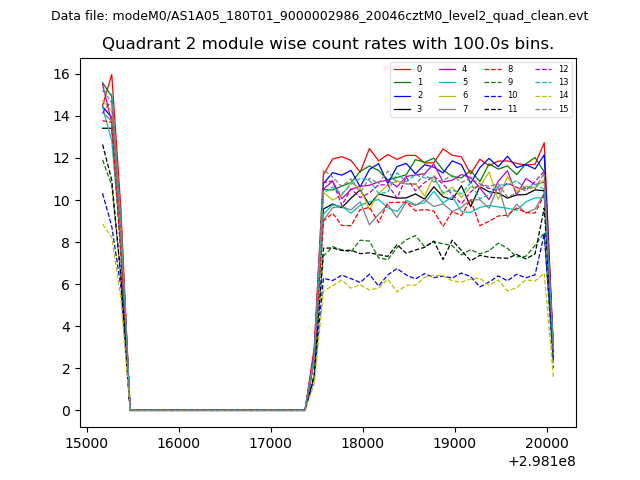
| Module-wise count rates for Quadrant B Data is divided into 100 sec bins |
 |
 |
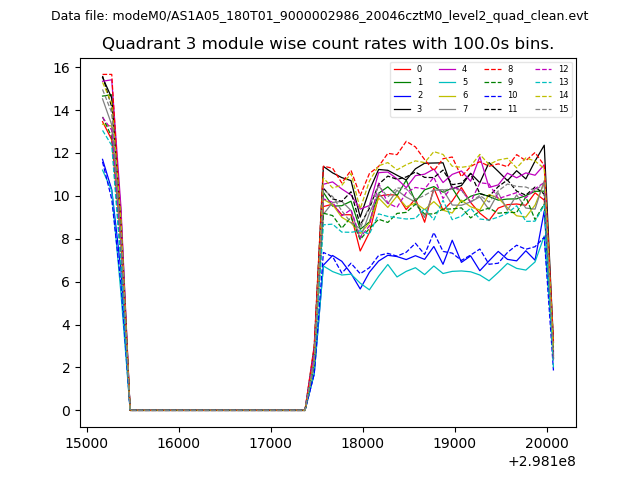
| Module-wise count rates for Quadrant C Data is divided into 100 sec bins |
 |
 |
| Module-wise count rates for Quadrant D Data is divided into 100 sec bins |
 |
 |
| Parameter | Plot |
|---|---|
| CZT HV Monitor | 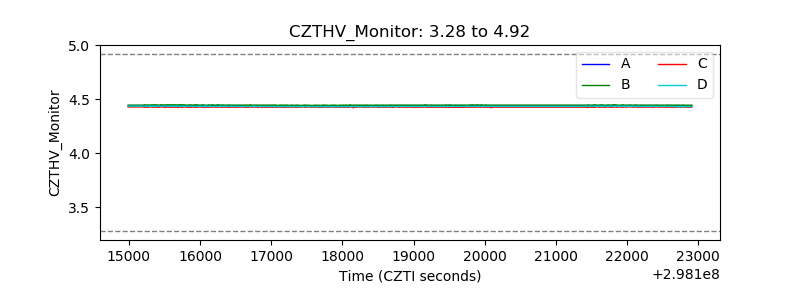 |
| D_VDD | 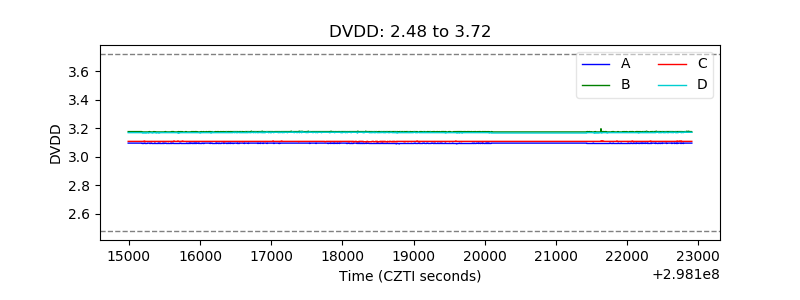 |
| Temperature 1 | 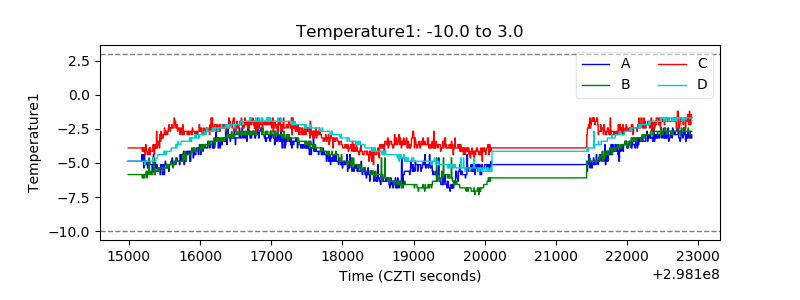 |
| Veto HV Monitor | 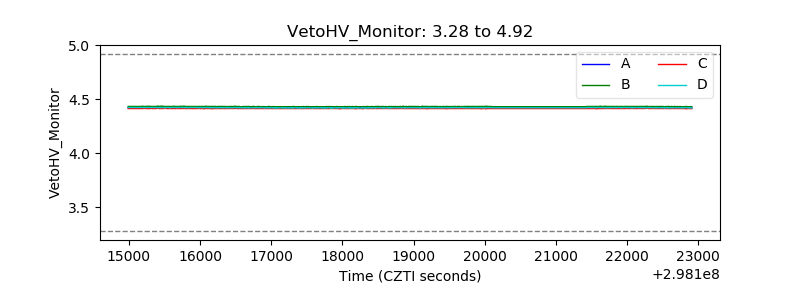 |
| Veto LLD | 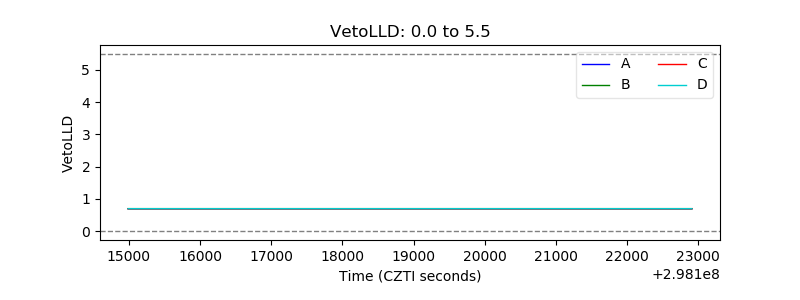 |
| Alpha Counter |  |
| _CPM_Rate | 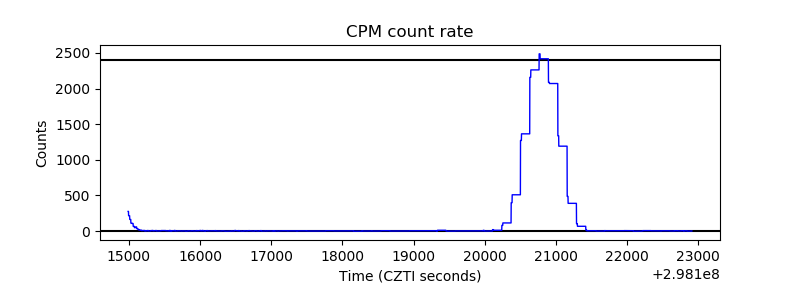 |
| CZT Counter | 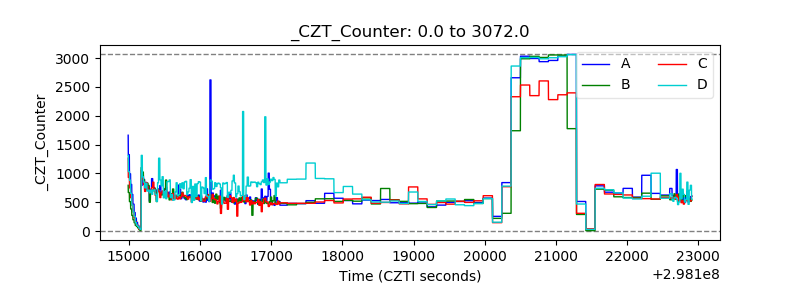 |
| +2.5 Volts monitor | 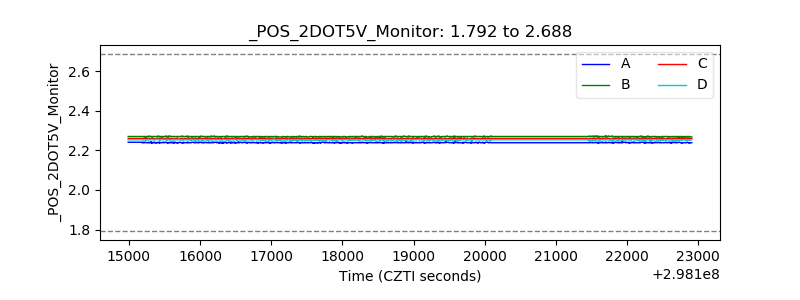 |
| +5 Volts monitor |  |
| _ROLL_ROT | 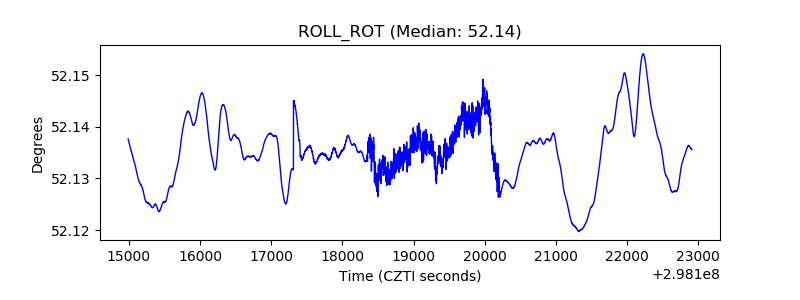 |
| _Roll_DEC | 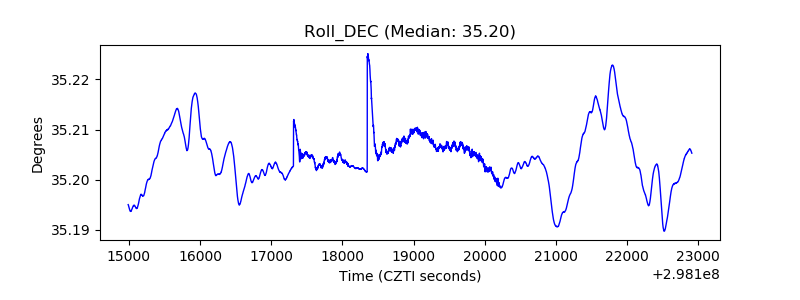 |
| _Roll_RA | 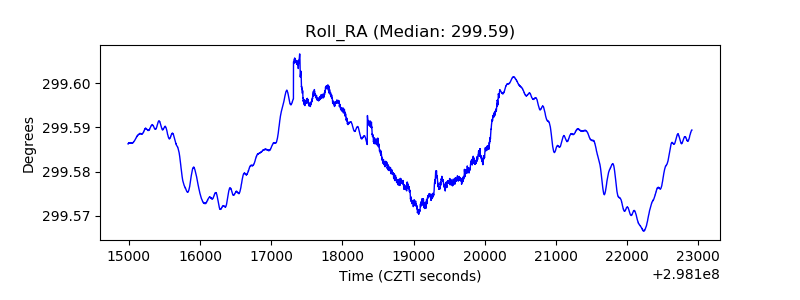 |
| Veto Counter | 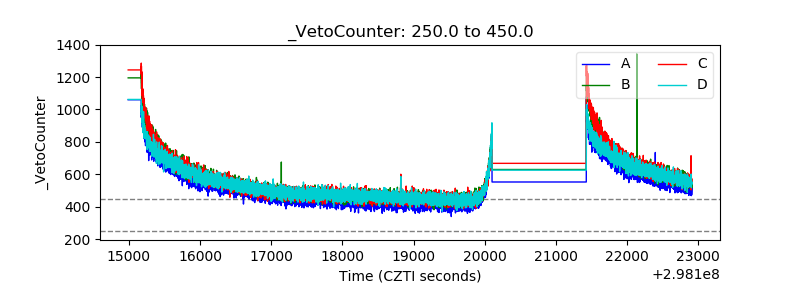 |