| Param | Original file | Final file |
|---|---|---|
| Filename | modeM0/AS1T03_117T01_9000002988cztM0_level2.fits | modeM0/AS1T03_117T01_9000002988cztM0_level2_quad_clean.evt |
| Size (bytes) | 802,042,560 | 643,481,280 |
| Size | 764.9 MB | 613.7 MB |
| Events in quadrant A | 5,003,838 | 3,711,758 |
| Events in quadrant B | 4,799,544 | 3,695,646 |
| Events in quadrant C | 4,856,940 | 3,487,367 |
| Events in quadrant D | 4,299,490 | 3,260,546 |
| Mode M9 | |||
|---|---|---|---|
| Quadrant | BADHDUFLAG | Total packets | Discarded packets |
| A | 0 | 123 | 0 |
| B | 0 | 123 | 0 |
| C | 0 | 123 | 0 |
| D | 0 | 123 | 0 |
| Mode M0 | |||
|---|---|---|---|
| Quadrant | BADHDUFLAG | Total packets | Discarded packets |
| A | 0 | 170226 | 0 |
| B | 0 | 166993 | 0 |
| C | 0 | 164376 | 0 |
| D | 0 | 180727 | 0 |
| Mode SS | |||
|---|---|---|---|
| Quadrant | BADHDUFLAG | Total packets | Discarded packets |
| A | 0 | 1582 | 0 |
| B | 0 | 1582 | 0 |
| C | 0 | 1582 | 0 |
| D | 0 | 1582 | 0 |
| Quadrant | Total seconds | Saturated seconds | Saturation percentage |
|---|---|---|---|
| A | 77743 | 1415 | 1.820100% |
| B | 77743 | 1288 | 1.656741% |
| C | 77743 | 1363 | 1.753213% |
| D | 77743 | 1411 | 1.814954% |
Noise dominated data is calculated using 1-second bins in cleaned event files. If a bin has >2000 counts, and if more than 50% of those come from <1% of pixels, then it is considered to be noise-dominated and hence unusable.
| Quadrant | # 1 sec bins | Bins with >0 counts | Bins with >2000 counts | High rate bins dominated by noise | Noise dominated (total time) | Noise dominated (detector-on time) | Marked lightcurve |
|---|---|---|---|---|---|---|---|
| A | 90113 | 77737 | 0 | 0 | 0.00% | 0.00% |  |
| B | 90113 | 77742 | 0 | 0 | 0.00% | 0.00% |  |
| C | 90113 | 77743 | 0 | 0 | 0.00% | 0.00% | 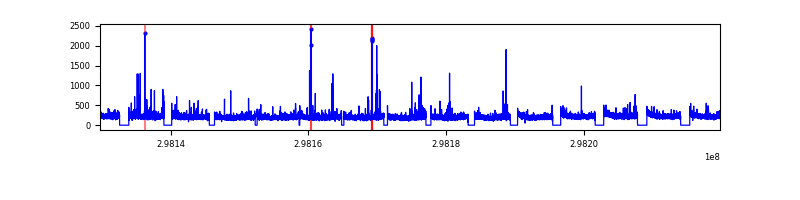 |
| D | 90113 | 77733 | 0 | 0 | 0.00% | 0.00% | 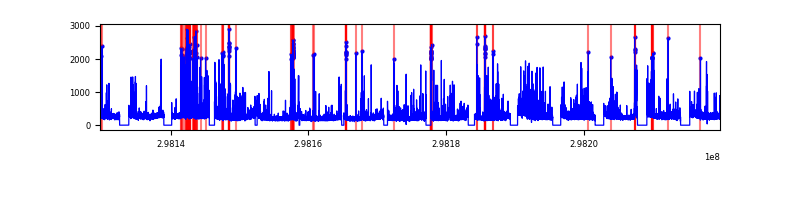 |
Top three noisy pixels from each quadrant. If the there are fewer than three noisy pixels in the level2.evt file, extra rows are filled as -1
| Pixel properties | Quadrant properties | ||||||
|---|---|---|---|---|---|---|---|
| Quadrant | DetID | PixID | Counts | Sigma | Mean | Median | Sigma |
| A | 0 | 29 | 4732 | 10.89 | 1303 | 1221 | 322.4 |
| A | 7 | 110 | 3940 | 8.43 | 1303 | 1221 | 322.4 |
| A | 9 | 19 | 3735 | 7.8 | 1303 | 1221 | 322.4 |
| B | 2 | 9 | 3834 | 10.44 | 1265 | 1208 | 251.4 |
| B | 2 | 8 | 3300 | 8.32 | 1265 | 1208 | 251.4 |
| B | 3 | 17 | 3108 | 7.56 | 1265 | 1208 | 251.4 |
| C | 1 | 81 | 3691 | 7.6 | 1283 | 1202 | 327.3 |
| C | 1 | 80 | 3619 | 7.38 | 1283 | 1202 | 327.3 |
| C | 12 | 241 | 3407 | 6.74 | 1283 | 1202 | 327.3 |
| D | 10 | 189 | 3076 | 6.04 | 1227 | 1123 | 323.1 |
| D | 3 | 14 | 3047 | 5.95 | 1227 | 1123 | 323.1 |
| D | 7 | 3 | 2980 | 5.75 | 1227 | 1123 | 323.1 |
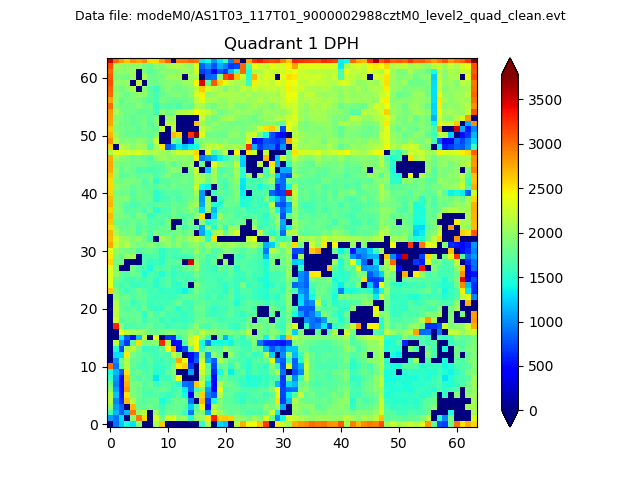
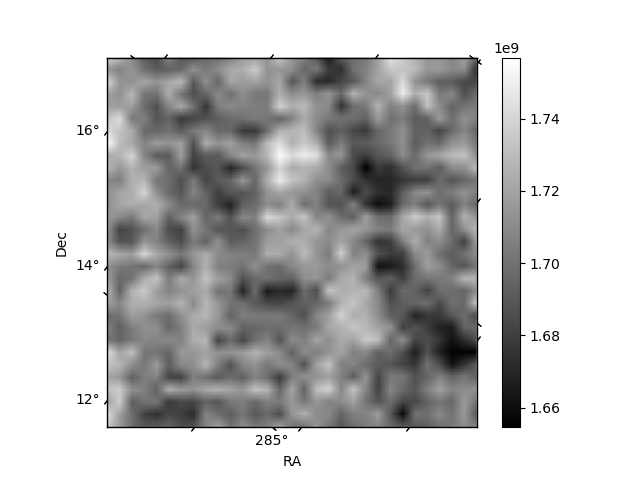
Histogram calculated using DETX and DETY for each event in the final _common_clean file
| Quadrant A |  |
 |
Quadrant B |
|---|---|---|---|
| Quadrant D |  |
 |
Quadrant C |
| Plot type | Count rate plots | Images |
|---|---|---|
| Comparison with Poisson distribution Blue bars denote a histogram of data divided into 1 sec bins. Red curve is a Poisson curve with rate = median count rate of data. |
 |
 |
| Quadrant-wise count rates Data is divided into 100 sec bins |
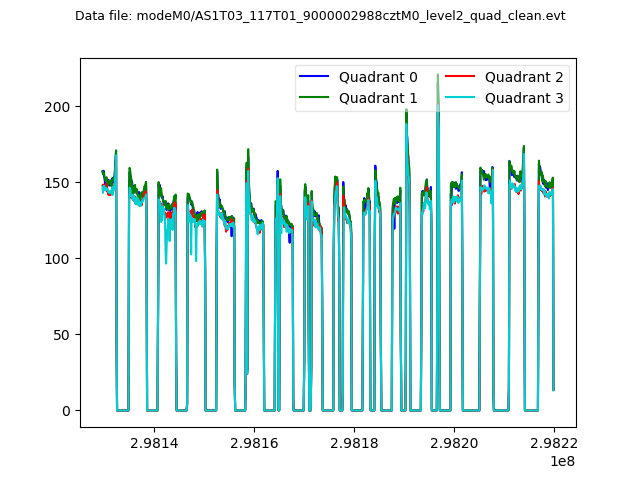 |
|
| Module-wise count rates for Quadrant A Data is divided into 100 sec bins |
 |
 |
| Module-wise count rates for Quadrant B Data is divided into 100 sec bins |
 |
 |
| Module-wise count rates for Quadrant C Data is divided into 100 sec bins |
 |
 |
| Module-wise count rates for Quadrant D Data is divided into 100 sec bins |
 |
 |
| Parameter | Plot |
|---|---|
| CZT HV Monitor |  |
| D_VDD | 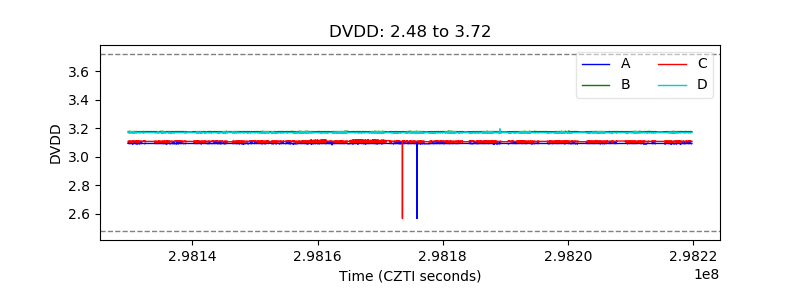 |
| Temperature 1 |  |
| Veto HV Monitor | 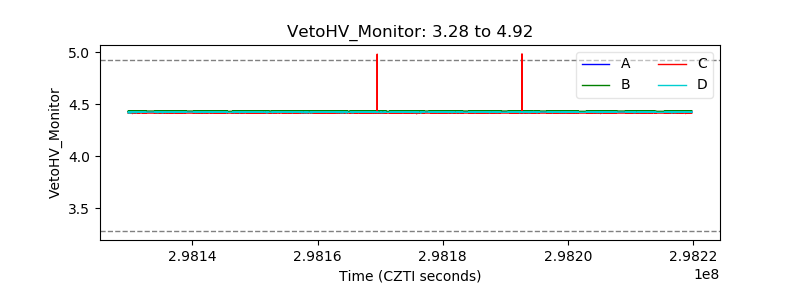 |
| Veto LLD | 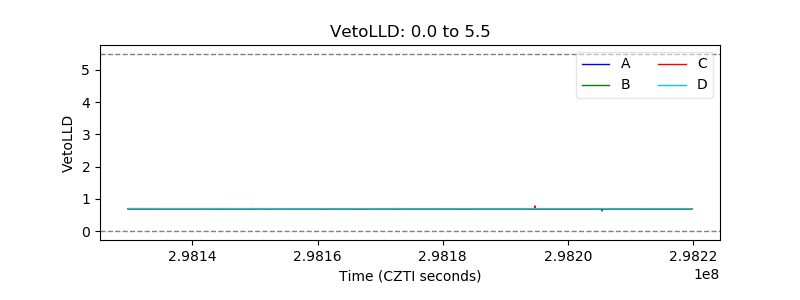 |
| Alpha Counter |  |
| _CPM_Rate |  |
| CZT Counter | 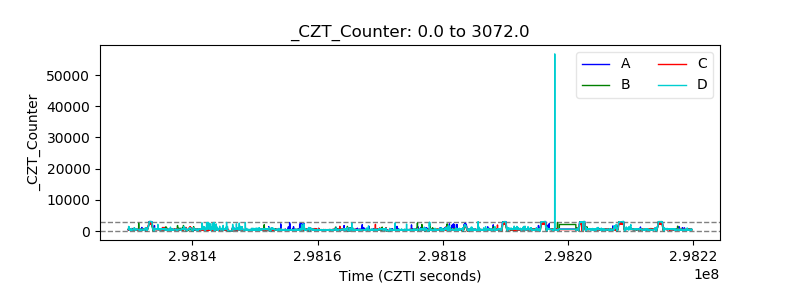 |
| +2.5 Volts monitor |  |
| +5 Volts monitor |  |
| _ROLL_ROT | 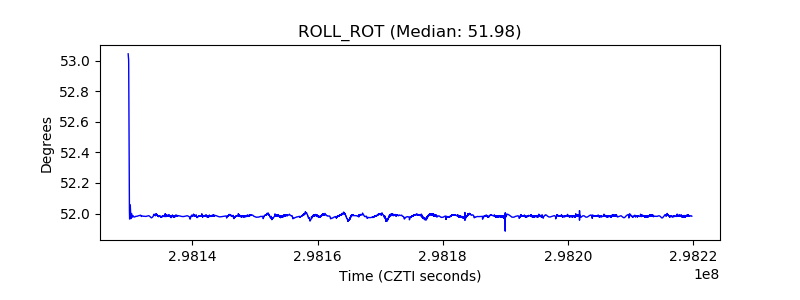 |
| _Roll_DEC |  |
| _Roll_RA |  |
| Veto Counter | 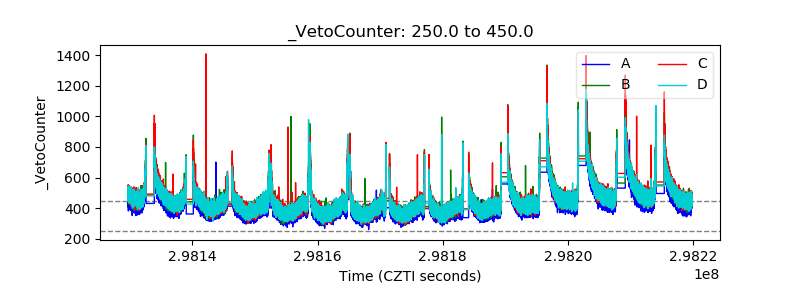 |