| Param | Original file | Final file |
|---|---|---|
| Filename | modeM0/AS1T03_117T01_9000002988_20049cztM0_level2.evt | modeM0/AS1T03_117T01_9000002988_20049cztM0_level2_quad_clean.evt |
| Size (bytes) | 486,984,960 | 93,758,400 |
| Size | 464.4 MB | 89.4 MB |
| Events in quadrant A | 3,402,245 | 611,311 |
| Events in quadrant B | 3,700,793 | 612,330 |
| Events in quadrant C | 3,486,701 | 583,548 |
| Events in quadrant D | 3,721,055 | 582,472 |
| Mode M9 | |||
|---|---|---|---|
| Quadrant | BADHDUFLAG | Total packets | Discarded packets |
| A | 0 | 23 | 0 |
| B | 0 | 24 | 0 |
| C | 0 | 24 | 0 |
| D | 0 | 24 | 0 |
| Mode M0 | |||
|---|---|---|---|
| Quadrant | BADHDUFLAG | Total packets | Discarded packets |
| A | 0 | 13986 | 2 |
| B | 0 | 14845 | 2 |
| C | 0 | 14164 | 2 |
| D | 0 | 14992 | 2 |
| Mode SS | |||
|---|---|---|---|
| Quadrant | BADHDUFLAG | Total packets | Discarded packets |
| A | 0 | 132 | 0 |
| B | 0 | 132 | 0 |
| C | 0 | 132 | 0 |
| D | 0 | 132 | 0 |
| Quadrant | Total seconds | Saturated seconds | Saturation percentage |
|---|---|---|---|
| A | 6442 | 76 | 1.179758% |
| B | 6442 | 140 | 2.173238% |
| C | 6442 | 130 | 2.018007% |
| D | 6442 | 79 | 1.226327% |
Noise dominated data is calculated using 1-second bins in cleaned event files. If a bin has >2000 counts, and if more than 50% of those come from <1% of pixels, then it is considered to be noise-dominated and hence unusable.
| Quadrant | # 1 sec bins | Bins with >0 counts | Bins with >2000 counts | High rate bins dominated by noise | Noise dominated (total time) | Noise dominated (detector-on time) | Marked lightcurve |
|---|---|---|---|---|---|---|---|
| A | 7582 | 6443 | 3 | 3 | 0.04% | 0.05% |  |
| B | 7582 | 6443 | 43 | 43 | 0.57% | 0.67% |  |
| C | 7582 | 6443 | 3 | 3 | 0.04% | 0.05% | 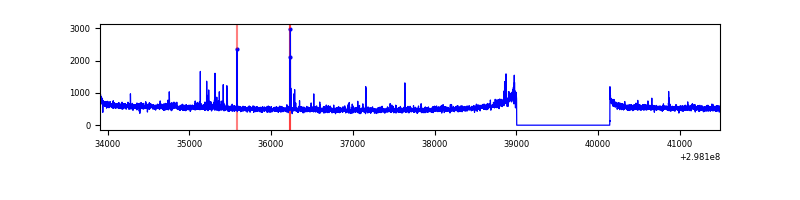 |
| D | 7582 | 6443 | 15 | 15 | 0.20% | 0.23% | 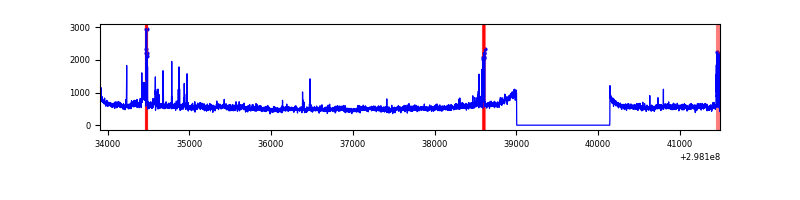 |
Top three noisy pixels from each quadrant. If the there are fewer than three noisy pixels in the level2.evt file, extra rows are filled as -1
| Pixel properties | Quadrant properties | ||||||
|---|---|---|---|---|---|---|---|
| Quadrant | DetID | PixID | Counts | Sigma | Mean | Median | Sigma |
| A | 14 | 238 | 55385 | 314.45 | 867 | 852 | 173.4 |
| A | 0 | 226 | 7545 | 38.59 | 867 | 852 | 173.4 |
| A | 13 | 254 | 7478 | 38.21 | 867 | 852 | 173.4 |
| B | 10 | 245 | 310235 | 1873.21 | 858 | 837 | 165.2 |
| B | 0 | 198 | 24625 | 144.02 | 858 | 837 | 165.2 |
| B | 4 | 80 | 20656 | 119.99 | 858 | 837 | 165.2 |
| C | 14 | 238 | 130596 | 668.45 | 834 | 842 | 194.1 |
| C | 4 | 254 | 96276 | 491.64 | 834 | 842 | 194.1 |
| C | 3 | 233 | 9265 | 43.39 | 834 | 842 | 194.1 |
| D | 2 | 184 | 313074 | 1536.52 | 849 | 828 | 203.2 |
| D | 12 | 218 | 74283 | 361.46 | 849 | 828 | 203.2 |
| D | 1 | 52 | 50127 | 242.59 | 849 | 828 | 203.2 |
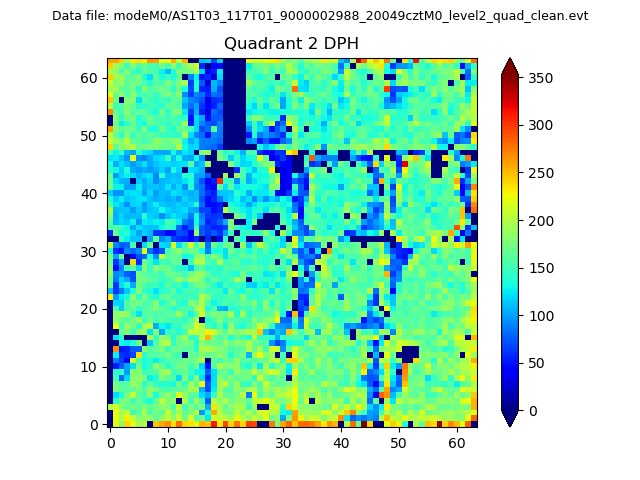
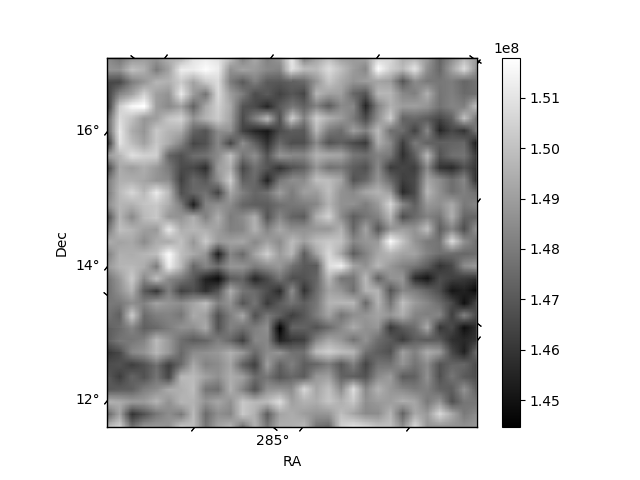
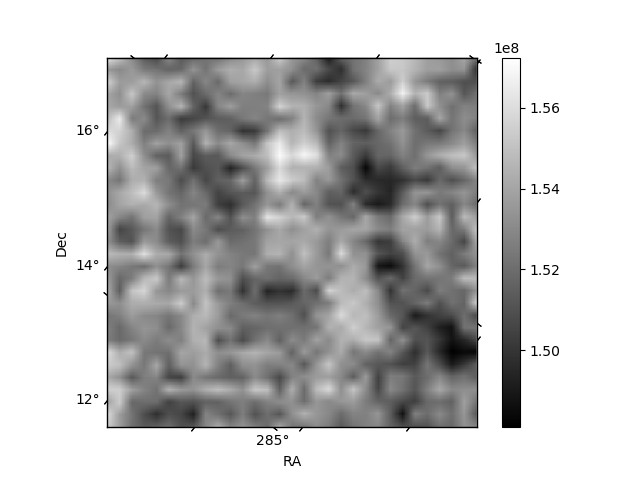
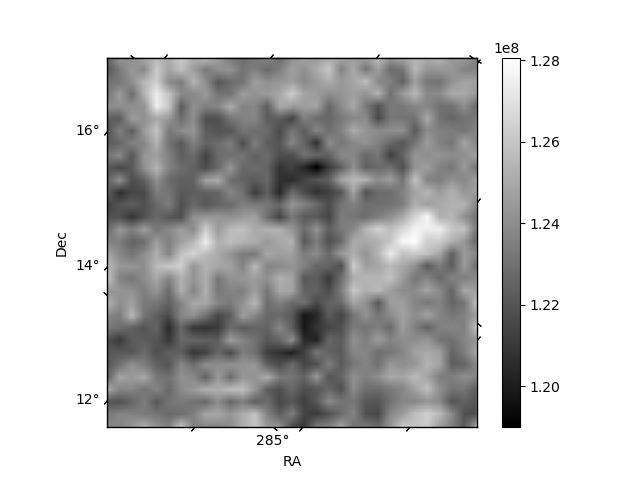
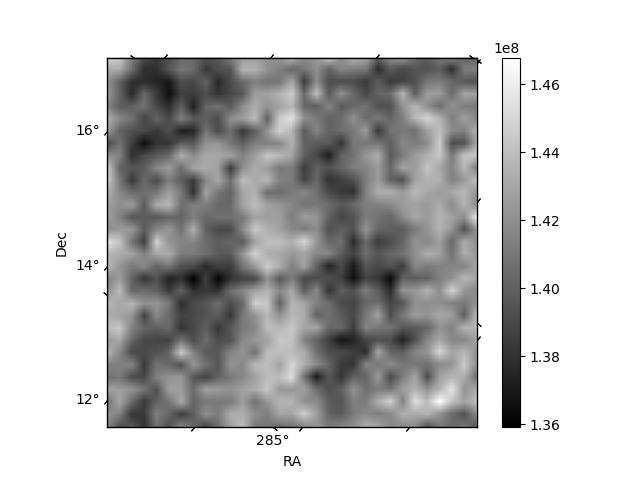
Histogram calculated using DETX and DETY for each event in the final _common_clean file
| Quadrant A | 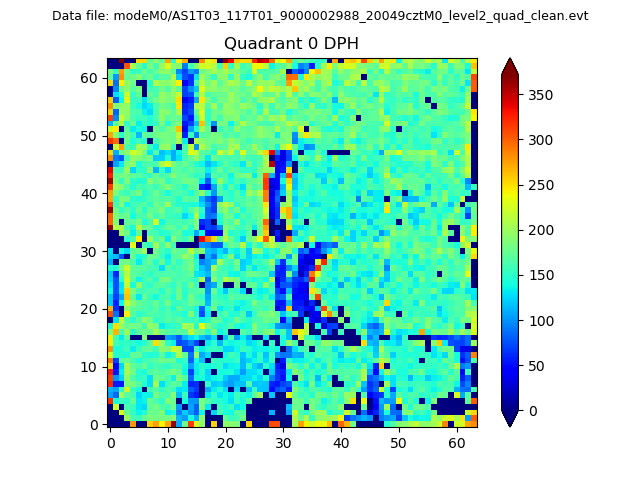 |
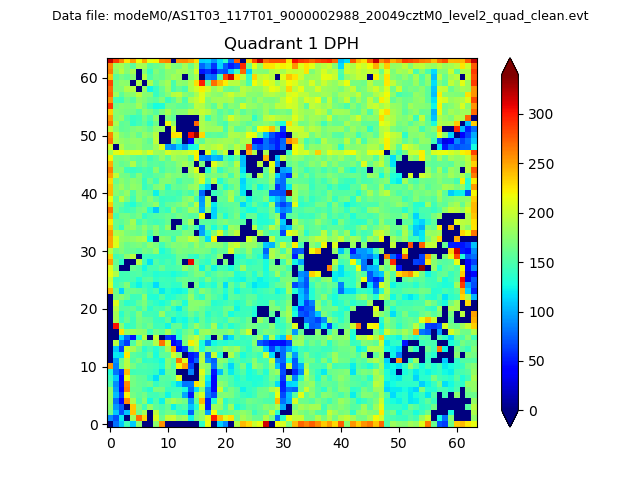 |
Quadrant B |
|---|---|---|---|
| Quadrant D | 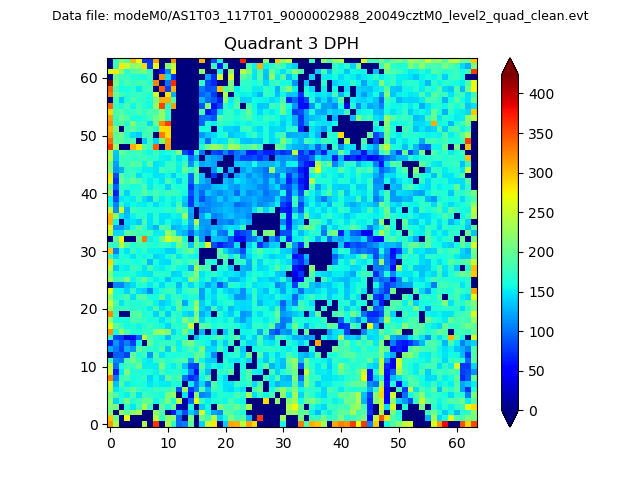 |
 |
Quadrant C |
| Plot type | Count rate plots | Images |
|---|---|---|
| Comparison with Poisson distribution Blue bars denote a histogram of data divided into 1 sec bins. Red curve is a Poisson curve with rate = median count rate of data. |
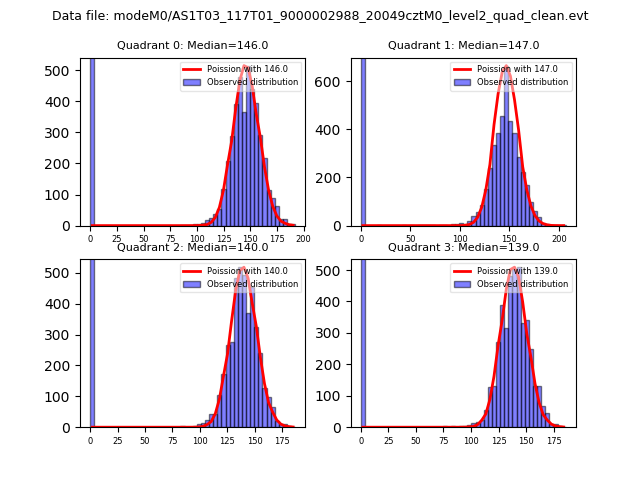 |
 |
| Quadrant-wise count rates Data is divided into 100 sec bins |
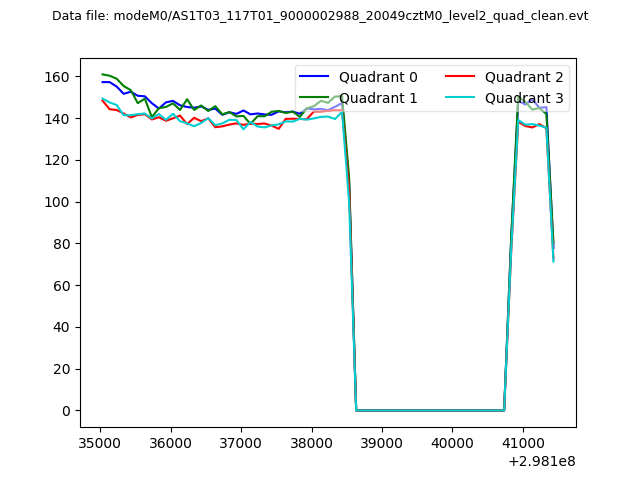 |
|
| Module-wise count rates for Quadrant A Data is divided into 100 sec bins |
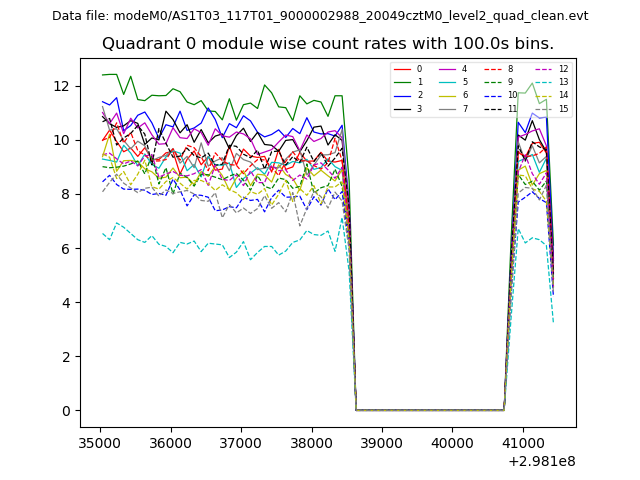 |
 |
| Module-wise count rates for Quadrant B Data is divided into 100 sec bins |
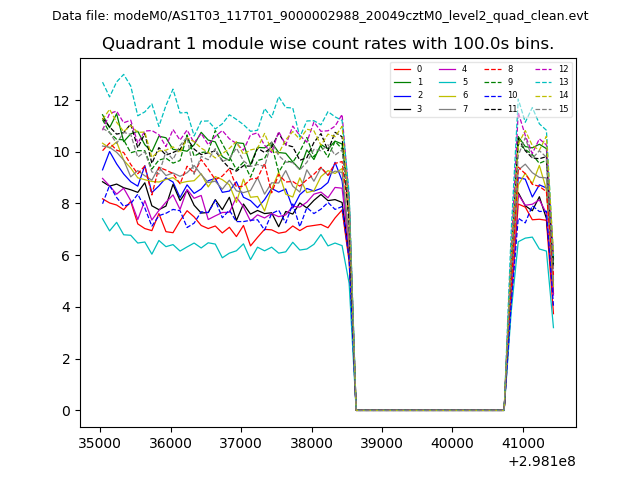 |
 |
| Module-wise count rates for Quadrant C Data is divided into 100 sec bins |
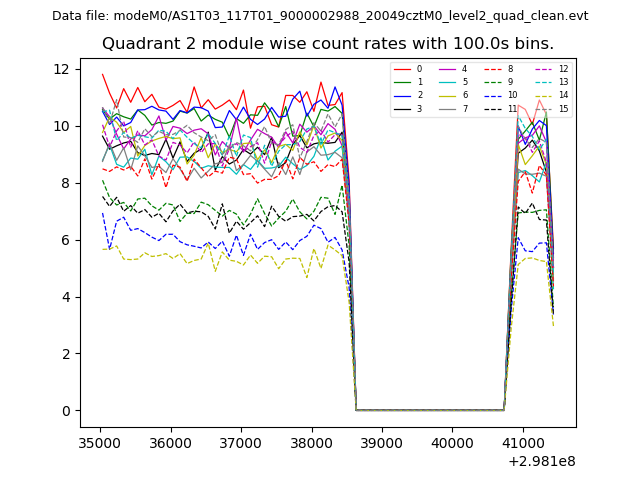 |
 |
| Module-wise count rates for Quadrant D Data is divided into 100 sec bins |
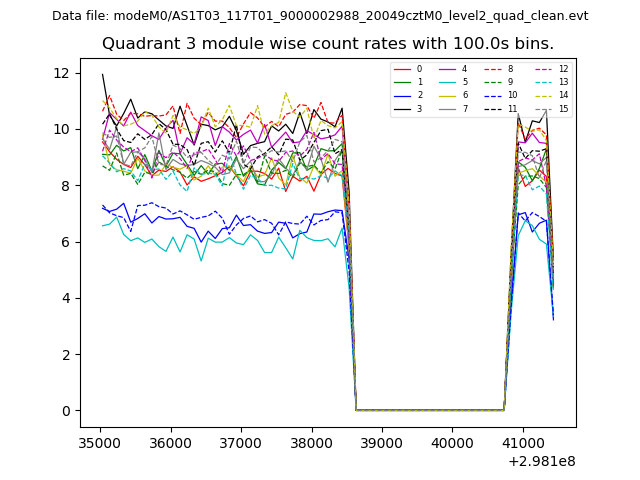 |
 |
| Parameter | Plot |
|---|---|
| CZT HV Monitor | 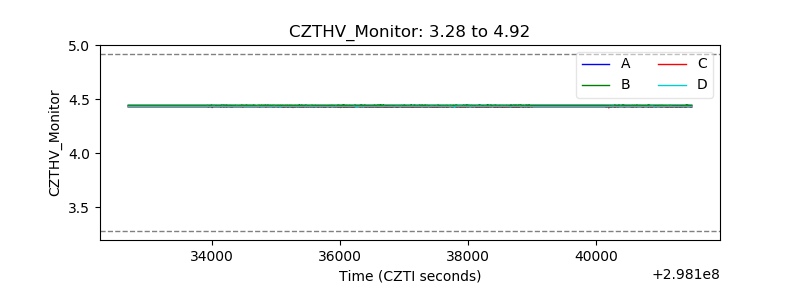 |
| D_VDD | 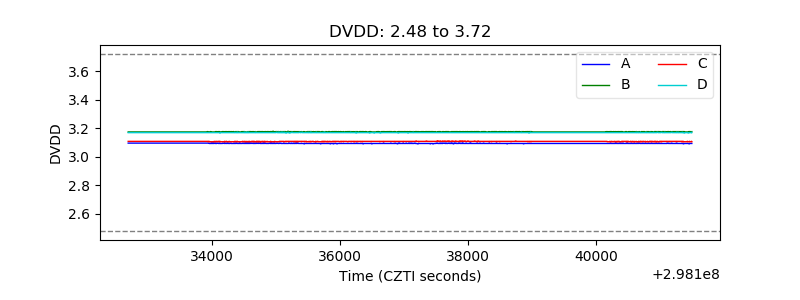 |
| Temperature 1 | 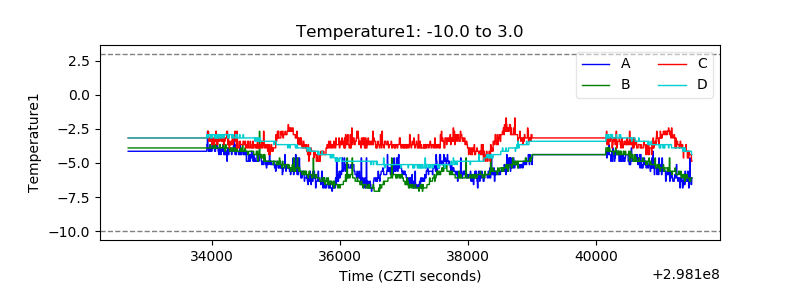 |
| Veto HV Monitor | 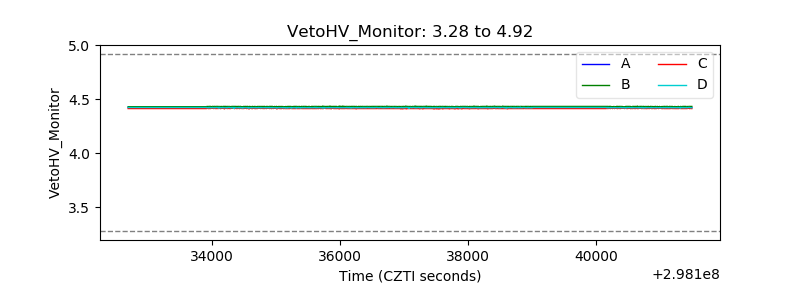 |
| Veto LLD | 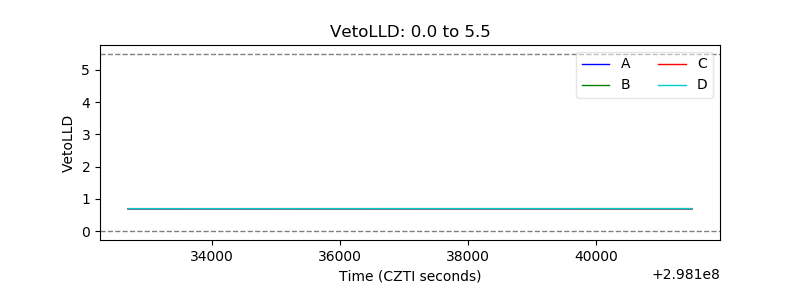 |
| Alpha Counter | 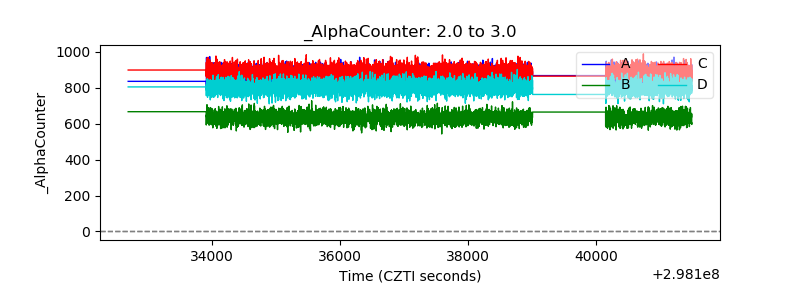 |
| _CPM_Rate | 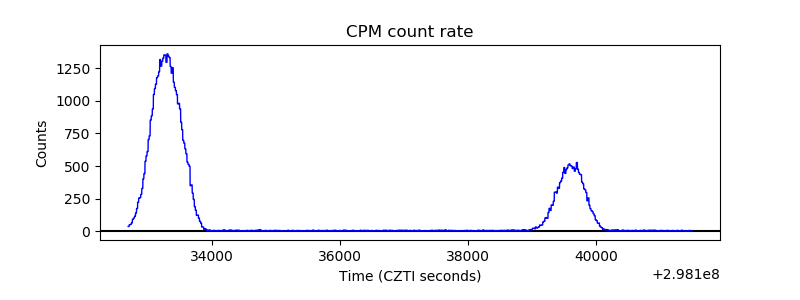 |
| CZT Counter | 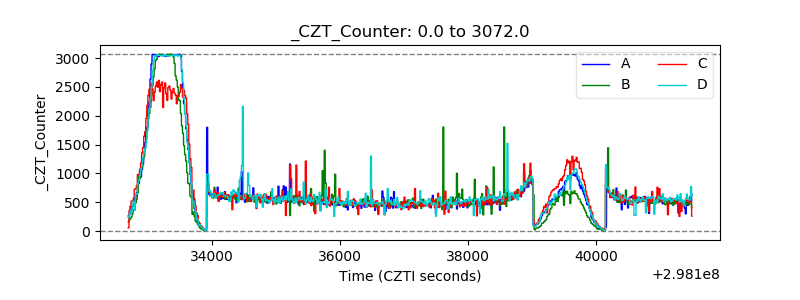 |
| +2.5 Volts monitor |  |
| +5 Volts monitor |  |
| _ROLL_ROT | 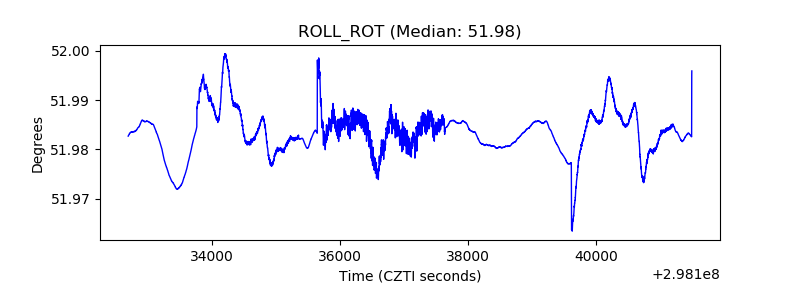 |
| _Roll_DEC | 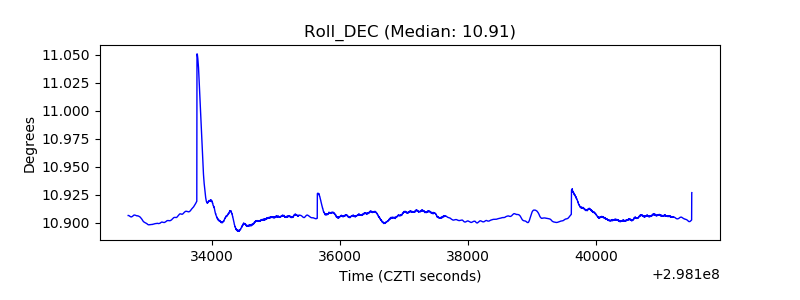 |
| _Roll_RA | 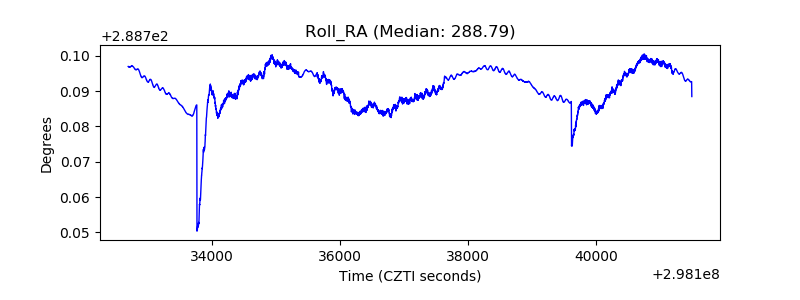 |
| Veto Counter | 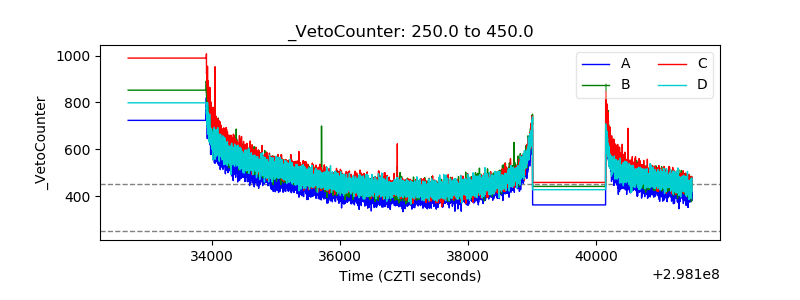 |