| Param | Original file | Final file |
|---|---|---|
| Filename | modeM0/AS1T03_117T01_9000002988_20050cztM0_level2.evt | modeM0/AS1T03_117T01_9000002988_20050cztM0_level2_quad_clean.evt |
| Size (bytes) | 576,285,120 | 99,066,240 |
| Size | 549.6 MB | 94.5 MB |
| Events in quadrant A | 3,718,616 | 643,176 |
| Events in quadrant B | 3,778,647 | 646,024 |
| Events in quadrant C | 3,739,473 | 613,681 |
| Events in quadrant D | 5,720,915 | 588,772 |
| Mode M9 | |||
|---|---|---|---|
| Quadrant | BADHDUFLAG | Total packets | Discarded packets |
| A | 0 | 18 | 0 |
| B | 0 | 18 | 0 |
| C | 0 | 18 | 0 |
| D | 0 | 18 | 0 |
| Mode M0 | |||
|---|---|---|---|
| Quadrant | BADHDUFLAG | Total packets | Discarded packets |
| A | 0 | 15532 | 2 |
| B | 0 | 15659 | 2 |
| C | 0 | 15486 | 2 |
| D | 0 | 21641 | 3 |
| Mode SS | |||
|---|---|---|---|
| Quadrant | BADHDUFLAG | Total packets | Discarded packets |
| A | 0 | 152 | 0 |
| B | 0 | 152 | 0 |
| C | 0 | 152 | 0 |
| D | 0 | 152 | 0 |
| Quadrant | Total seconds | Saturated seconds | Saturation percentage |
|---|---|---|---|
| A | 7297 | 80 | 1.096341% |
| B | 7298 | 135 | 1.849822% |
| C | 7298 | 178 | 2.439024% |
| D | 7297 | 448 | 6.139509% |
Noise dominated data is calculated using 1-second bins in cleaned event files. If a bin has >2000 counts, and if more than 50% of those come from <1% of pixels, then it is considered to be noise-dominated and hence unusable.
| Quadrant | # 1 sec bins | Bins with >0 counts | Bins with >2000 counts | High rate bins dominated by noise | Noise dominated (total time) | Noise dominated (detector-on time) | Marked lightcurve |
|---|---|---|---|---|---|---|---|
| A | 9202 | 7299 | 1 | 1 | 0.01% | 0.01% | 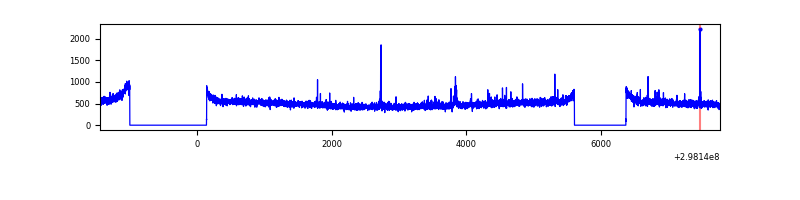 |
| B | 9203 | 7300 | 5 | 5 | 0.05% | 0.07% | 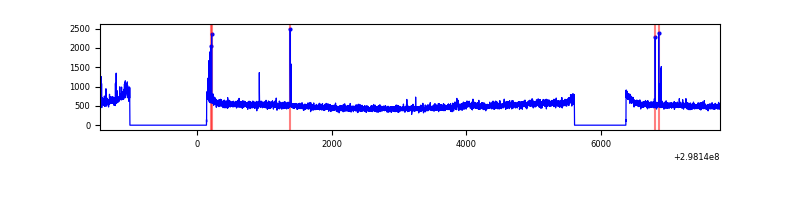 |
| C | 9203 | 7300 | 0 | 0 | 0.00% | 0.00% | 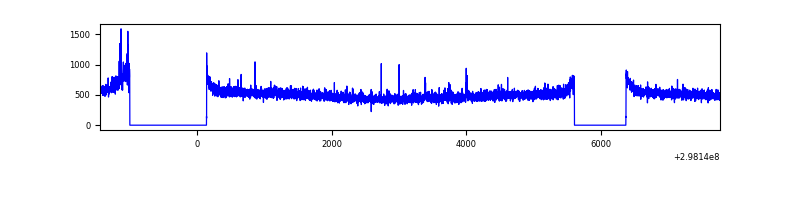 |
| D | 9202 | 7299 | 350 | 350 | 3.80% | 4.80% | 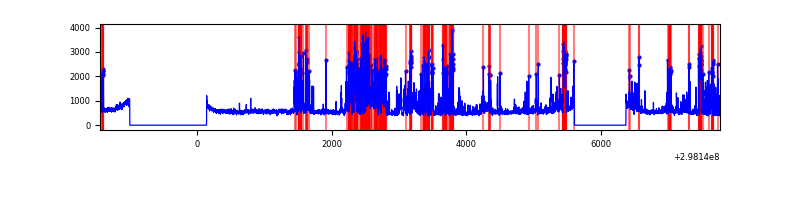 |
Top three noisy pixels from each quadrant. If the there are fewer than three noisy pixels in the level2.evt file, extra rows are filled as -1
| Pixel properties | Quadrant properties | ||||||
|---|---|---|---|---|---|---|---|
| Quadrant | DetID | PixID | Counts | Sigma | Mean | Median | Sigma |
| A | 14 | 238 | 35125 | 179.37 | 949 | 931 | 190.6 |
| A | 14 | 254 | 21657 | 108.72 | 949 | 931 | 190.6 |
| A | 11 | 29 | 12457 | 60.46 | 949 | 931 | 190.6 |
| B | 0 | 198 | 54904 | 298.19 | 940 | 918 | 181.0 |
| B | 4 | 80 | 31406 | 168.4 | 940 | 918 | 181.0 |
| B | 12 | 111 | 22385 | 118.57 | 940 | 918 | 181.0 |
| C | 14 | 238 | 141727 | 657.85 | 910 | 917 | 214.0 |
| C | 4 | 254 | 34167 | 155.34 | 910 | 917 | 214.0 |
| C | 3 | 233 | 9084 | 38.16 | 910 | 917 | 214.0 |
| D | 1 | 52 | 1881662 | 8601.22 | 908 | 885 | 218.7 |
| D | 2 | 184 | 338482 | 1543.91 | 908 | 885 | 218.7 |
| D | 15 | 145 | 38369 | 171.42 | 908 | 885 | 218.7 |
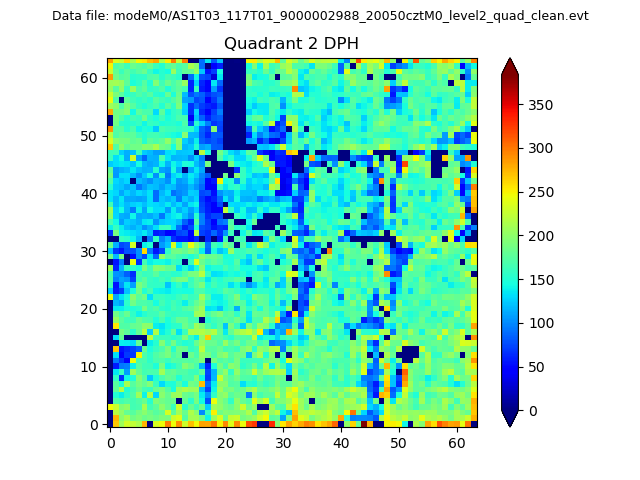
Histogram calculated using DETX and DETY for each event in the final _common_clean file
| Quadrant A | 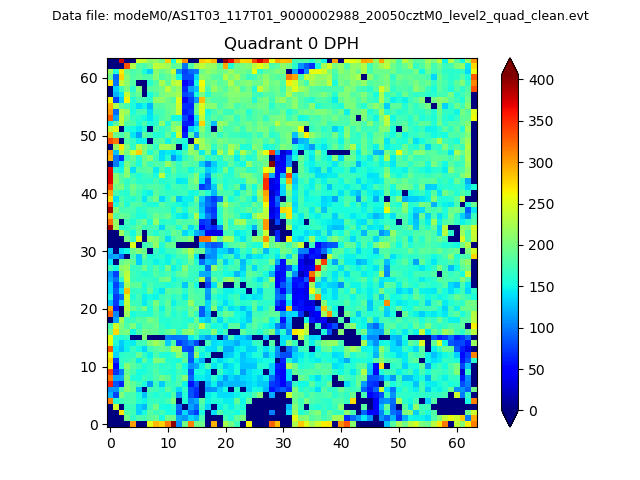 |
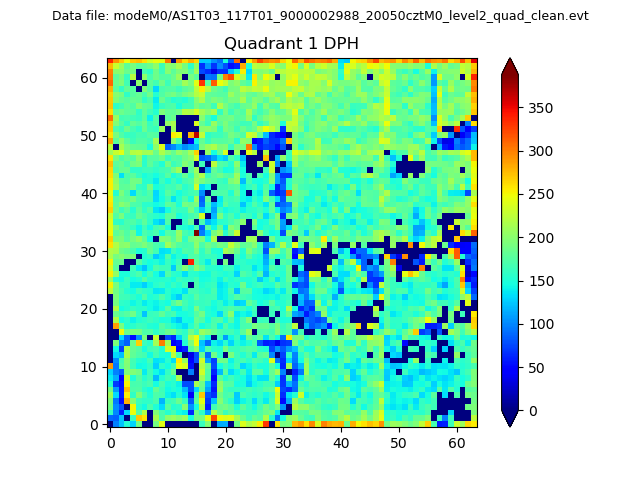 |
Quadrant B |
|---|---|---|---|
| Quadrant D | 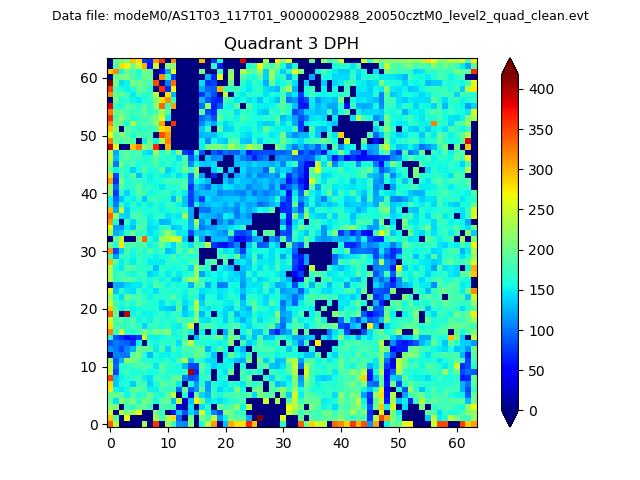 |
 |
Quadrant C |
| Plot type | Count rate plots | Images |
|---|---|---|
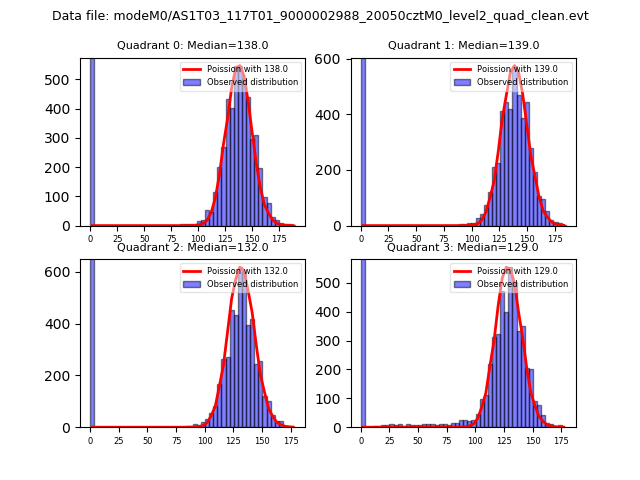
| Comparison with Poisson distribution Blue bars denote a histogram of data divided into 1 sec bins. Red curve is a Poisson curve with rate = median count rate of data. |
 |
 |
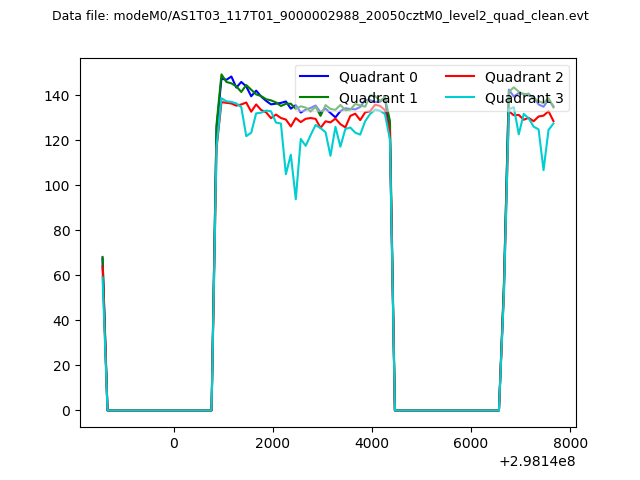
| Quadrant-wise count rates Data is divided into 100 sec bins |
 |
|
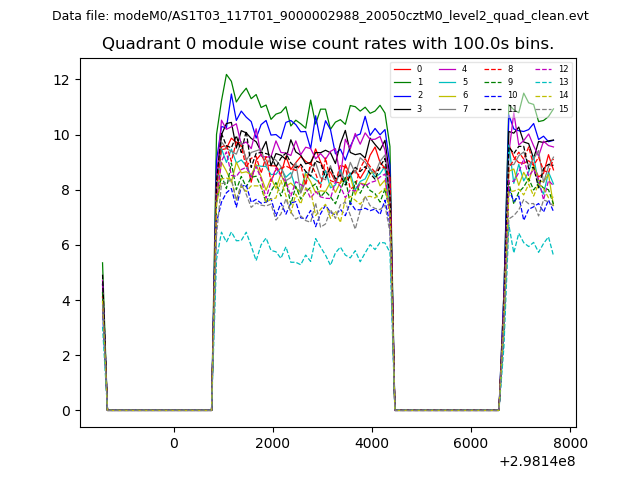
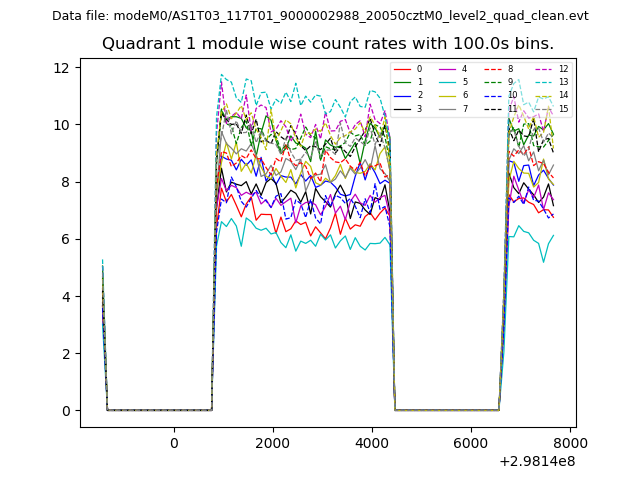
| Module-wise count rates for Quadrant A Data is divided into 100 sec bins |
 |
 |
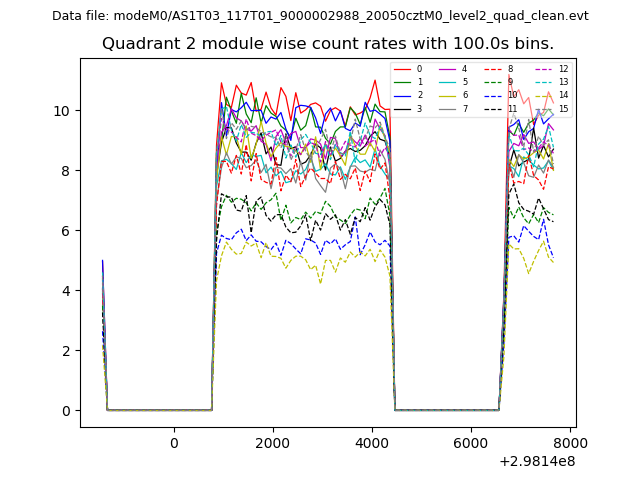
| Module-wise count rates for Quadrant B Data is divided into 100 sec bins |
 |
 |
| Module-wise count rates for Quadrant C Data is divided into 100 sec bins |
 |
 |
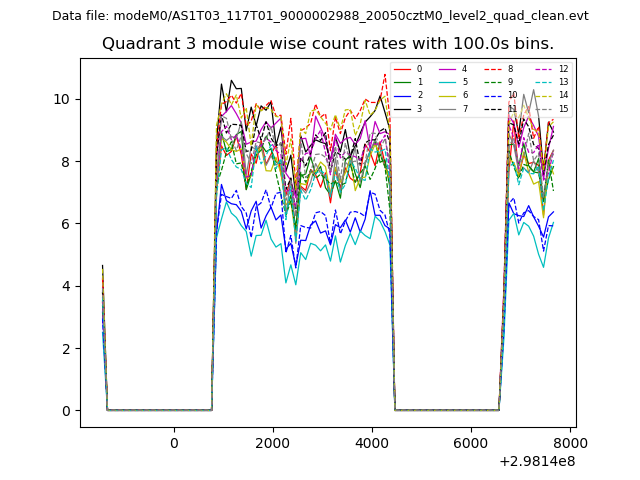
| Module-wise count rates for Quadrant D Data is divided into 100 sec bins |
 |
 |
| Parameter | Plot |
|---|---|
| CZT HV Monitor | 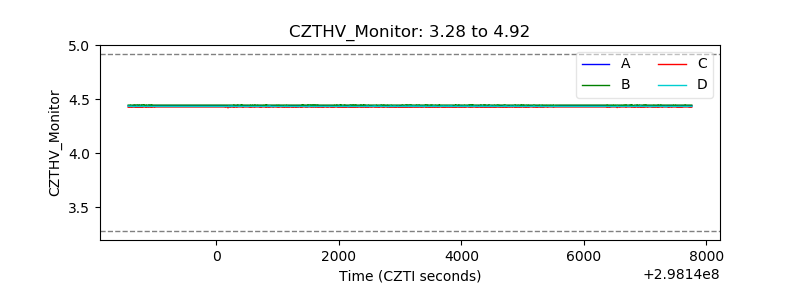 |
| D_VDD |  |
| Temperature 1 | 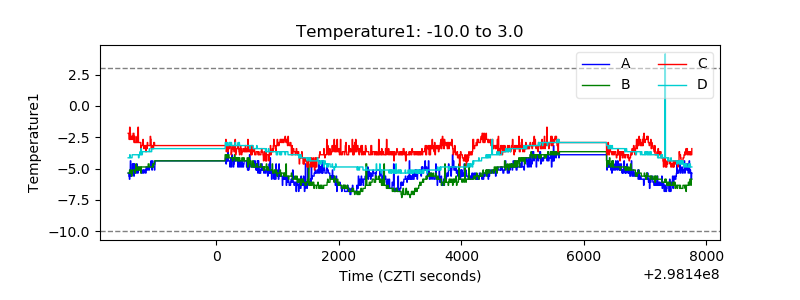 |
| Veto HV Monitor | 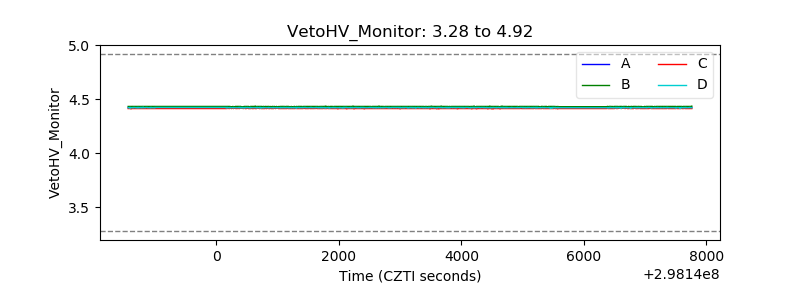 |
| Veto LLD | 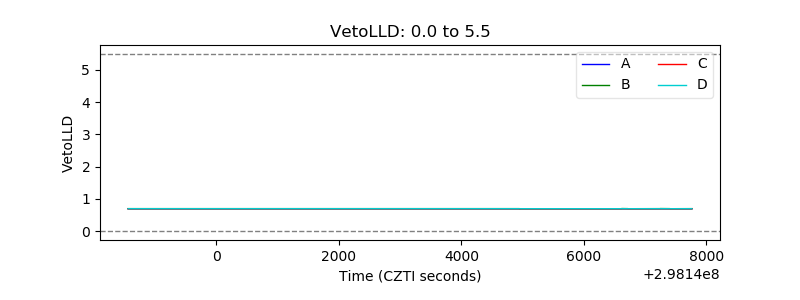 |
| Alpha Counter | 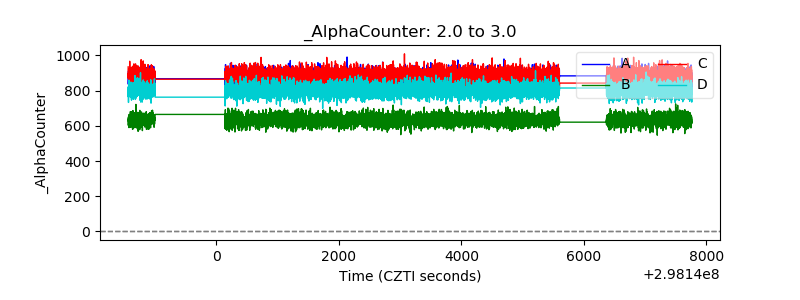 |
| _CPM_Rate | 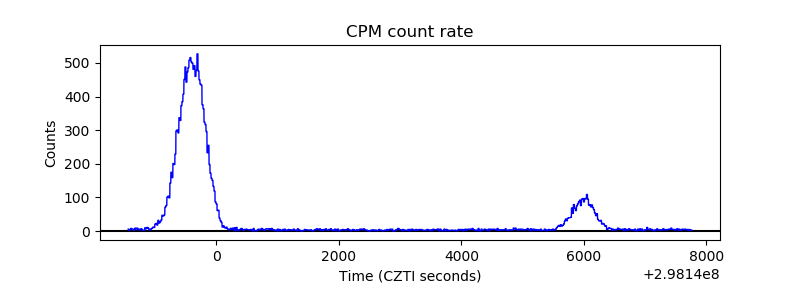 |
| CZT Counter | 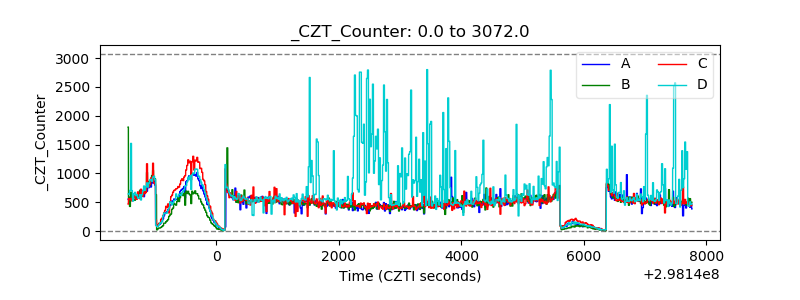 |
| +2.5 Volts monitor |  |
| +5 Volts monitor |  |
| _ROLL_ROT | 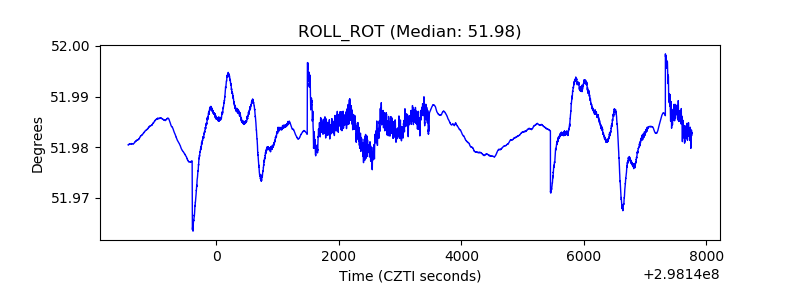 |
| _Roll_DEC |  |
| _Roll_RA | 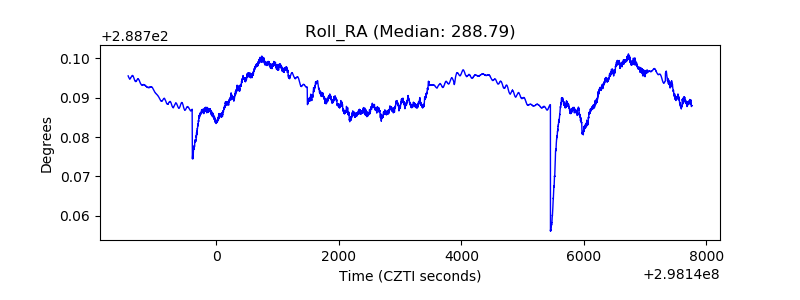 |
| Veto Counter | 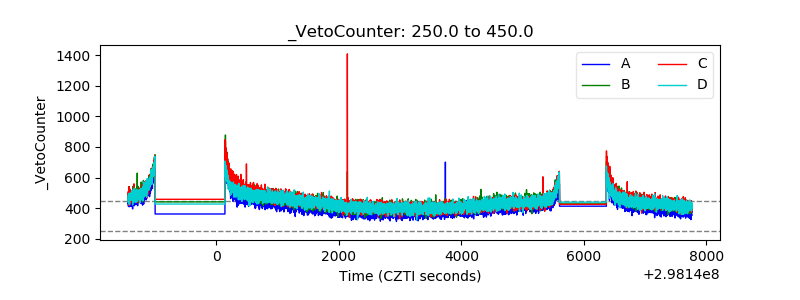 |