| Param | Original file | Final file |
|---|---|---|
| Filename | modeM0/AS1T03_117T01_9000002988_20051cztM0_level2.evt | modeM0/AS1T03_117T01_9000002988_20051cztM0_level2_quad_clean.evt |
| Size (bytes) | 511,744,320 | 103,115,520 |
| Size | 488.0 MB | 98.3 MB |
| Events in quadrant A | 3,565,750 | 672,644 |
| Events in quadrant B | 3,591,005 | 673,697 |
| Events in quadrant C | 3,554,842 | 642,075 |
| Events in quadrant D | 4,294,871 | 630,237 |
| Mode M9 | |||
|---|---|---|---|
| Quadrant | BADHDUFLAG | Total packets | Discarded packets |
| A | 0 | 3 | 0 |
| B | 0 | 3 | 0 |
| C | 0 | 3 | 0 |
| D | 0 | 3 | 0 |
| Mode M0 | |||
|---|---|---|---|
| Quadrant | BADHDUFLAG | Total packets | Discarded packets |
| A | 0 | 15143 | 1 |
| B | 0 | 15196 | 1 |
| C | 0 | 15016 | 2 |
| D | 0 | 17498 | 1 |
| Mode SS | |||
|---|---|---|---|
| Quadrant | BADHDUFLAG | Total packets | Discarded packets |
| A | 0 | 148 | 0 |
| B | 0 | 148 | 0 |
| C | 0 | 148 | 0 |
| D | 0 | 148 | 0 |
| Quadrant | Total seconds | Saturated seconds | Saturation percentage |
|---|---|---|---|
| A | 7237 | 65 | 0.898162% |
| B | 7238 | 99 | 1.367781% |
| C | 7237 | 118 | 1.630510% |
| D | 7237 | 151 | 2.086500% |
Noise dominated data is calculated using 1-second bins in cleaned event files. If a bin has >2000 counts, and if more than 50% of those come from <1% of pixels, then it is considered to be noise-dominated and hence unusable.
| Quadrant | # 1 sec bins | Bins with >0 counts | Bins with >2000 counts | High rate bins dominated by noise | Noise dominated (total time) | Noise dominated (detector-on time) | Marked lightcurve |
|---|---|---|---|---|---|---|---|
| A | 7537 | 7238 | 4 | 4 | 0.05% | 0.06% | 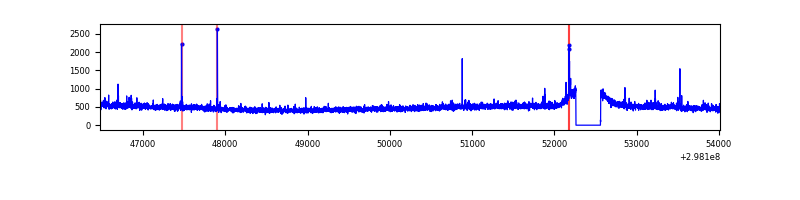 |
| B | 7538 | 7239 | 8 | 8 | 0.11% | 0.11% | 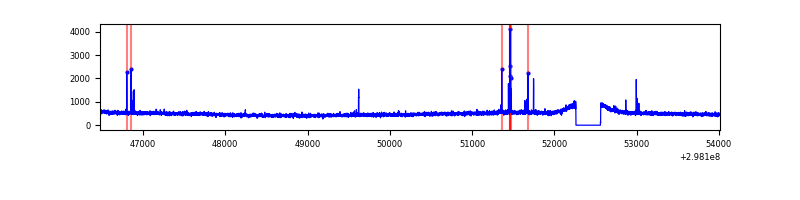 |
| C | 7537 | 7238 | 0 | 0 | 0.00% | 0.00% | 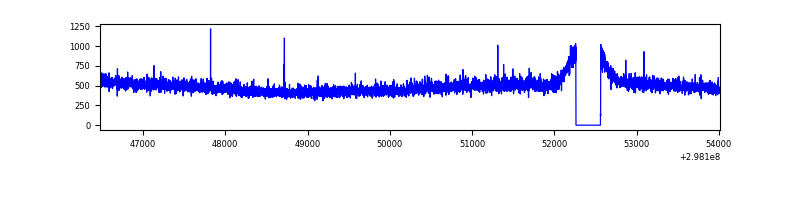 |
| D | 7537 | 7238 | 81 | 81 | 1.07% | 1.12% | 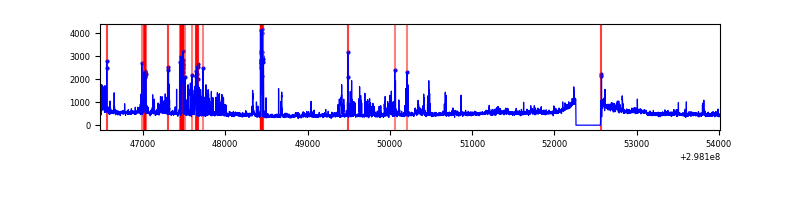 |
Top three noisy pixels from each quadrant. If the there are fewer than three noisy pixels in the level2.evt file, extra rows are filled as -1
| Pixel properties | Quadrant properties | ||||||
|---|---|---|---|---|---|---|---|
| Quadrant | DetID | PixID | Counts | Sigma | Mean | Median | Sigma |
| A | 14 | 254 | 30143 | 159.8 | 908 | 890 | 183.1 |
| A | 14 | 238 | 28009 | 148.14 | 908 | 890 | 183.1 |
| A | 11 | 29 | 13933 | 71.25 | 908 | 890 | 183.1 |
| B | 4 | 80 | 30965 | 171.86 | 900 | 878 | 175.1 |
| B | 12 | 111 | 21689 | 118.88 | 900 | 878 | 175.1 |
| B | 0 | 182 | 19543 | 106.62 | 900 | 878 | 175.1 |
| C | 14 | 238 | 133731 | 644.85 | 873 | 881 | 206.0 |
| C | 3 | 233 | 8133 | 35.2 | 873 | 881 | 206.0 |
| C | 13 | 61 | 5985 | 24.77 | 873 | 881 | 206.0 |
| D | 1 | 52 | 761443 | 3562.74 | 881 | 855 | 213.5 |
| D | 2 | 184 | 172170 | 802.47 | 881 | 855 | 213.5 |
| D | 15 | 145 | 36737 | 168.08 | 881 | 855 | 213.5 |
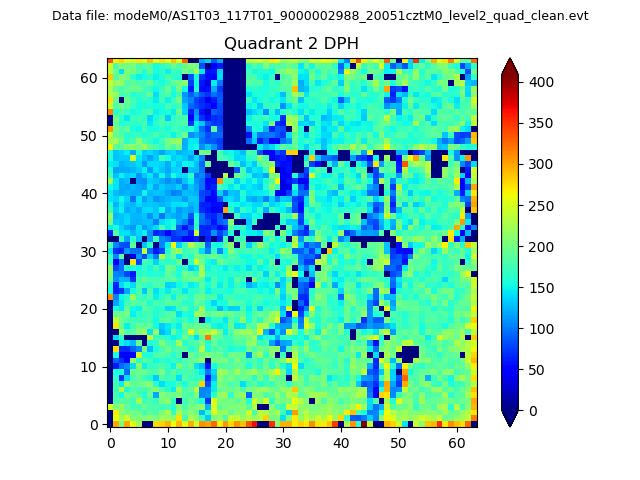
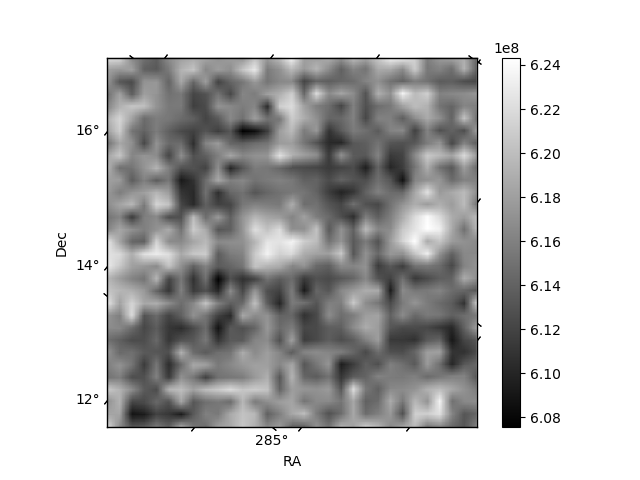
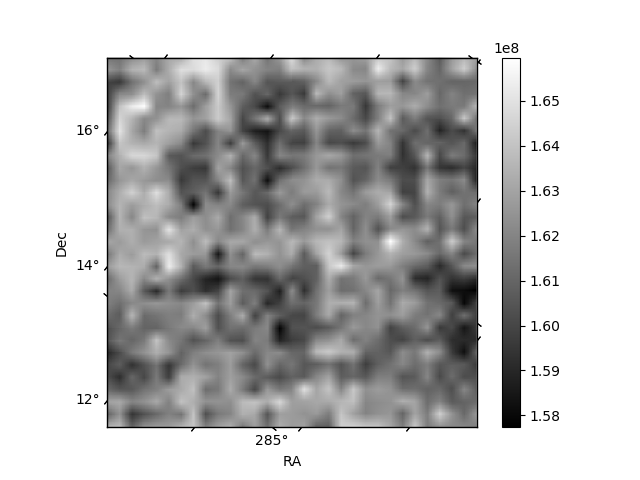
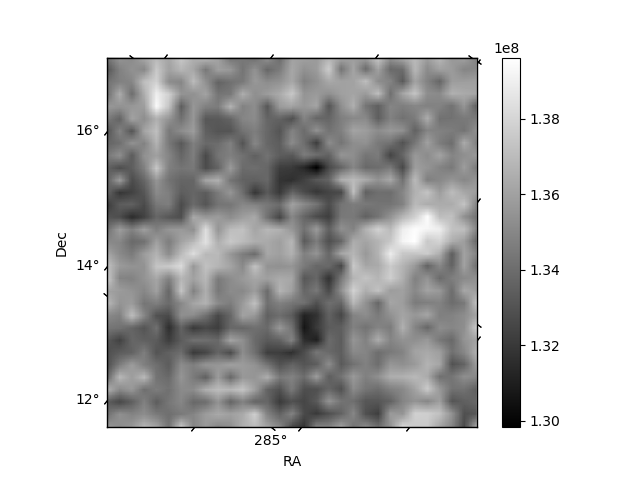
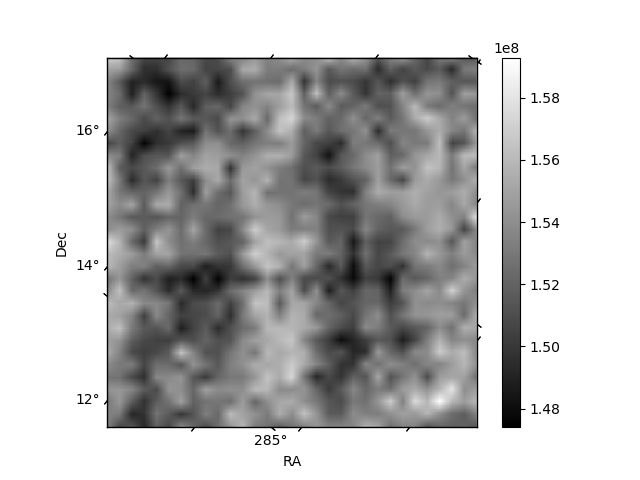
Histogram calculated using DETX and DETY for each event in the final _common_clean file
| Quadrant A | 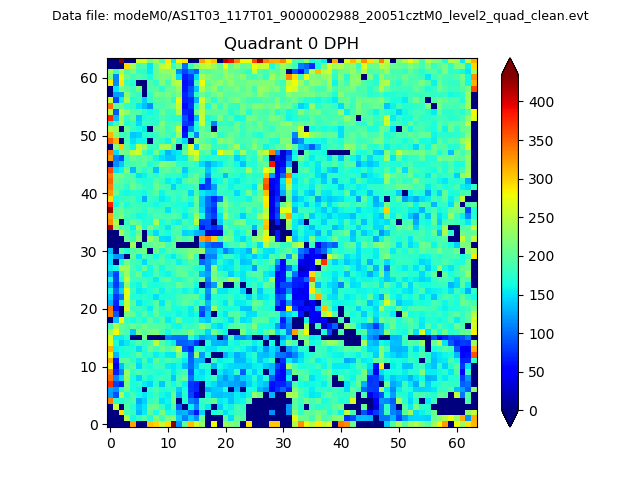 |
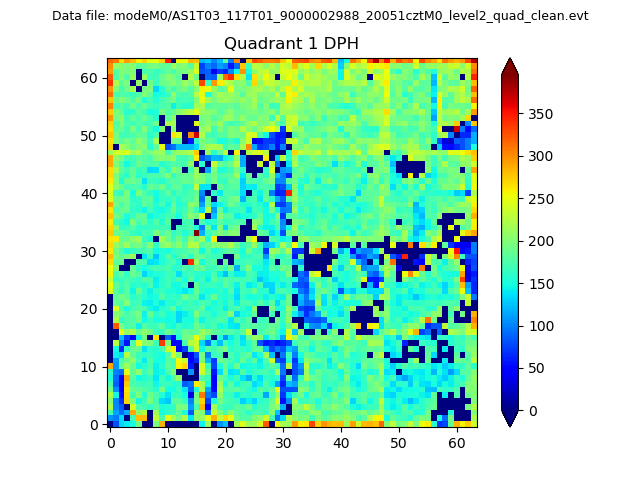 |
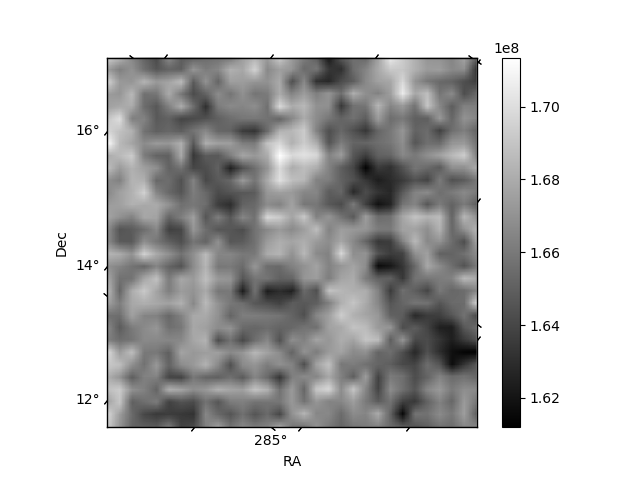
Quadrant B |
|---|---|---|---|
| Quadrant D | 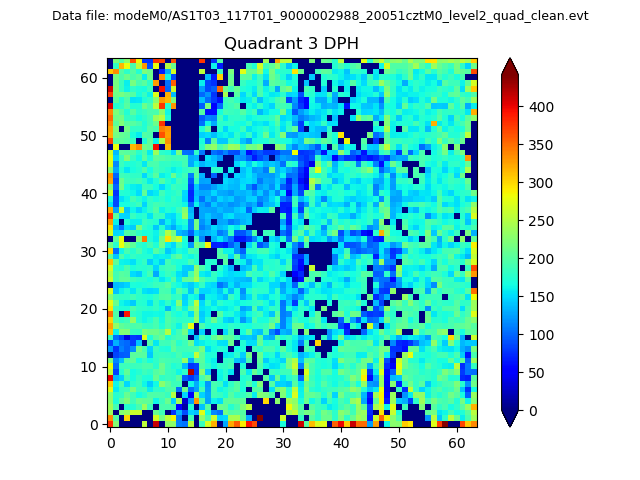 |
 |
Quadrant C |
| Plot type | Count rate plots | Images |
|---|---|---|
| Comparison with Poisson distribution Blue bars denote a histogram of data divided into 1 sec bins. Red curve is a Poisson curve with rate = median count rate of data. |
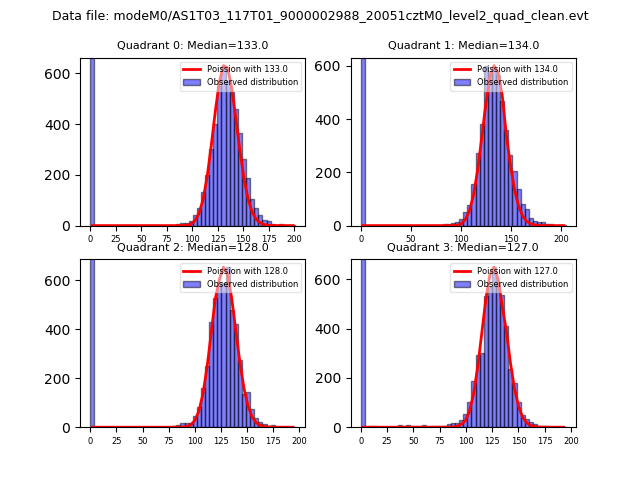 |
 |
| Quadrant-wise count rates Data is divided into 100 sec bins |
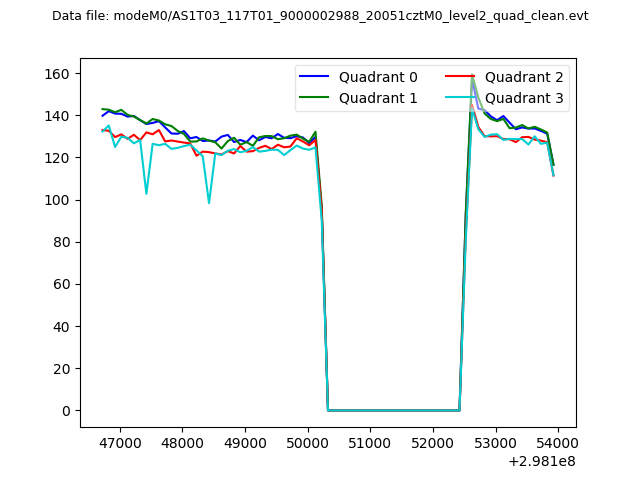 |
|
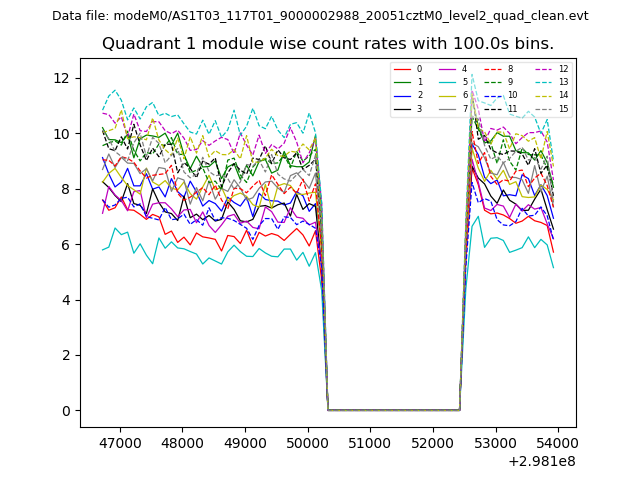
| Module-wise count rates for Quadrant A Data is divided into 100 sec bins |
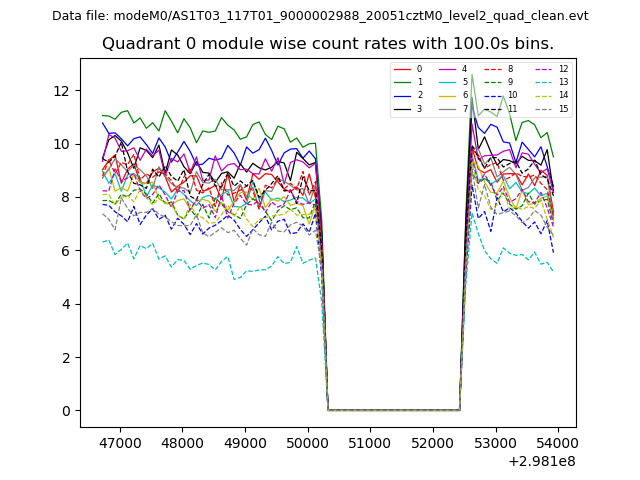 |
 |
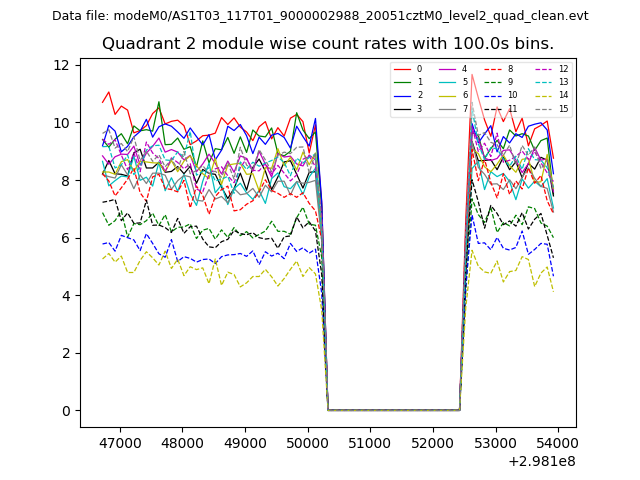
| Module-wise count rates for Quadrant B Data is divided into 100 sec bins |
 |
 |
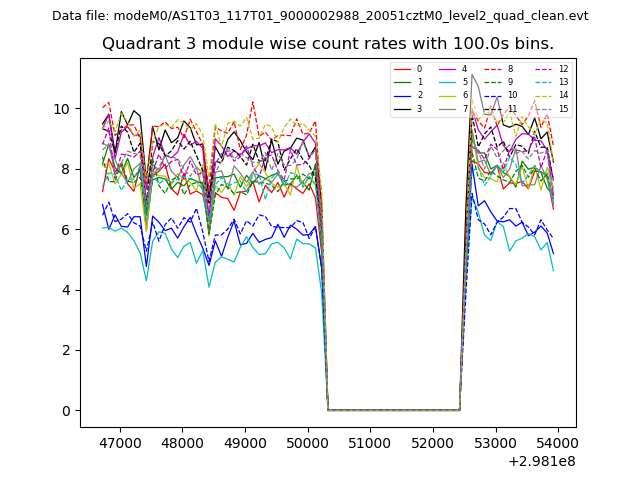
| Module-wise count rates for Quadrant C Data is divided into 100 sec bins |
 |
 |
| Module-wise count rates for Quadrant D Data is divided into 100 sec bins |
 |
 |
| Parameter | Plot |
|---|---|
| CZT HV Monitor | 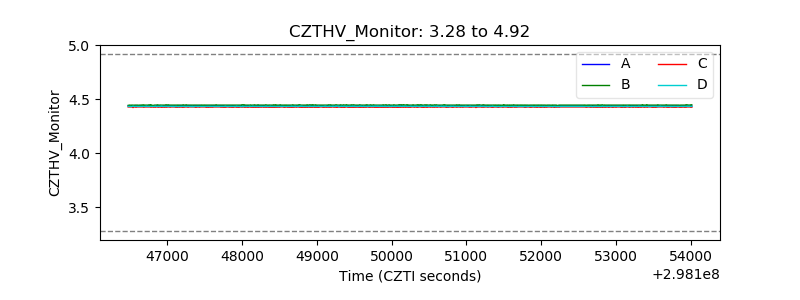 |
| D_VDD | 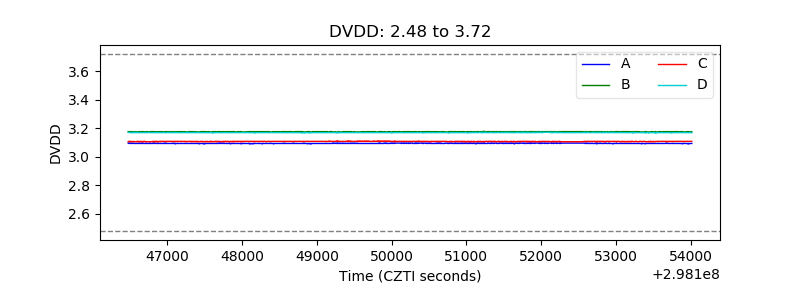 |
| Temperature 1 | 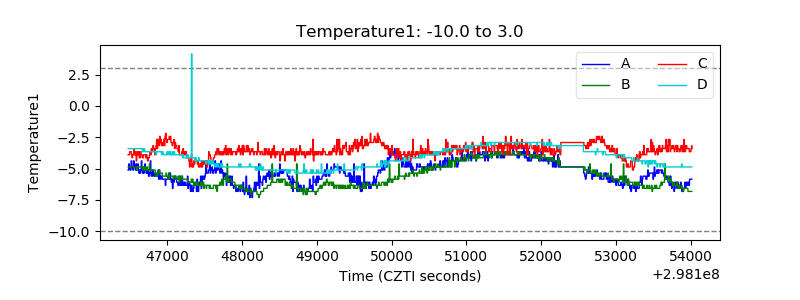 |
| Veto HV Monitor | 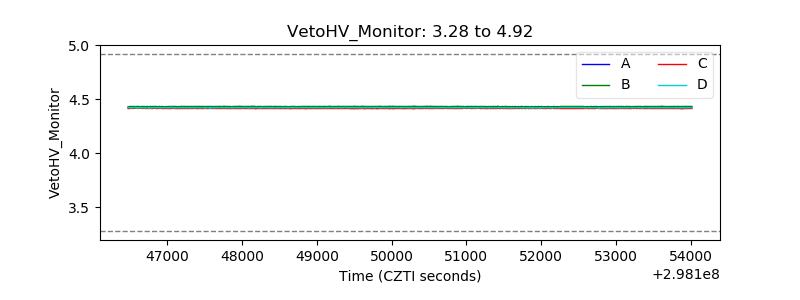 |
| Veto LLD | 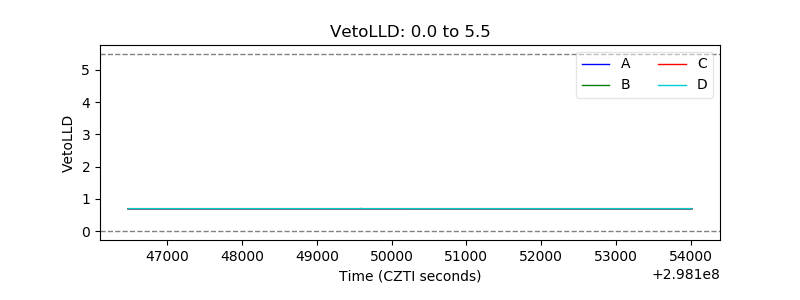 |
| Alpha Counter | 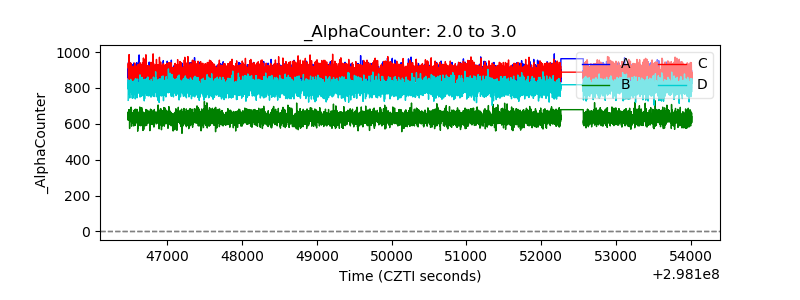 |
| _CPM_Rate | 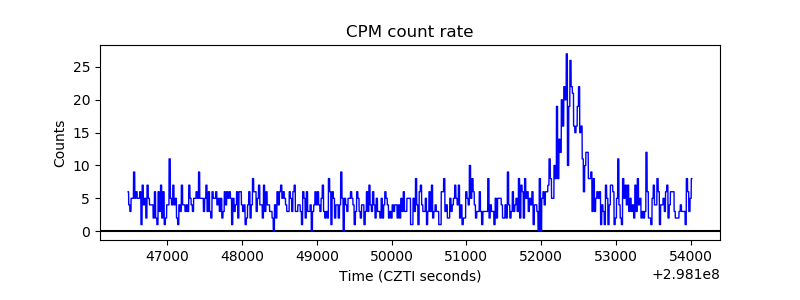 |
| CZT Counter | 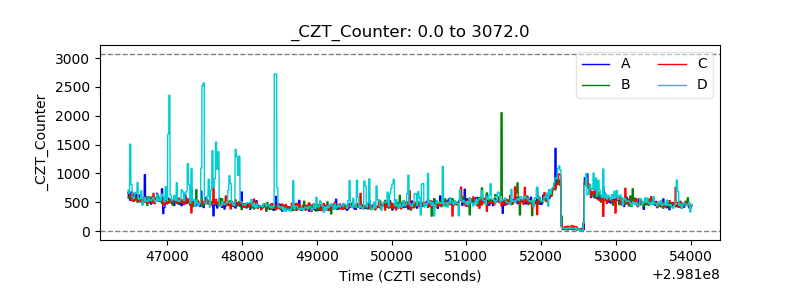 |
| +2.5 Volts monitor |  |
| +5 Volts monitor | 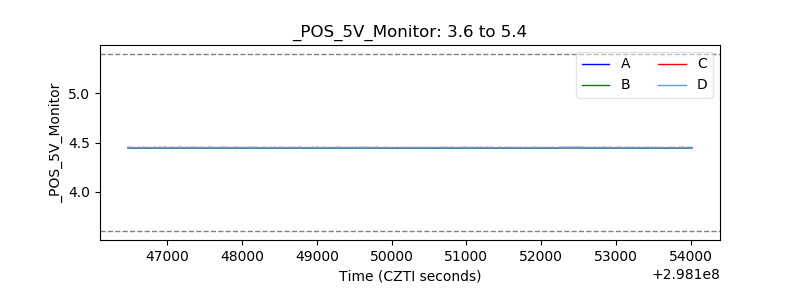 |
| _ROLL_ROT | 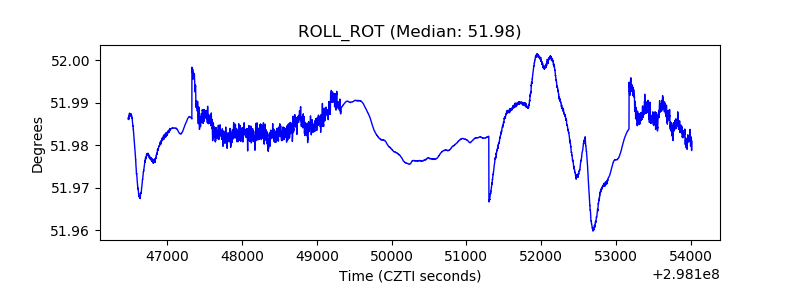 |
| _Roll_DEC | 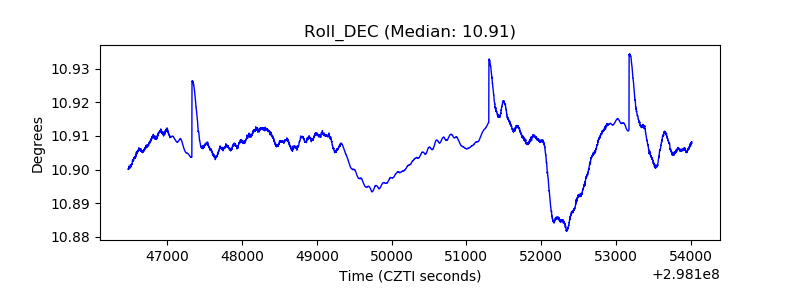 |
| _Roll_RA | 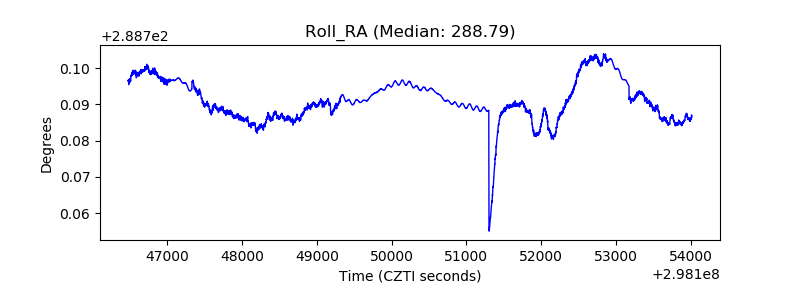 |
| Veto Counter | 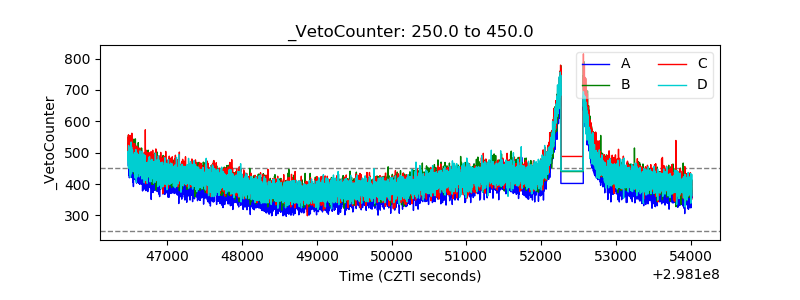 |