| Param | Original file | Final file |
|---|---|---|
| Filename | modeM0/AS1T03_117T01_9000002988_20052cztM0_level2.evt | modeM0/AS1T03_117T01_9000002988_20052cztM0_level2_quad_clean.evt |
| Size (bytes) | 580,020,480 | 113,616,000 |
| Size | 553.2 MB | 108.4 MB |
| Events in quadrant A | 4,498,646 | 734,420 |
| Events in quadrant B | 4,107,328 | 737,790 |
| Events in quadrant C | 4,102,020 | 702,710 |
| Events in quadrant D | 4,307,669 | 702,280 |
| Mode M9 | |||
|---|---|---|---|
| Quadrant | BADHDUFLAG | Total packets | Discarded packets |
| A | 0 | 4 | 0 |
| B | 0 | 4 | 0 |
| C | 0 | 4 | 0 |
| D | 0 | 4 | 0 |
| Mode M0 | |||
|---|---|---|---|
| Quadrant | BADHDUFLAG | Total packets | Discarded packets |
| A | 0 | 18659 | 2 |
| B | 0 | 17438 | 2 |
| C | 0 | 17323 | 2 |
| D | 0 | 18457 | 2 |
| Mode SS | |||
|---|---|---|---|
| Quadrant | BADHDUFLAG | Total packets | Discarded packets |
| A | 0 | 166 | 0 |
| B | 0 | 166 | 0 |
| C | 0 | 166 | 0 |
| D | 0 | 166 | 0 |
| Quadrant | Total seconds | Saturated seconds | Saturation percentage |
|---|---|---|---|
| A | 8109 | 280 | 3.452954% |
| B | 8110 | 236 | 2.909988% |
| C | 8109 | 279 | 3.440622% |
| D | 8109 | 198 | 2.441731% |
Noise dominated data is calculated using 1-second bins in cleaned event files. If a bin has >2000 counts, and if more than 50% of those come from <1% of pixels, then it is considered to be noise-dominated and hence unusable.
| Quadrant | # 1 sec bins | Bins with >0 counts | Bins with >2000 counts | High rate bins dominated by noise | Noise dominated (total time) | Noise dominated (detector-on time) | Marked lightcurve |
|---|---|---|---|---|---|---|---|
| A | 8524 | 8111 | 78 | 78 | 0.92% | 0.96% | 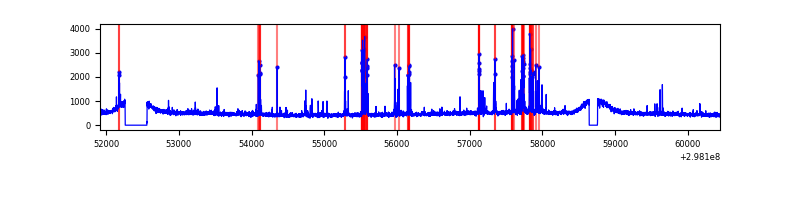 |
| B | 8525 | 8112 | 5 | 5 | 0.06% | 0.06% | 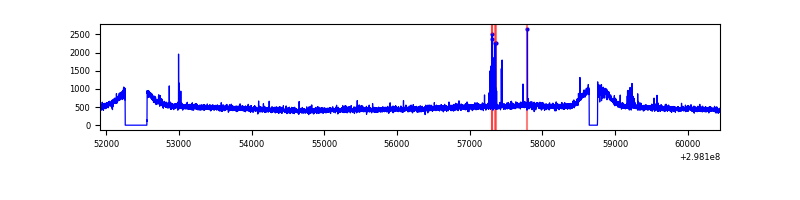 |
| C | 8524 | 8111 | 2 | 2 | 0.02% | 0.02% | 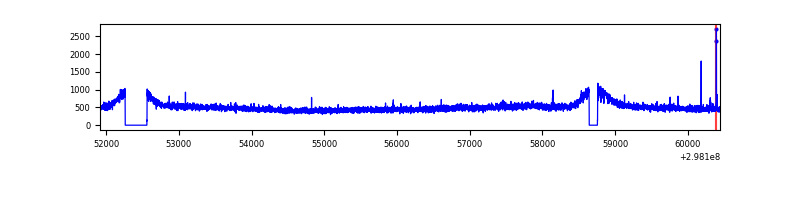 |
| D | 8524 | 8111 | 68 | 68 | 0.80% | 0.84% | 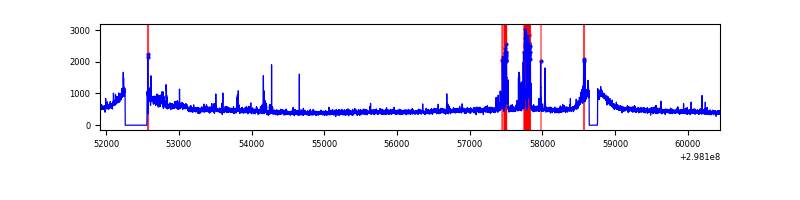 |
Top three noisy pixels from each quadrant. If the there are fewer than three noisy pixels in the level2.evt file, extra rows are filled as -1
| Pixel properties | Quadrant properties | ||||||
|---|---|---|---|---|---|---|---|
| Quadrant | DetID | PixID | Counts | Sigma | Mean | Median | Sigma |
| A | 14 | 254 | 305759 | 1444.19 | 1037 | 1014 | 211.0 |
| A | 14 | 238 | 191142 | 901.02 | 1037 | 1014 | 211.0 |
| A | 11 | 29 | 12283 | 53.4 | 1037 | 1014 | 211.0 |
| B | 4 | 80 | 39268 | 188.96 | 1033 | 1007 | 202.5 |
| B | 12 | 111 | 25243 | 119.69 | 1033 | 1007 | 202.5 |
| B | 11 | 111 | 22464 | 105.97 | 1033 | 1007 | 202.5 |
| C | 14 | 238 | 155981 | 651.43 | 1001 | 1006 | 237.9 |
| C | 4 | 254 | 26306 | 106.35 | 1001 | 1006 | 237.9 |
| C | 3 | 233 | 11378 | 43.6 | 1001 | 1006 | 237.9 |
| D | 15 | 145 | 283537 | 1136.64 | 1016 | 988 | 248.6 |
| D | 1 | 52 | 132277 | 528.15 | 1016 | 988 | 248.6 |
| D | 2 | 184 | 65477 | 259.43 | 1016 | 988 | 248.6 |
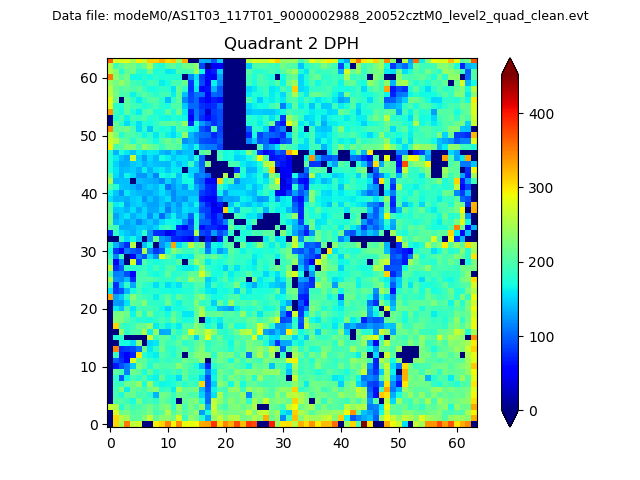
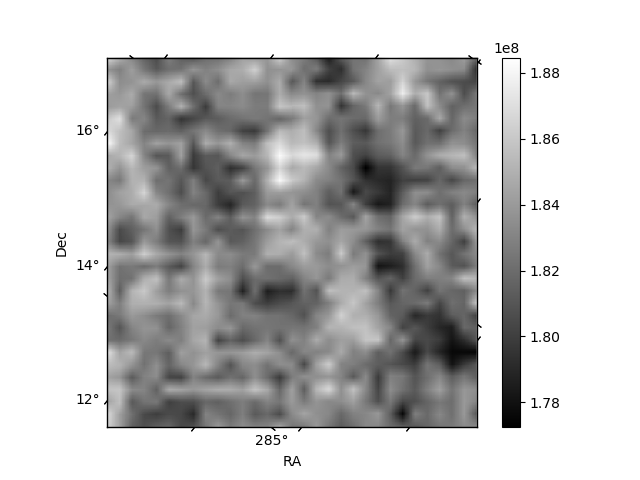
Histogram calculated using DETX and DETY for each event in the final _common_clean file
| Quadrant A | 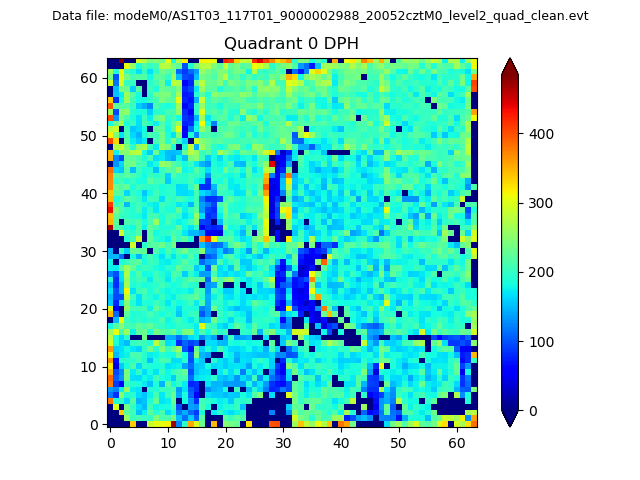 |
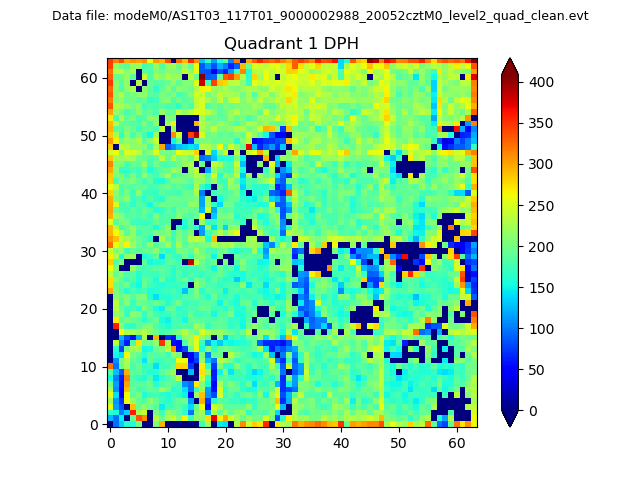 |
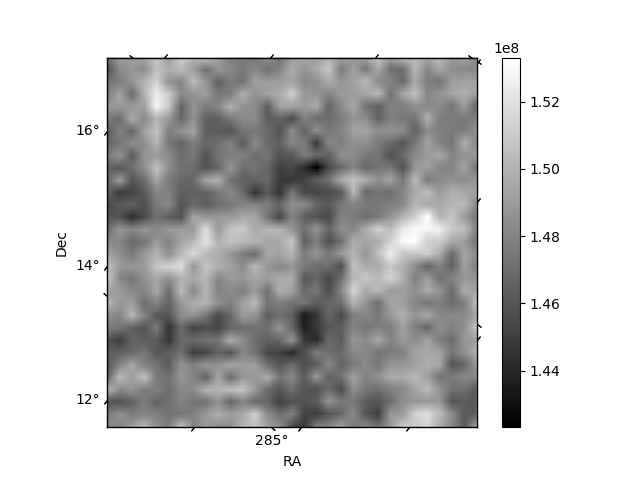
Quadrant B |
|---|---|---|---|
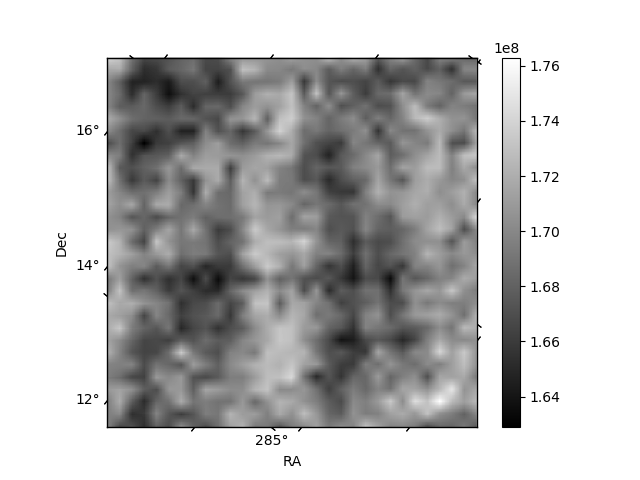
| Quadrant D | 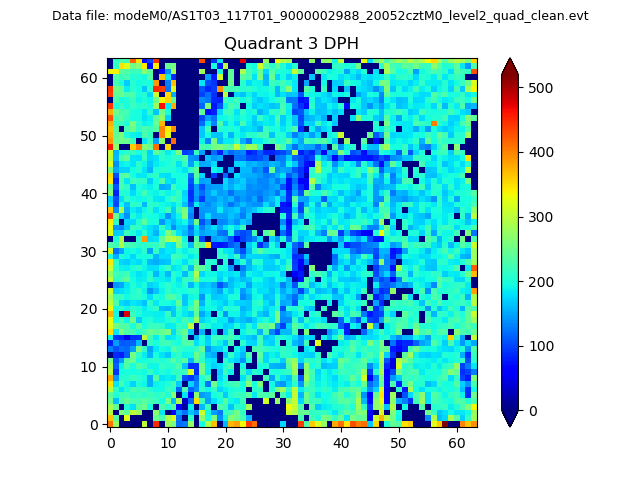 |
 |
Quadrant C |
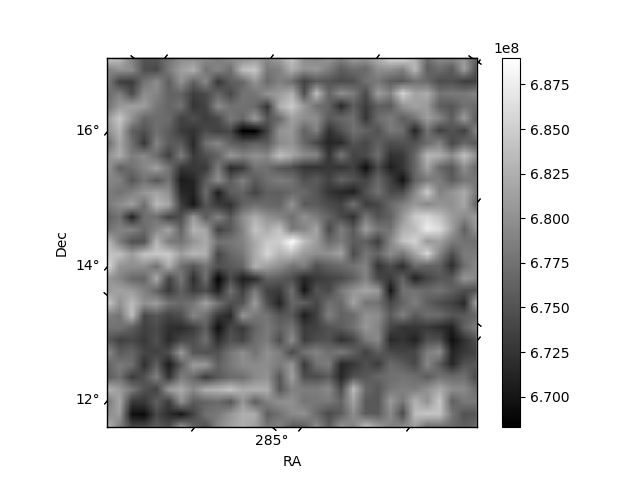
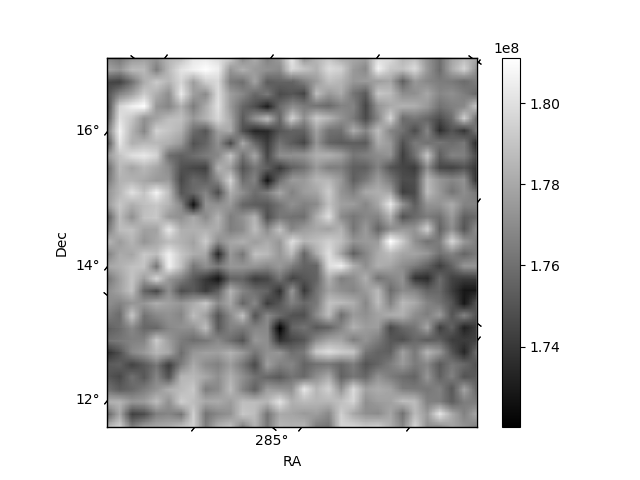
| Plot type | Count rate plots | Images |
|---|---|---|
| Comparison with Poisson distribution Blue bars denote a histogram of data divided into 1 sec bins. Red curve is a Poisson curve with rate = median count rate of data. |
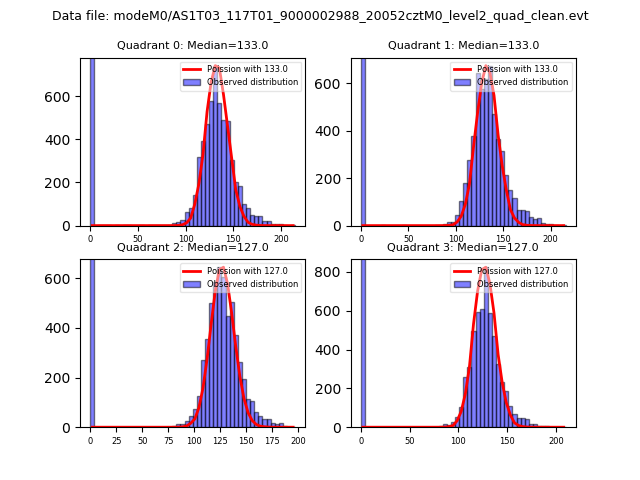 |
 |
| Quadrant-wise count rates Data is divided into 100 sec bins |
 |
|
| Module-wise count rates for Quadrant A Data is divided into 100 sec bins |
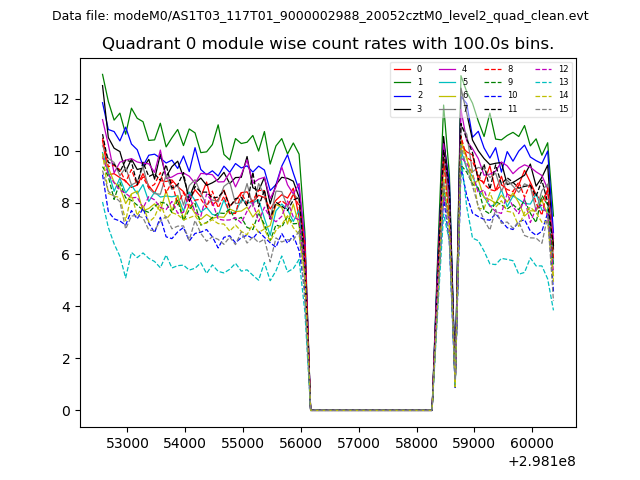 |
 |
| Module-wise count rates for Quadrant B Data is divided into 100 sec bins |
 |
 |
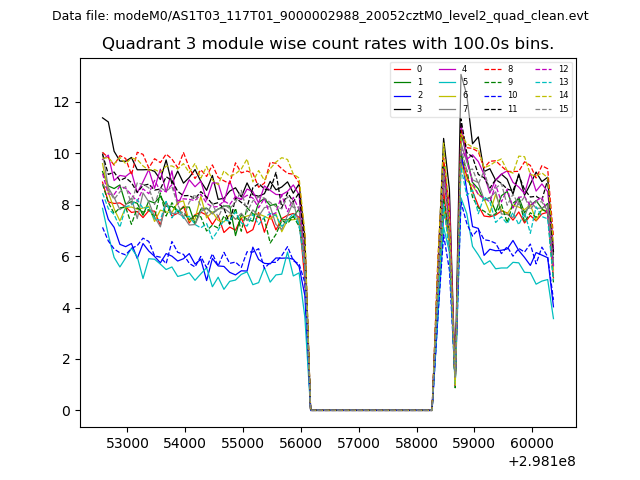
| Module-wise count rates for Quadrant C Data is divided into 100 sec bins |
 |
 |
| Module-wise count rates for Quadrant D Data is divided into 100 sec bins |
 |
 |
| Parameter | Plot |
|---|---|
| CZT HV Monitor |  |
| D_VDD | 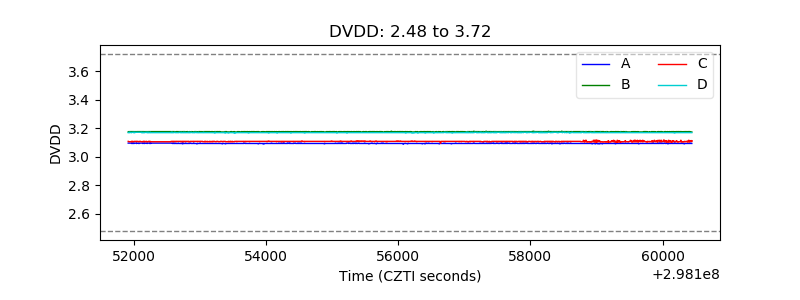 |
| Temperature 1 | 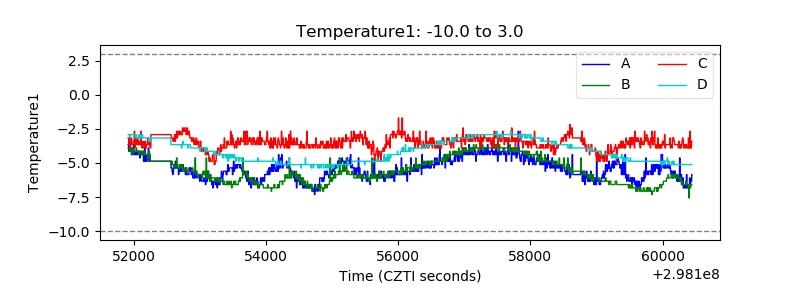 |
| Veto HV Monitor | 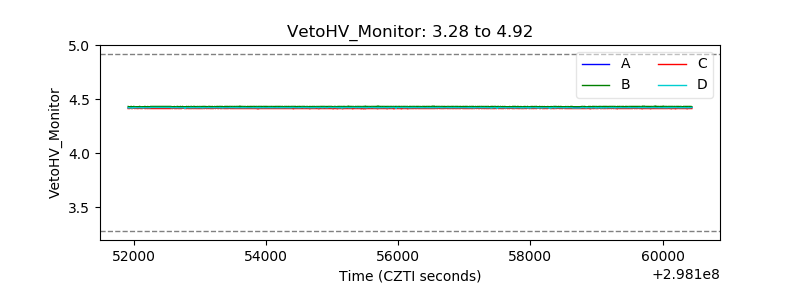 |
| Veto LLD | 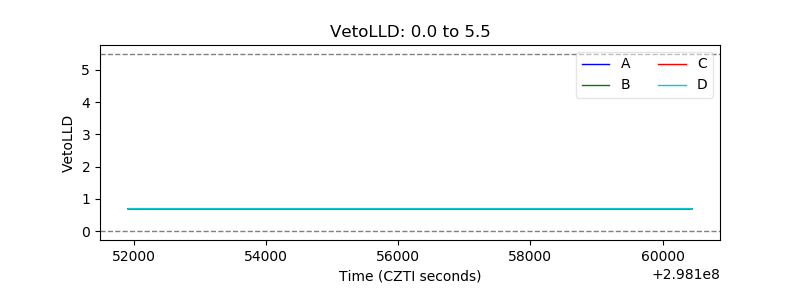 |
| Alpha Counter | 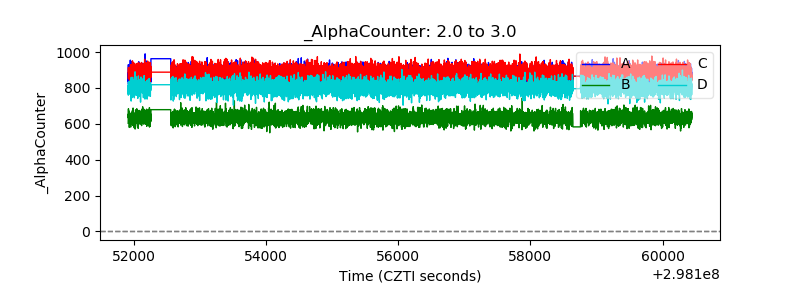 |
| _CPM_Rate | 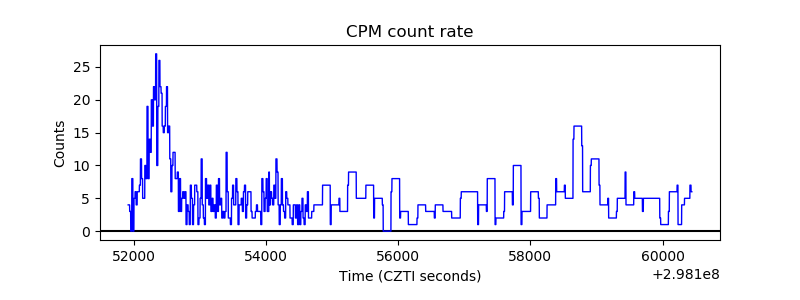 |
| CZT Counter | 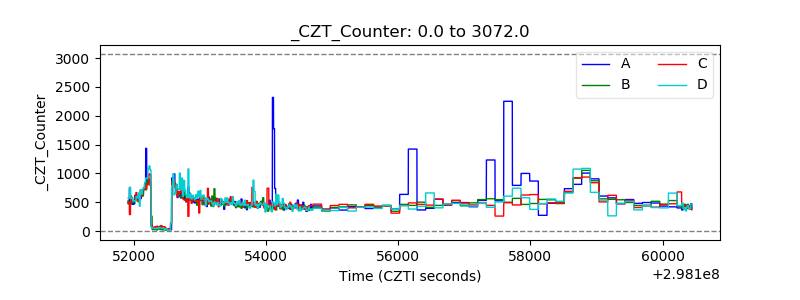 |
| +2.5 Volts monitor |  |
| +5 Volts monitor |  |
| _ROLL_ROT | 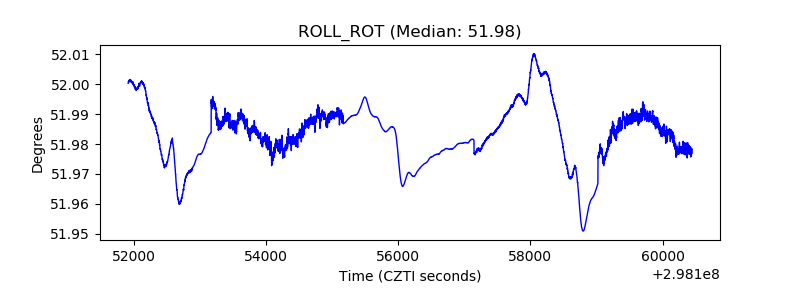 |
| _Roll_DEC | 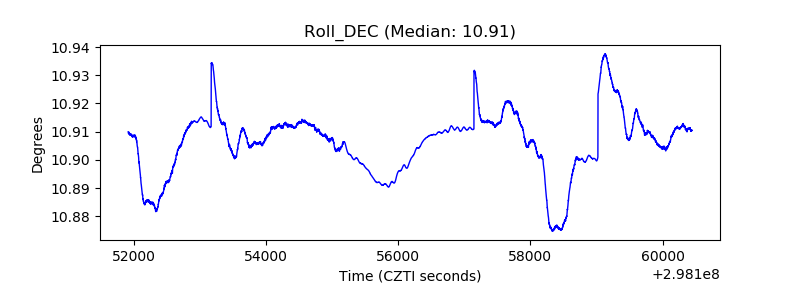 |
| _Roll_RA | 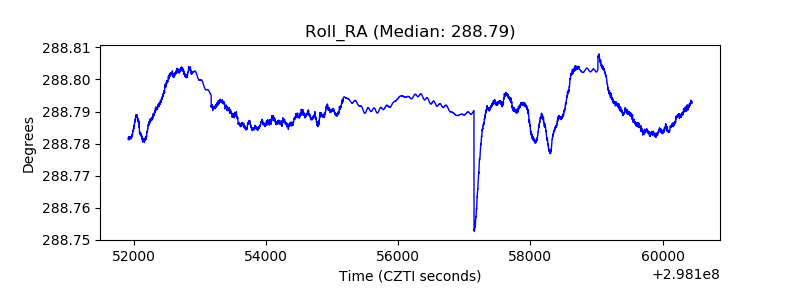 |
| Veto Counter |  |