| Param | Original file | Final file |
|---|---|---|
| Filename | modeM0/AS1T03_117T01_9000002988_20055cztM0_level2.evt | modeM0/AS1T03_117T01_9000002988_20055cztM0_level2_quad_clean.evt |
| Size (bytes) | 1,633,498,560 | 313,122,240 |
| Size | 1.5 GB | 298.6 MB |
| Events in quadrant A | 12,315,415 | 1,991,017 |
| Events in quadrant B | 11,920,573 | 1,997,720 |
| Events in quadrant C | 11,722,608 | 1,919,728 |
| Events in quadrant D | 11,873,973 | 1,908,237 |
| Mode M9 | |||
|---|---|---|---|
| Quadrant | BADHDUFLAG | Total packets | Discarded packets |
| A | 0 | 18 | 0 |
| B | 0 | 18 | 0 |
| C | 0 | 18 | 0 |
| D | 0 | 18 | 0 |
| Mode M0 | |||
|---|---|---|---|
| Quadrant | BADHDUFLAG | Total packets | Discarded packets |
| A | 0 | 52408 | 4 |
| B | 0 | 51230 | 4 |
| C | 0 | 50577 | 4 |
| D | 0 | 52131 | 4 |
| Mode SS | |||
|---|---|---|---|
| Quadrant | BADHDUFLAG | Total packets | Discarded packets |
| A | 0 | 490 | 0 |
| B | 0 | 490 | 0 |
| C | 0 | 490 | 0 |
| D | 0 | 490 | 0 |
| Quadrant | Total seconds | Saturated seconds | Saturation percentage |
|---|---|---|---|
| A | 24239 | 428 | 1.765749% |
| B | 24240 | 399 | 1.646040% |
| C | 24240 | 437 | 1.802805% |
| D | 24240 | 331 | 1.365512% |
Noise dominated data is calculated using 1-second bins in cleaned event files. If a bin has >2000 counts, and if more than 50% of those come from <1% of pixels, then it is considered to be noise-dominated and hence unusable.
| Quadrant | # 1 sec bins | Bins with >0 counts | Bins with >2000 counts | High rate bins dominated by noise | Noise dominated (total time) | Noise dominated (detector-on time) | Marked lightcurve |
|---|---|---|---|---|---|---|---|
| A | 25969 | 24243 | 137 | 137 | 0.53% | 0.57% | 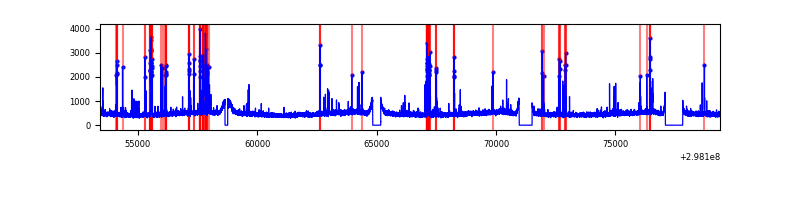 |
| B | 25970 | 24244 | 54 | 54 | 0.21% | 0.22% | 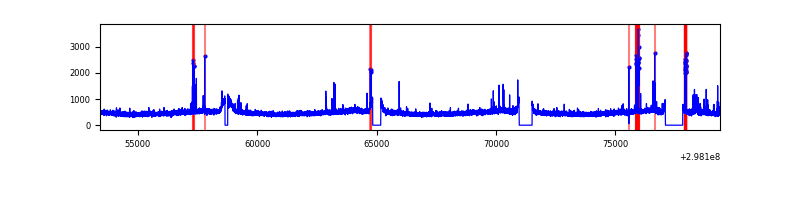 |
| C | 25970 | 24244 | 20 | 20 | 0.08% | 0.08% | 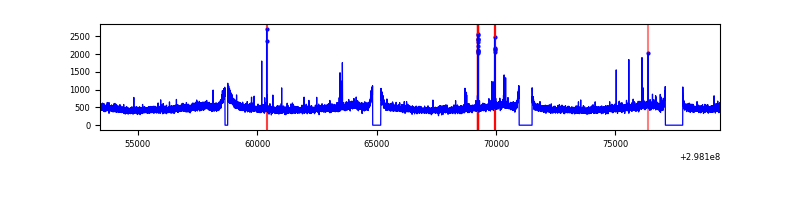 |
| D | 25970 | 24244 | 156 | 156 | 0.60% | 0.64% | 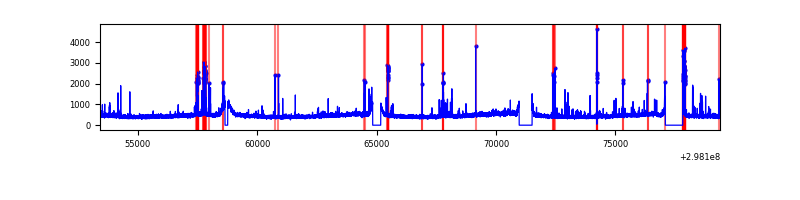 |
Top three noisy pixels from each quadrant. If the there are fewer than three noisy pixels in the level2.evt file, extra rows are filled as -1
| Pixel properties | Quadrant properties | ||||||
|---|---|---|---|---|---|---|---|
| Quadrant | DetID | PixID | Counts | Sigma | Mean | Median | Sigma |
| A | 14 | 238 | 558814 | 933.31 | 2961 | 2899 | 595.6 |
| A | 14 | 254 | 329523 | 548.36 | 2961 | 2899 | 595.6 |
| A | 11 | 29 | 27357 | 41.06 | 2961 | 2899 | 595.6 |
| B | 10 | 245 | 182842 | 318.72 | 2941 | 2863 | 564.7 |
| B | 4 | 80 | 102234 | 175.98 | 2941 | 2863 | 564.7 |
| B | 3 | 64 | 80310 | 137.15 | 2941 | 2863 | 564.7 |
| C | 14 | 238 | 440818 | 660.2 | 2837 | 2853 | 663.4 |
| C | 4 | 254 | 165422 | 245.06 | 2837 | 2853 | 663.4 |
| C | 3 | 233 | 32373 | 44.5 | 2837 | 2853 | 663.4 |
| D | 1 | 52 | 699395 | 996.61 | 2886 | 2809 | 699.0 |
| D | 15 | 145 | 286104 | 405.31 | 2886 | 2809 | 699.0 |
| D | 2 | 234 | 105725 | 147.24 | 2886 | 2809 | 699.0 |
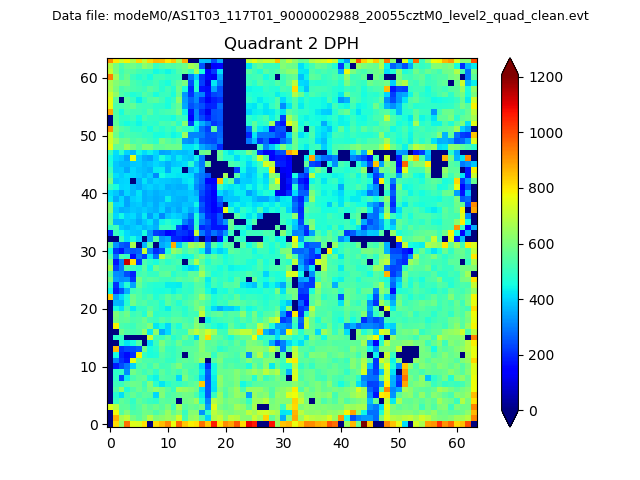
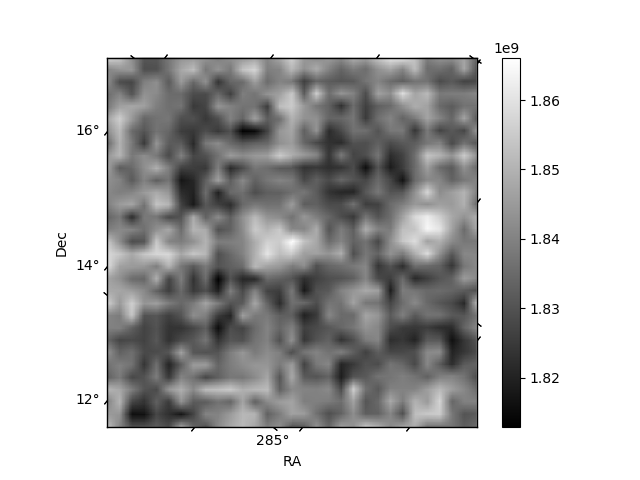
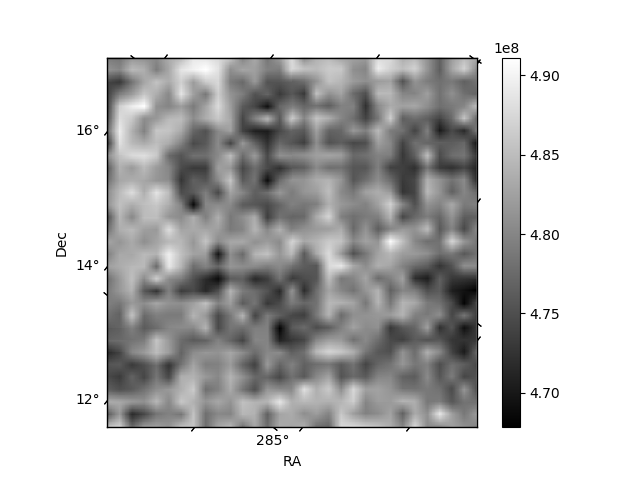
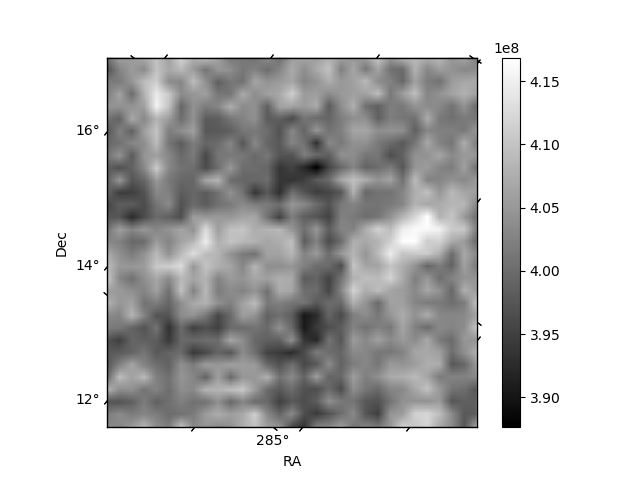
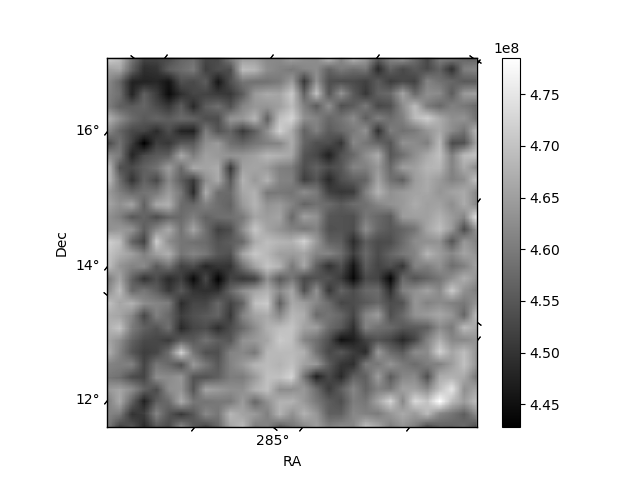
Histogram calculated using DETX and DETY for each event in the final _common_clean file
| Quadrant A | 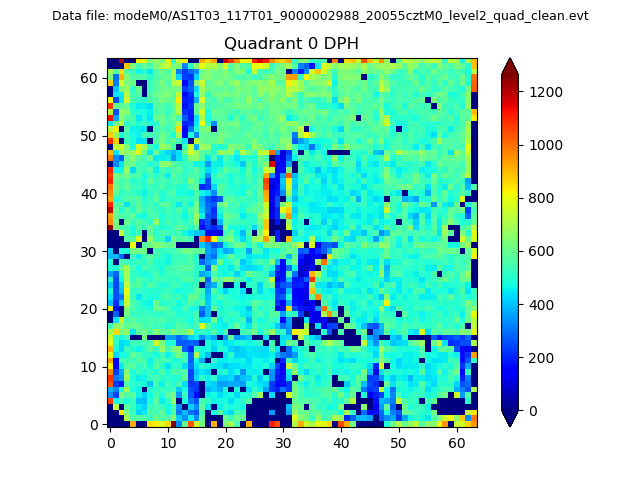 |
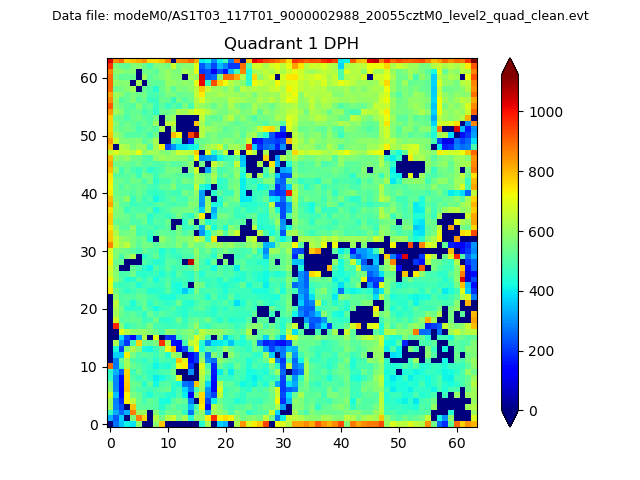 |
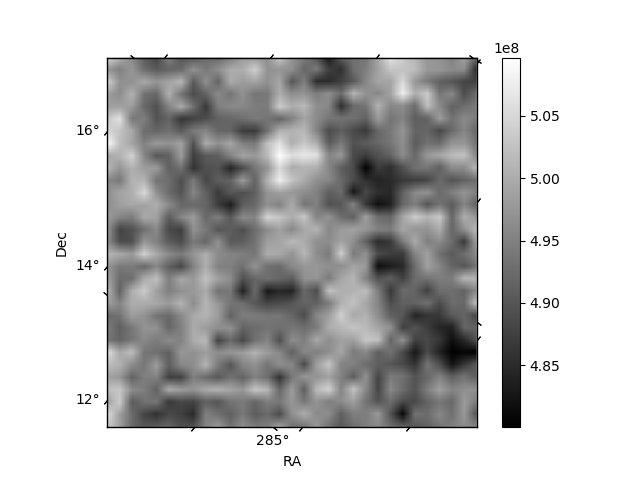
Quadrant B |
|---|---|---|---|
| Quadrant D | 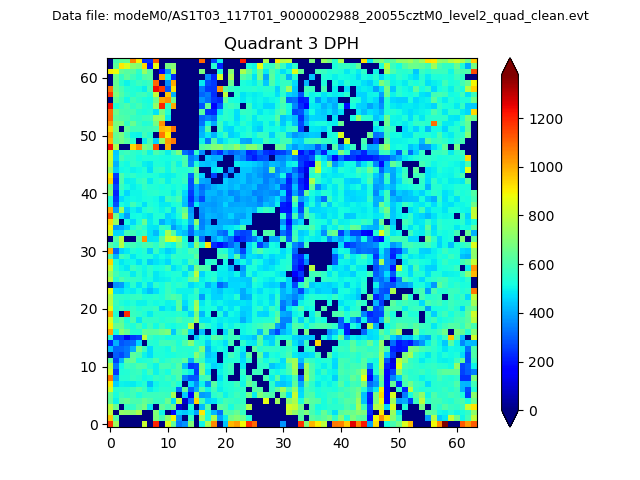 |
 |
Quadrant C |
| Plot type | Count rate plots | Images |
|---|---|---|
| Comparison with Poisson distribution Blue bars denote a histogram of data divided into 1 sec bins. Red curve is a Poisson curve with rate = median count rate of data. |
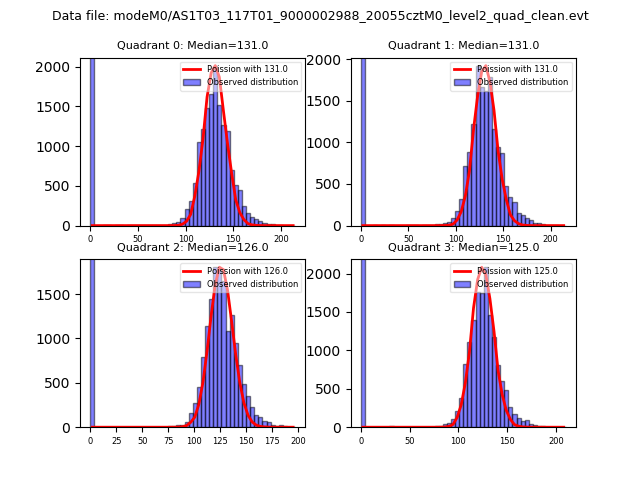 |
 |
| Quadrant-wise count rates Data is divided into 100 sec bins |
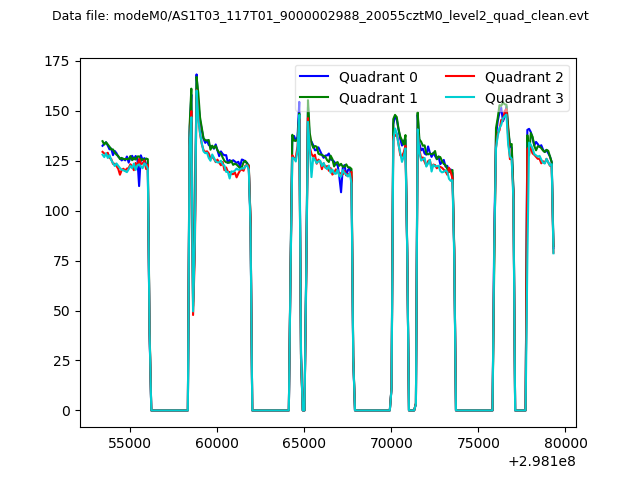 |
|
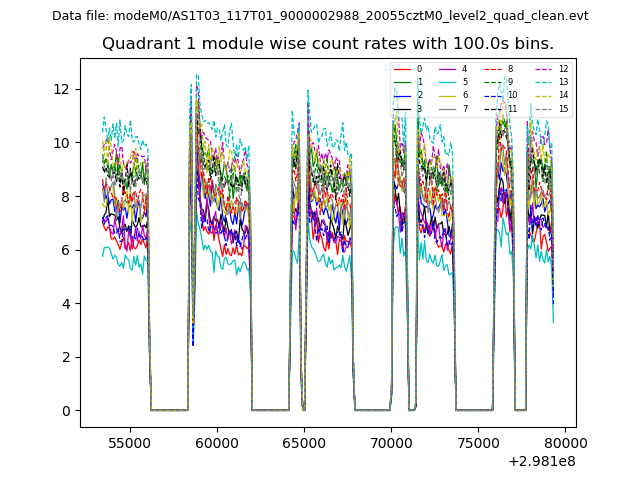
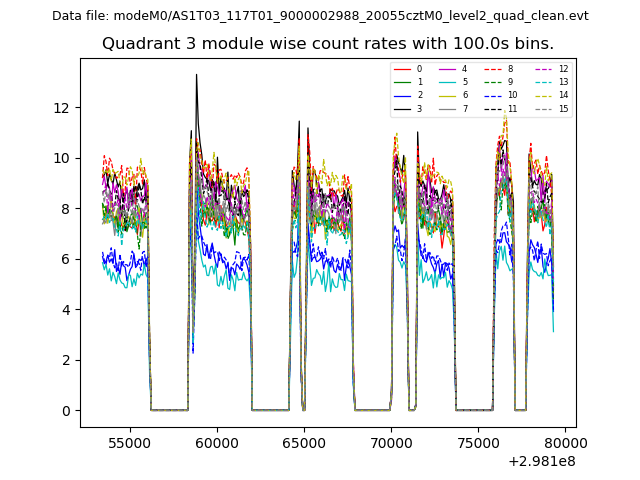
| Module-wise count rates for Quadrant A Data is divided into 100 sec bins |
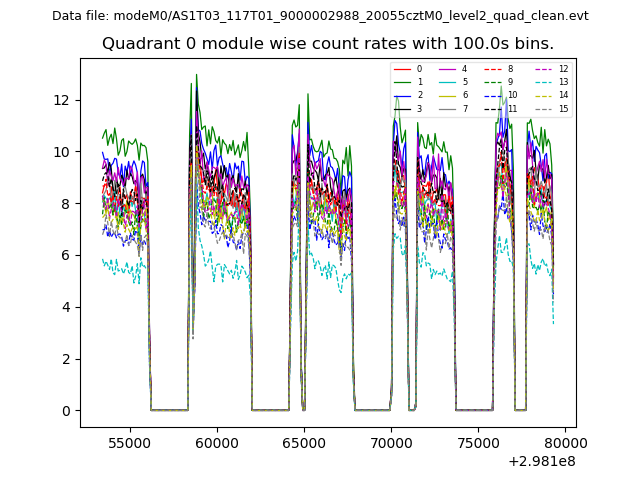 |
 |
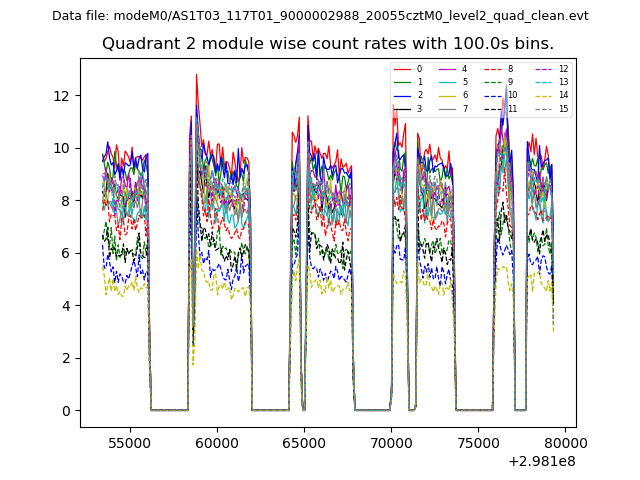
| Module-wise count rates for Quadrant B Data is divided into 100 sec bins |
 |
 |
| Module-wise count rates for Quadrant C Data is divided into 100 sec bins |
 |
 |
| Module-wise count rates for Quadrant D Data is divided into 100 sec bins |
 |
 |
| Parameter | Plot |
|---|---|
| CZT HV Monitor | 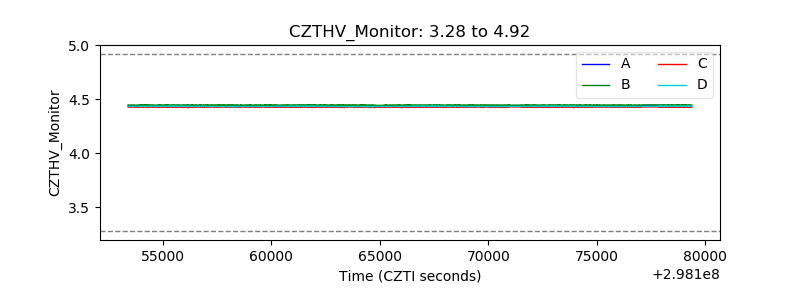 |
| D_VDD | 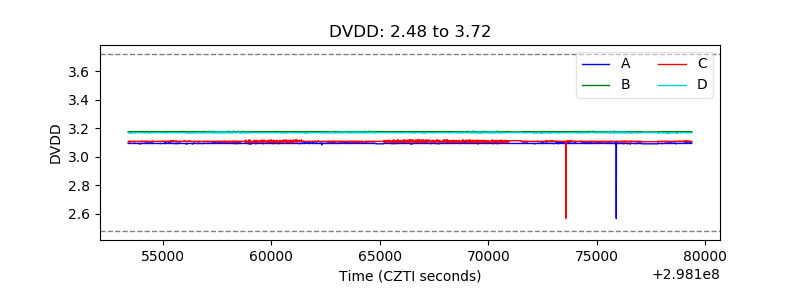 |
| Temperature 1 | 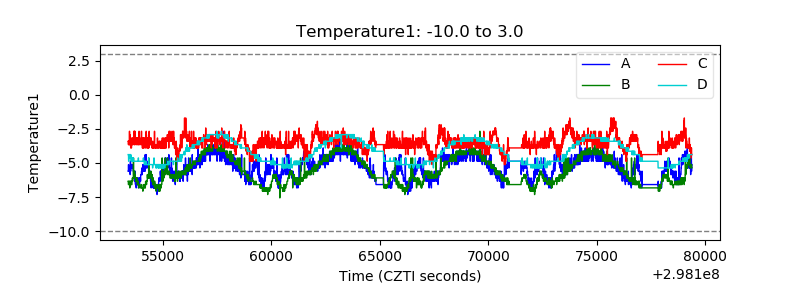 |
| Veto HV Monitor | 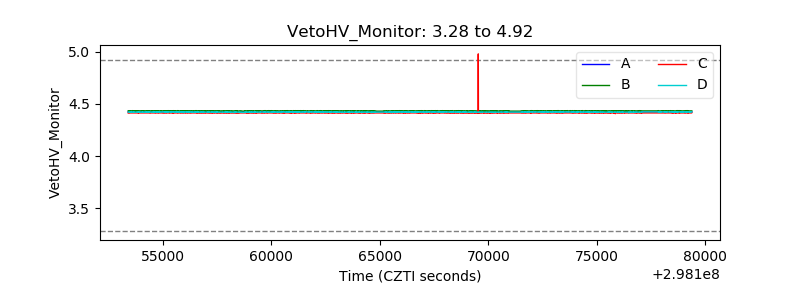 |
| Veto LLD | 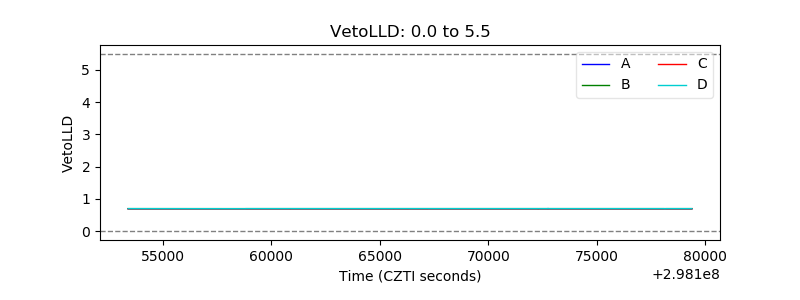 |
| Alpha Counter | 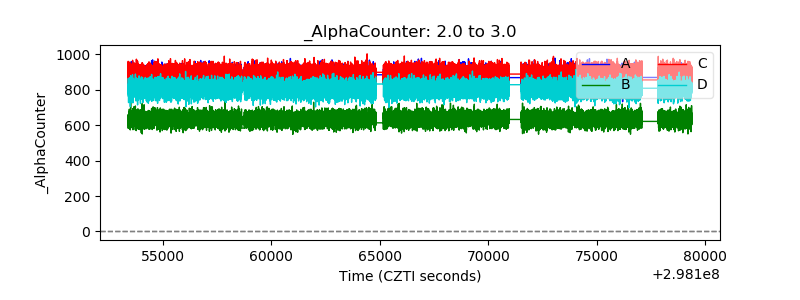 |
| _CPM_Rate | 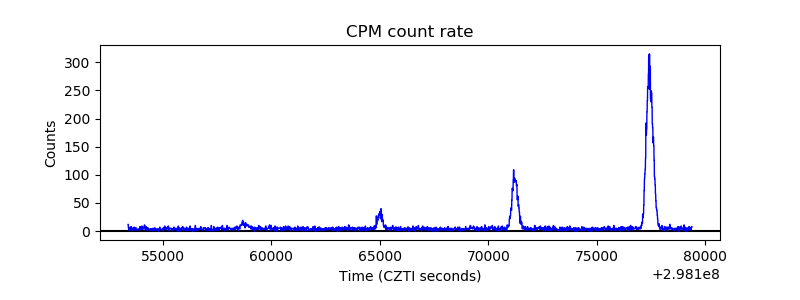 |
| CZT Counter |  |
| +2.5 Volts monitor |  |
| +5 Volts monitor |  |
| _ROLL_ROT | 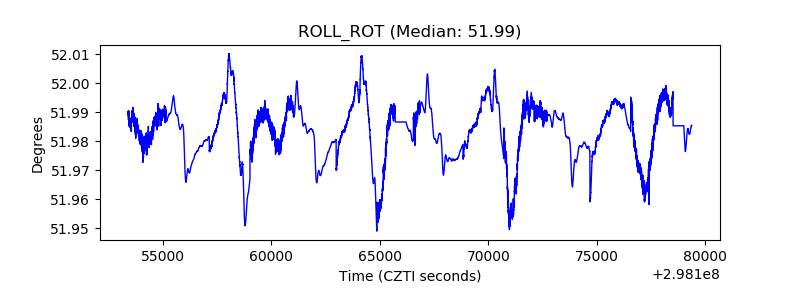 |
| _Roll_DEC | 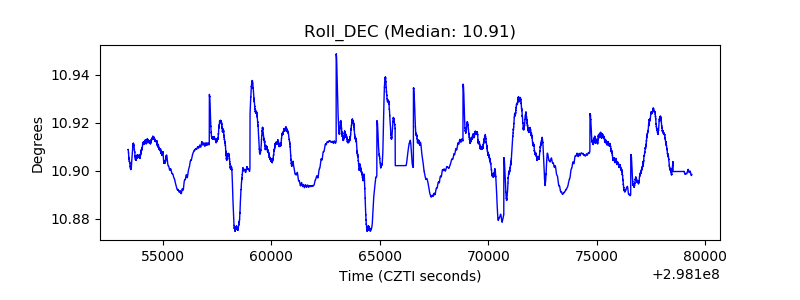 |
| _Roll_RA | 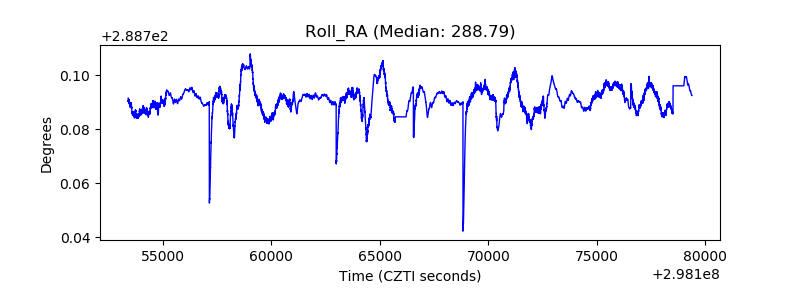 |
| Veto Counter | 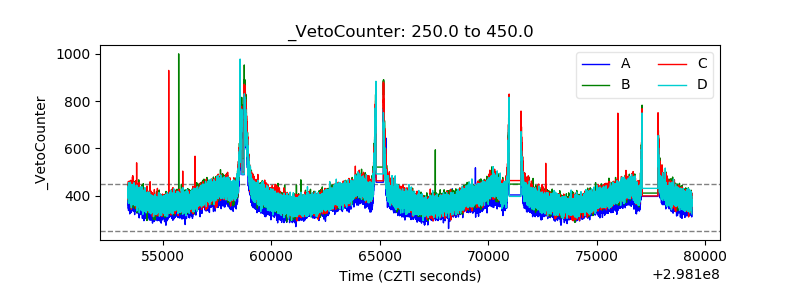 |