| Param | Original file | Final file |
|---|---|---|
| Filename | modeM0/AS1T03_117T01_9000002988_20056cztM0_level2.evt | modeM0/AS1T03_117T01_9000002988_20056cztM0_level2_quad_clean.evt |
| Size (bytes) | 480,147,840 | 92,689,920 |
| Size | 457.9 MB | 88.4 MB |
| Events in quadrant A | 3,672,082 | 595,285 |
| Events in quadrant B | 3,521,715 | 598,986 |
| Events in quadrant C | 3,256,524 | 571,855 |
| Events in quadrant D | 3,627,084 | 564,936 |
| Mode M9 | |||
|---|---|---|---|
| Quadrant | BADHDUFLAG | Total packets | Discarded packets |
| A | 0 | 14 | 0 |
| B | 0 | 15 | 0 |
| C | 0 | 15 | 0 |
| D | 0 | 15 | 0 |
| Mode M0 | |||
|---|---|---|---|
| Quadrant | BADHDUFLAG | Total packets | Discarded packets |
| A | 0 | 15216 | 2 |
| B | 0 | 14639 | 2 |
| C | 0 | 13920 | 2 |
| D | 0 | 15260 | 2 |
| Mode SS | |||
|---|---|---|---|
| Quadrant | BADHDUFLAG | Total packets | Discarded packets |
| A | 0 | 138 | 0 |
| B | 0 | 138 | 0 |
| C | 0 | 138 | 0 |
| D | 0 | 138 | 0 |
| Quadrant | Total seconds | Saturated seconds | Saturation percentage |
|---|---|---|---|
| A | 6833 | 152 | 2.224499% |
| B | 6832 | 93 | 1.361241% |
| C | 6832 | 66 | 0.966042% |
| D | 6832 | 101 | 1.478337% |
Noise dominated data is calculated using 1-second bins in cleaned event files. If a bin has >2000 counts, and if more than 50% of those come from <1% of pixels, then it is considered to be noise-dominated and hence unusable.
| Quadrant | # 1 sec bins | Bins with >0 counts | Bins with >2000 counts | High rate bins dominated by noise | Noise dominated (total time) | Noise dominated (detector-on time) | Marked lightcurve |
|---|---|---|---|---|---|---|---|
| A | 7763 | 6834 | 92 | 92 | 1.19% | 1.35% | 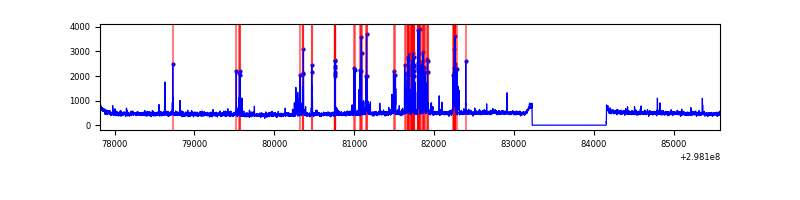 |
| B | 7762 | 6833 | 28 | 28 | 0.36% | 0.41% | 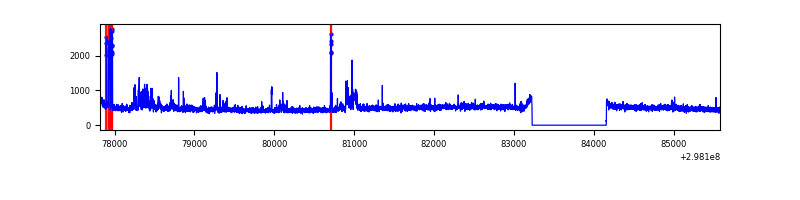 |
| C | 7762 | 6833 | 0 | 0 | 0.00% | 0.00% | 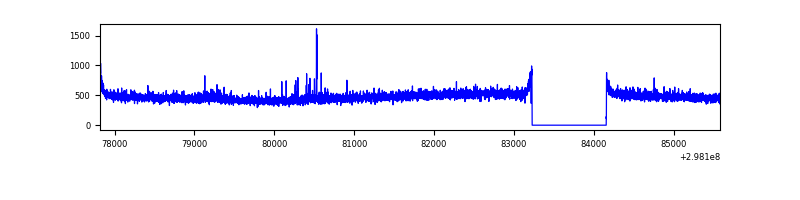 |
| D | 7762 | 6833 | 59 | 59 | 0.76% | 0.86% | 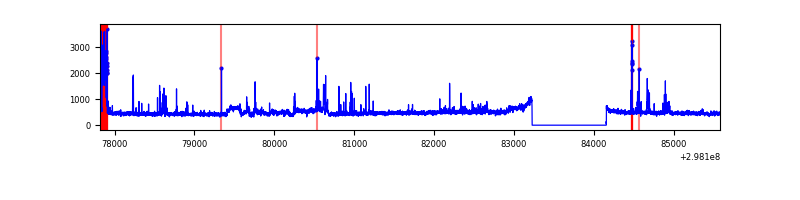 |
Top three noisy pixels from each quadrant. If the there are fewer than three noisy pixels in the level2.evt file, extra rows are filled as -1
| Pixel properties | Quadrant properties | ||||||
|---|---|---|---|---|---|---|---|
| Quadrant | DetID | PixID | Counts | Sigma | Mean | Median | Sigma |
| A | 14 | 254 | 236803 | 1409.4 | 830 | 812 | 167.4 |
| A | 14 | 238 | 232677 | 1384.76 | 830 | 812 | 167.4 |
| A | 11 | 29 | 8856 | 48.04 | 830 | 812 | 167.4 |
| B | 10 | 245 | 254051 | 1580.05 | 826 | 804 | 160.3 |
| B | 12 | 111 | 19880 | 119.02 | 826 | 804 | 160.3 |
| B | 3 | 64 | 18351 | 109.48 | 826 | 804 | 160.3 |
| C | 14 | 238 | 124178 | 657.01 | 793 | 799 | 187.8 |
| C | 4 | 254 | 31740 | 164.76 | 793 | 799 | 187.8 |
| C | 3 | 233 | 8022 | 38.46 | 793 | 799 | 187.8 |
| D | 1 | 52 | 354179 | 1778.26 | 807 | 784 | 198.7 |
| D | 1 | 20 | 213083 | 1068.27 | 807 | 784 | 198.7 |
| D | 2 | 234 | 28547 | 139.7 | 807 | 784 | 198.7 |
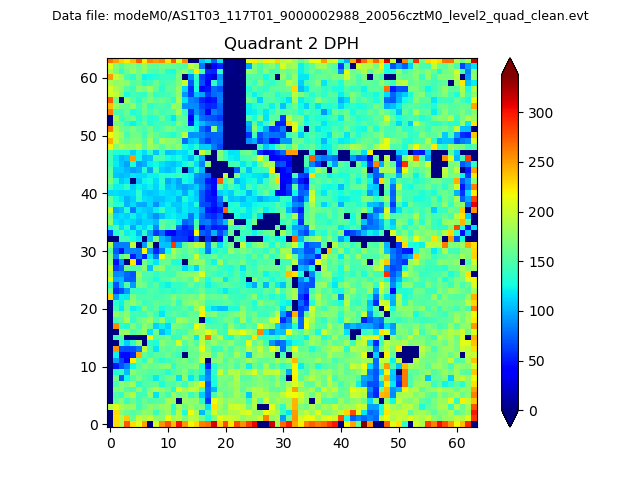
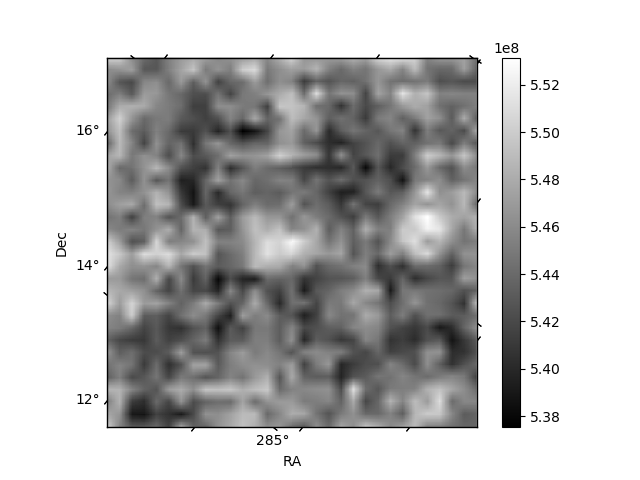
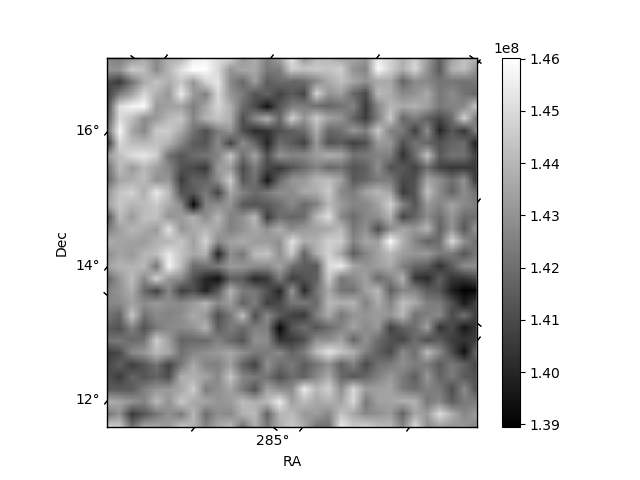
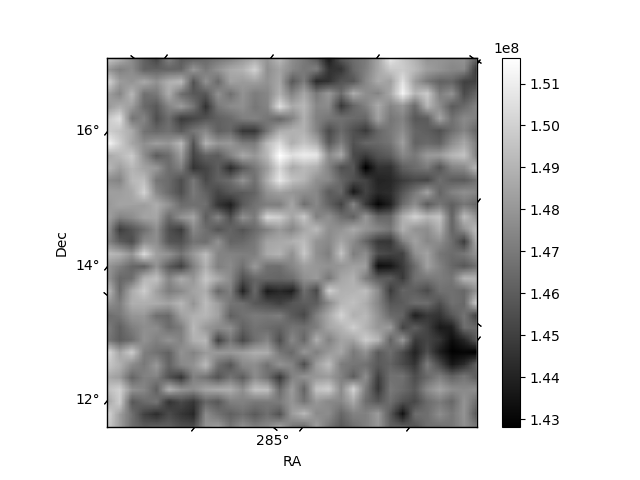
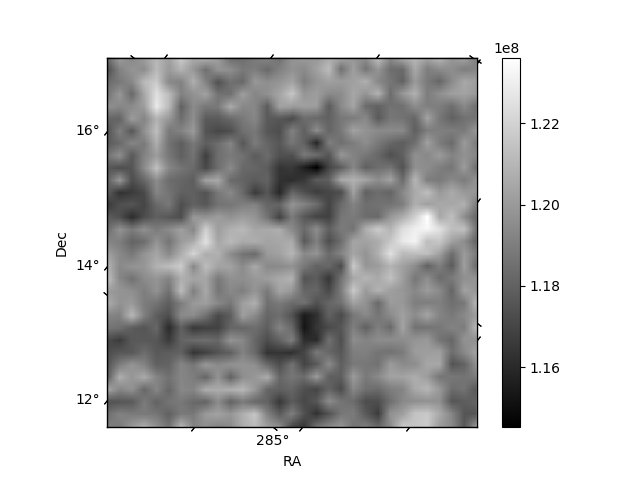
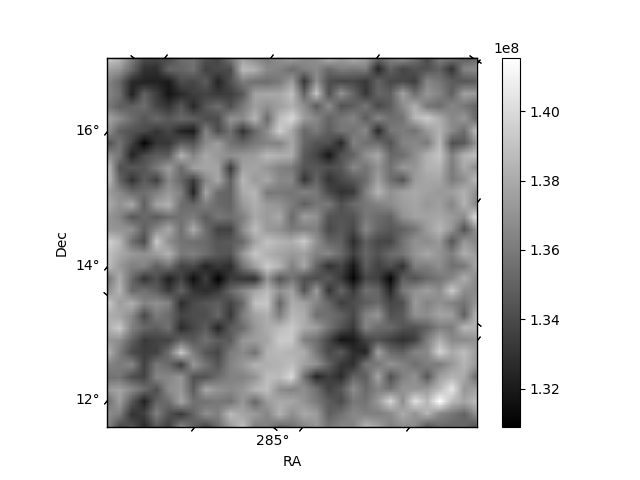
Histogram calculated using DETX and DETY for each event in the final _common_clean file
| Quadrant A | 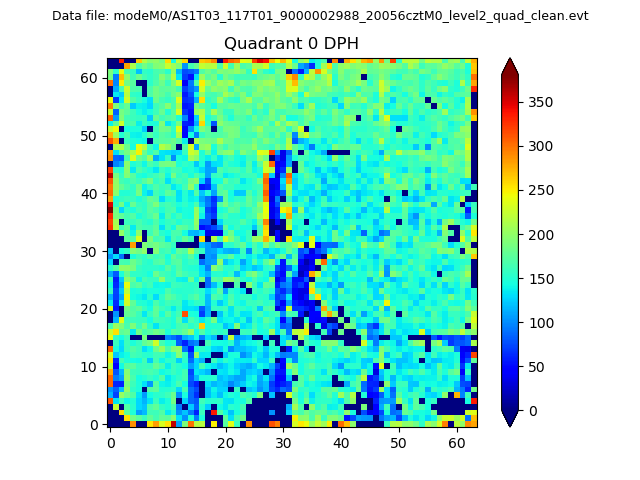 |
 |
Quadrant B |
|---|---|---|---|
| Quadrant D | 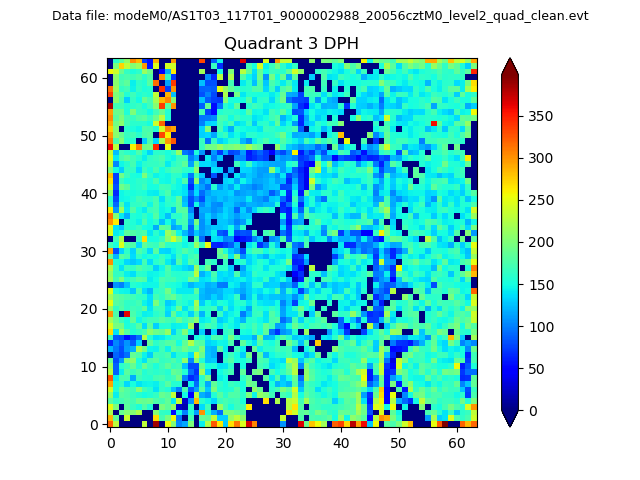 |
 |
Quadrant C |
| Plot type | Count rate plots | Images |
|---|---|---|
| Comparison with Poisson distribution Blue bars denote a histogram of data divided into 1 sec bins. Red curve is a Poisson curve with rate = median count rate of data. |
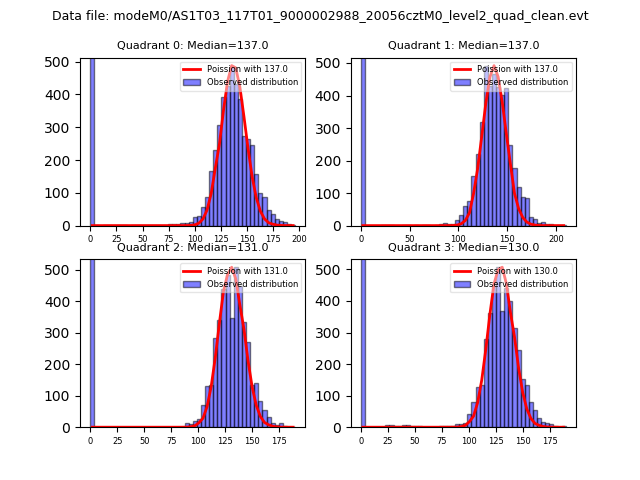 |
 |
| Quadrant-wise count rates Data is divided into 100 sec bins |
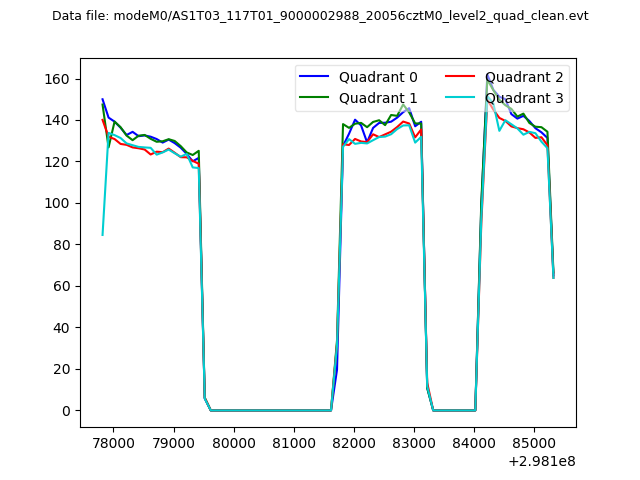 |
|
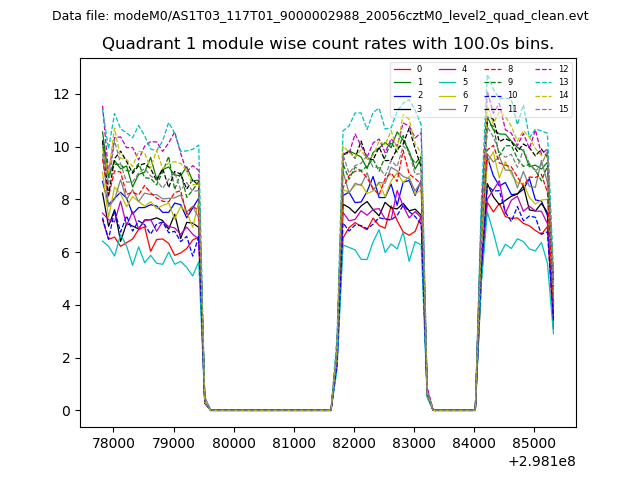
| Module-wise count rates for Quadrant A Data is divided into 100 sec bins |
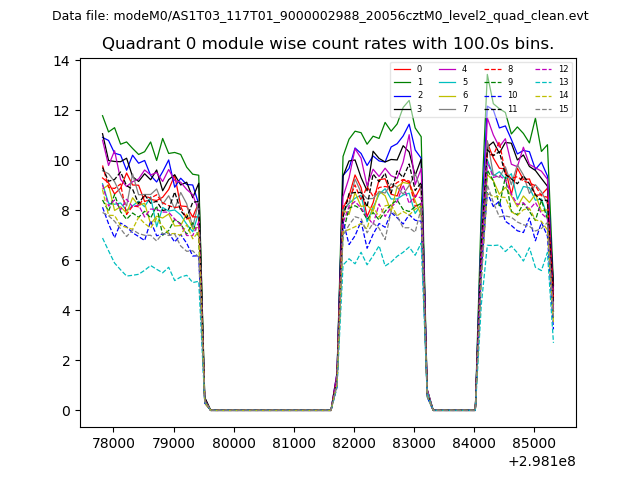 |
 |
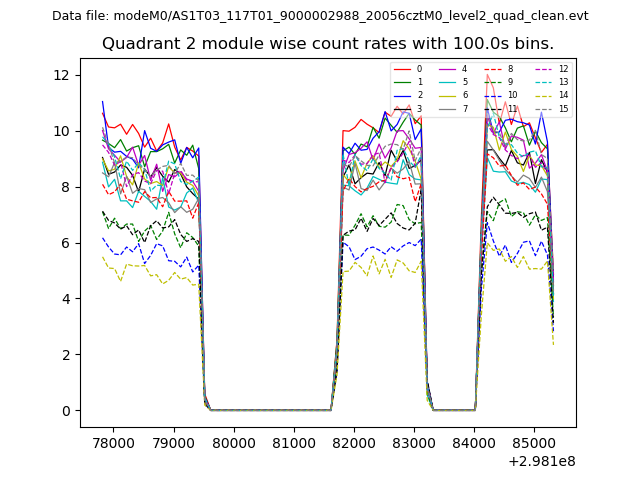
| Module-wise count rates for Quadrant B Data is divided into 100 sec bins |
 |
 |
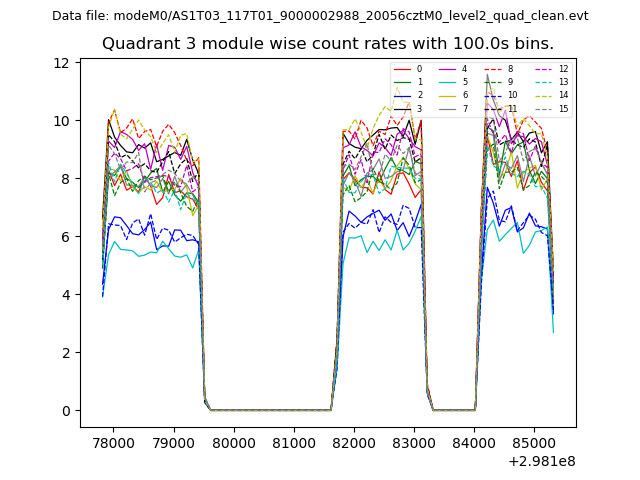
| Module-wise count rates for Quadrant C Data is divided into 100 sec bins |
 |
 |
| Module-wise count rates for Quadrant D Data is divided into 100 sec bins |
 |
 |
| Parameter | Plot |
|---|---|
| CZT HV Monitor | 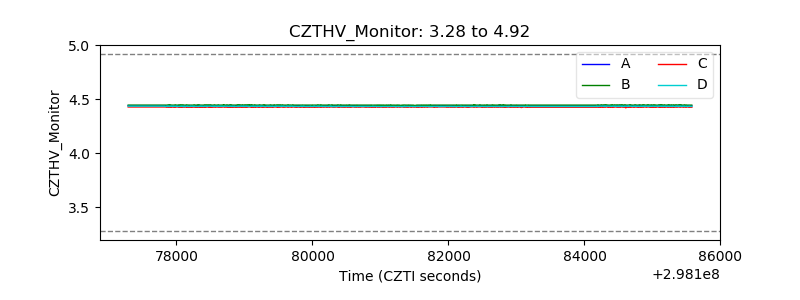 |
| D_VDD | 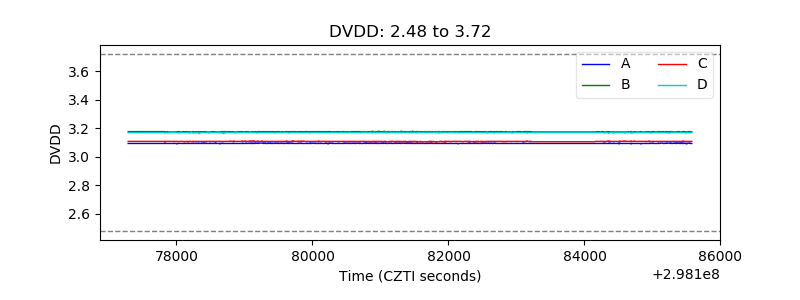 |
| Temperature 1 | 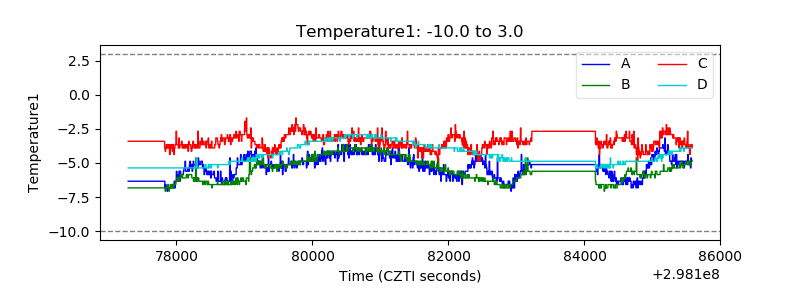 |
| Veto HV Monitor | 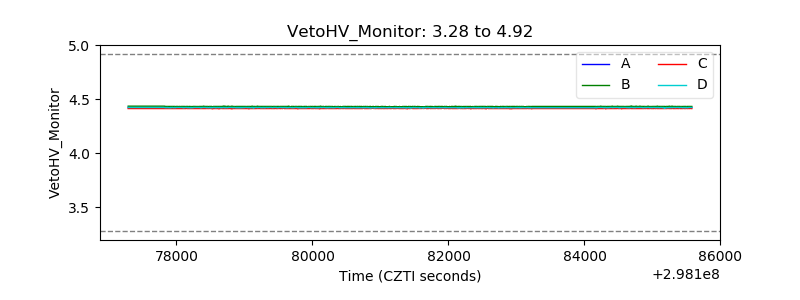 |
| Veto LLD | 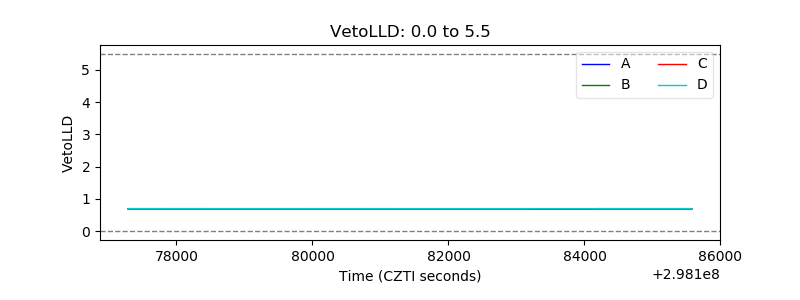 |
| Alpha Counter | 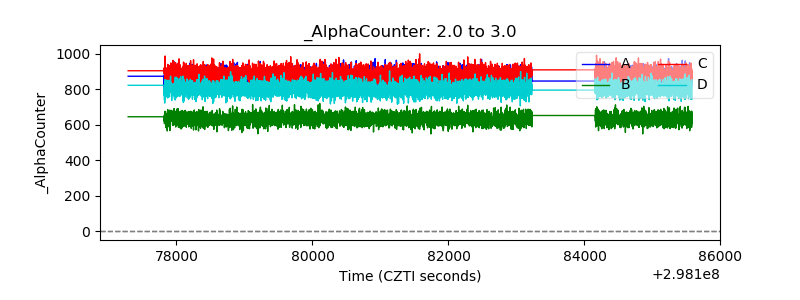 |
| _CPM_Rate | 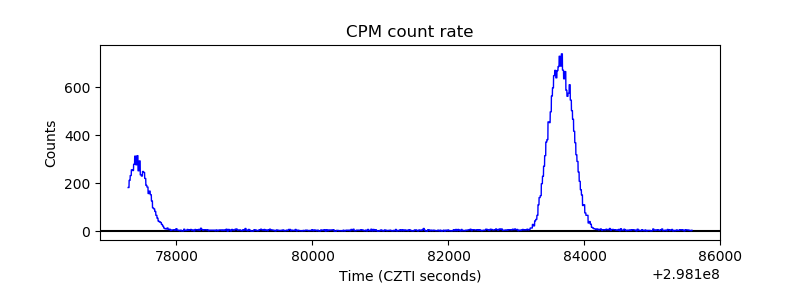 |
| CZT Counter | 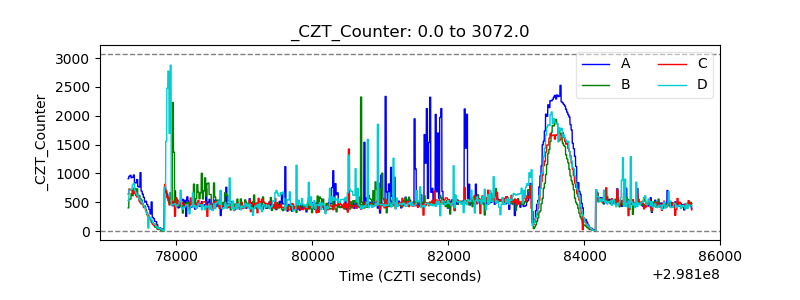 |
| +2.5 Volts monitor |  |
| +5 Volts monitor |  |
| _ROLL_ROT | 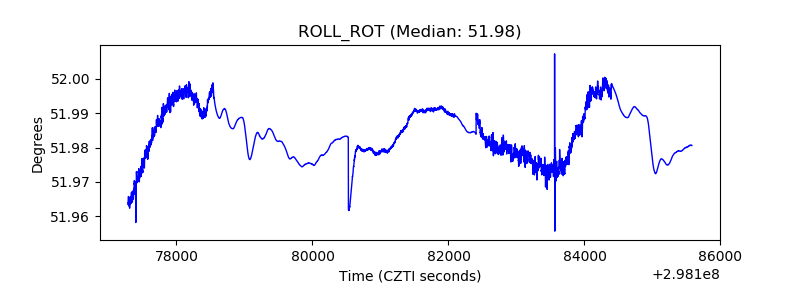 |
| _Roll_DEC | 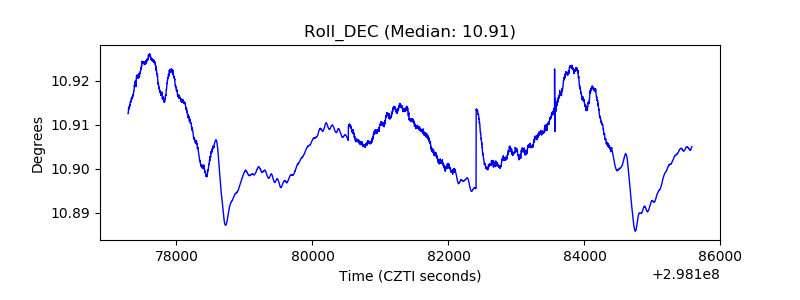 |
| _Roll_RA | 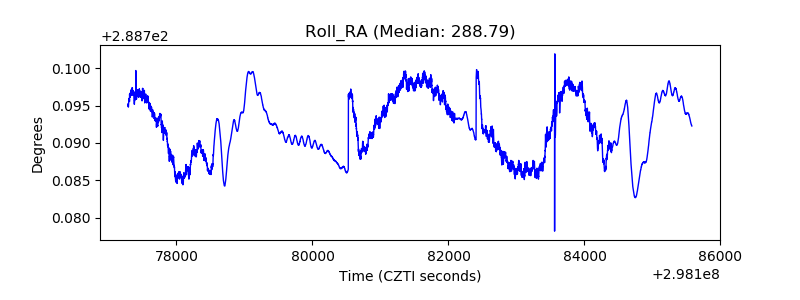 |
| Veto Counter | 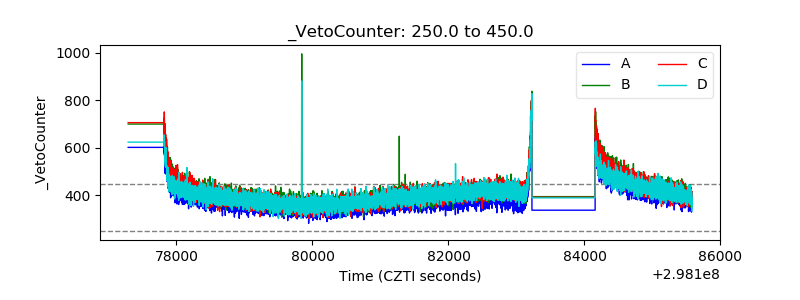 |