| Param | Original file | Final file |
|---|---|---|
| Filename | modeM0/AS1T03_117T01_9000002988_20057cztM0_level2.evt | modeM0/AS1T03_117T01_9000002988_20057cztM0_level2_quad_clean.evt |
| Size (bytes) | 431,781,120 | 79,917,120 |
| Size | 411.8 MB | 76.2 MB |
| Events in quadrant A | 3,141,056 | 507,969 |
| Events in quadrant B | 3,045,334 | 512,771 |
| Events in quadrant C | 3,029,720 | 485,103 |
| Events in quadrant D | 3,441,648 | 484,091 |
| Mode M9 | |||
|---|---|---|---|
| Quadrant | BADHDUFLAG | Total packets | Discarded packets |
| A | 0 | 11 | 0 |
| B | 0 | 11 | 0 |
| C | 0 | 11 | 0 |
| D | 0 | 11 | 0 |
| Mode M0 | |||
|---|---|---|---|
| Quadrant | BADHDUFLAG | Total packets | Discarded packets |
| A | 0 | 13088 | 1 |
| B | 0 | 12763 | 1 |
| C | 0 | 12770 | 2 |
| D | 0 | 14359 | 1 |
| Mode SS | |||
|---|---|---|---|
| Quadrant | BADHDUFLAG | Total packets | Discarded packets |
| A | 0 | 124 | 0 |
| B | 0 | 124 | 0 |
| C | 0 | 124 | 0 |
| D | 0 | 124 | 0 |
| Quadrant | Total seconds | Saturated seconds | Saturation percentage |
|---|---|---|---|
| A | 6164 | 81 | 1.314082% |
| B | 6165 | 62 | 1.005677% |
| C | 6164 | 71 | 1.151849% |
| D | 6164 | 74 | 1.200519% |
Noise dominated data is calculated using 1-second bins in cleaned event files. If a bin has >2000 counts, and if more than 50% of those come from <1% of pixels, then it is considered to be noise-dominated and hence unusable.
| Quadrant | # 1 sec bins | Bins with >0 counts | Bins with >2000 counts | High rate bins dominated by noise | Noise dominated (total time) | Noise dominated (detector-on time) | Marked lightcurve |
|---|---|---|---|---|---|---|---|
| A | 7214 | 6165 | 20 | 20 | 0.28% | 0.32% | 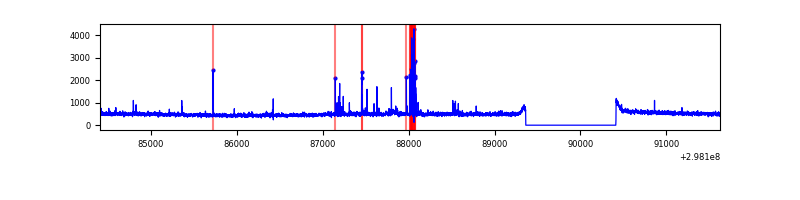 |
| B | 7215 | 6166 | 1 | 1 | 0.01% | 0.02% | 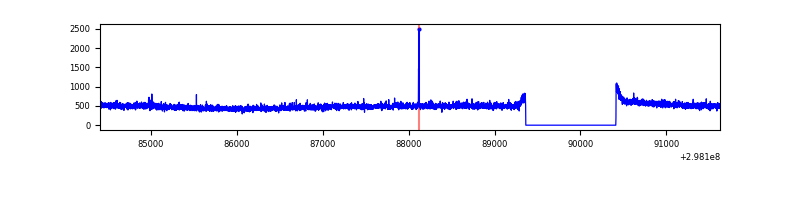 |
| C | 7214 | 6165 | 3 | 3 | 0.04% | 0.05% | 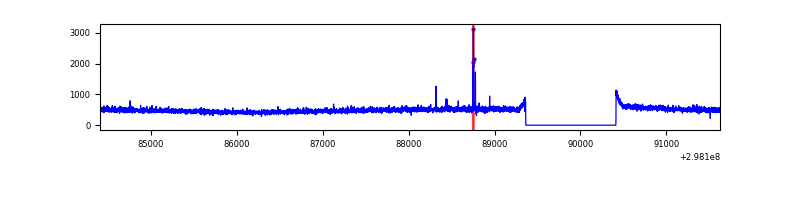 |
| D | 7214 | 6165 | 39 | 39 | 0.54% | 0.63% | 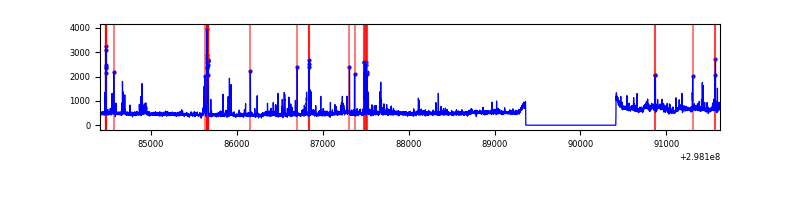 |
Top three noisy pixels from each quadrant. If the there are fewer than three noisy pixels in the level2.evt file, extra rows are filled as -1
| Pixel properties | Quadrant properties | ||||||
|---|---|---|---|---|---|---|---|
| Quadrant | DetID | PixID | Counts | Sigma | Mean | Median | Sigma |
| A | 14 | 238 | 112133 | 712.76 | 781 | 766 | 156.2 |
| A | 12 | 16 | 9931 | 58.66 | 781 | 766 | 156.2 |
| A | 11 | 29 | 7777 | 44.87 | 781 | 766 | 156.2 |
| B | 12 | 111 | 18517 | 119.87 | 772 | 754 | 148.2 |
| B | 11 | 111 | 16168 | 104.02 | 772 | 754 | 148.2 |
| B | 14 | 111 | 15114 | 96.91 | 772 | 754 | 148.2 |
| C | 14 | 238 | 116009 | 666.92 | 738 | 745 | 172.8 |
| C | 4 | 254 | 27366 | 154.03 | 738 | 745 | 172.8 |
| C | 13 | 61 | 5058 | 24.96 | 738 | 745 | 172.8 |
| D | 1 | 52 | 327283 | 1755.48 | 756 | 734 | 186.0 |
| D | 2 | 184 | 166088 | 888.92 | 756 | 734 | 186.0 |
| D | 13 | 104 | 76942 | 409.68 | 756 | 734 | 186.0 |
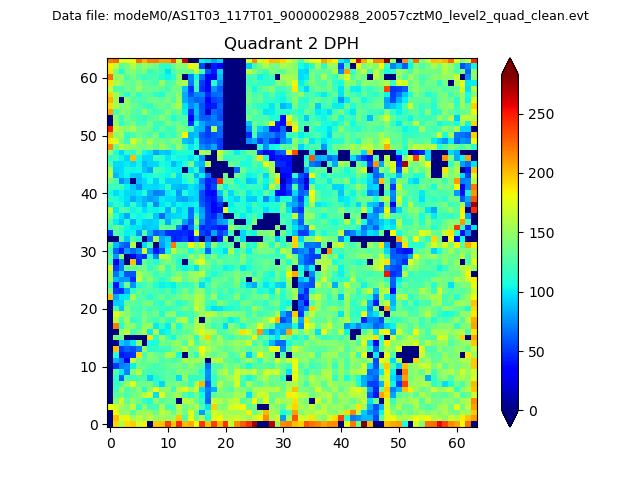
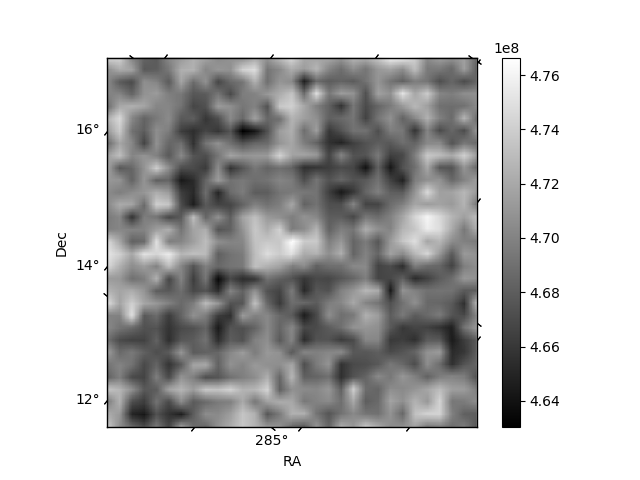
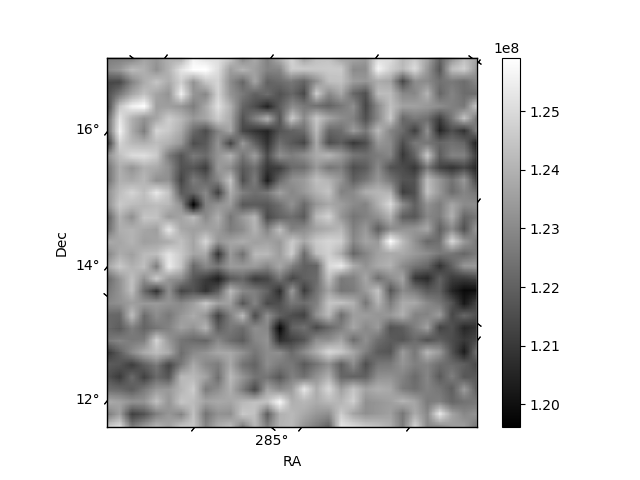
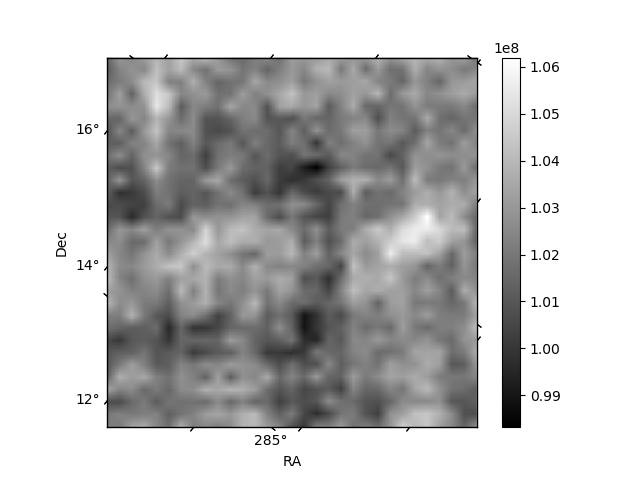
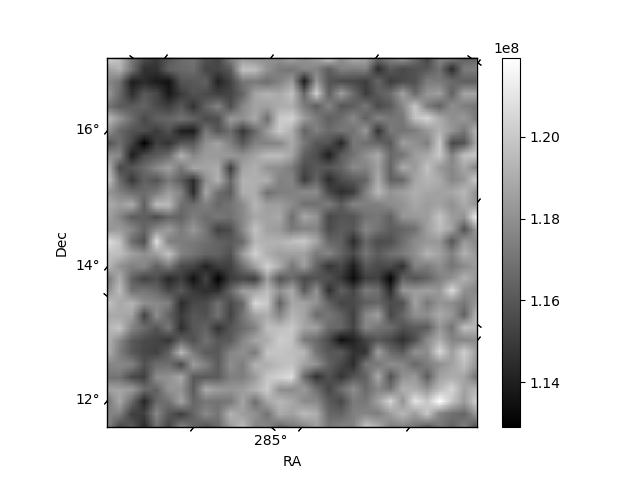
Histogram calculated using DETX and DETY for each event in the final _common_clean file
| Quadrant A | 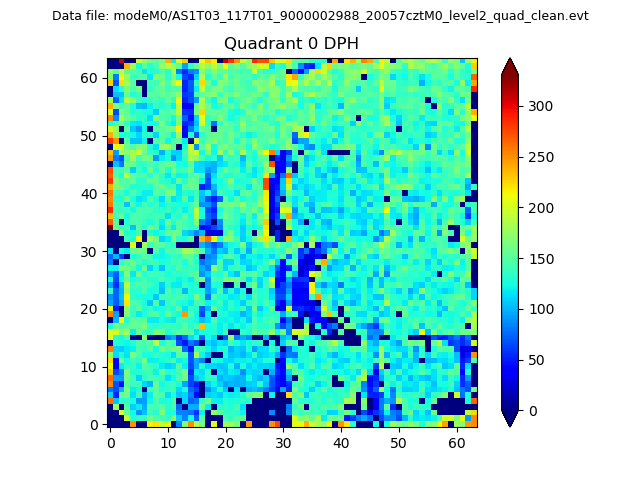 |
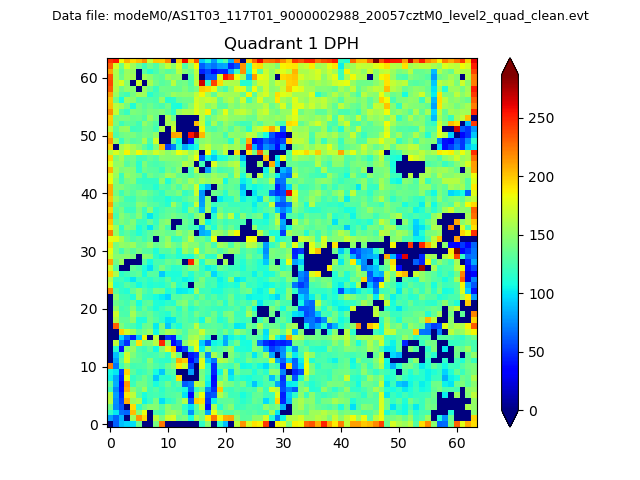 |
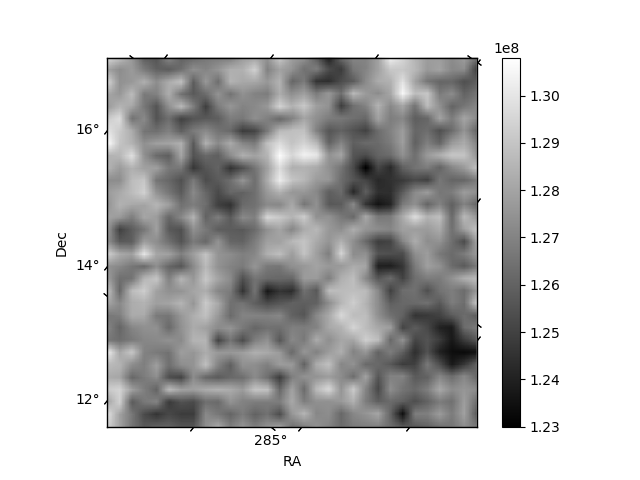
Quadrant B |
|---|---|---|---|
| Quadrant D | 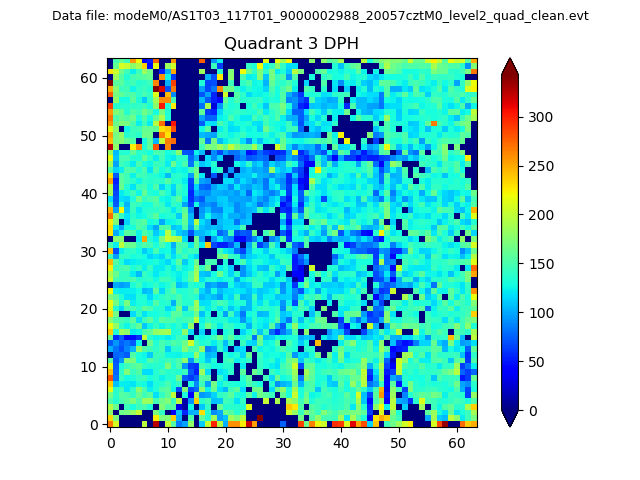 |
 |
Quadrant C |
| Plot type | Count rate plots | Images |
|---|---|---|
| Comparison with Poisson distribution Blue bars denote a histogram of data divided into 1 sec bins. Red curve is a Poisson curve with rate = median count rate of data. |
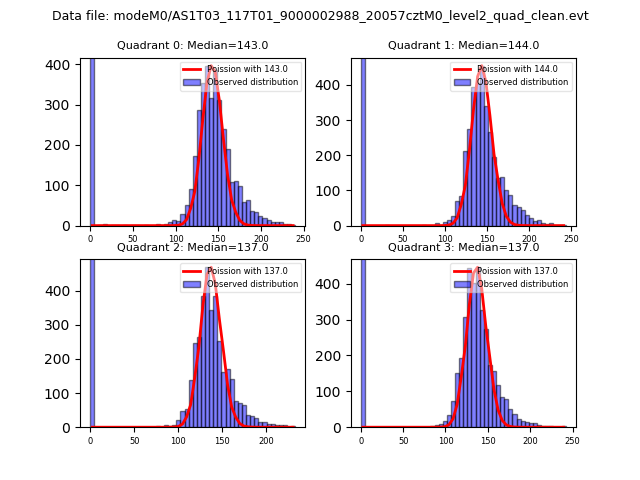 |
 |
| Quadrant-wise count rates Data is divided into 100 sec bins |
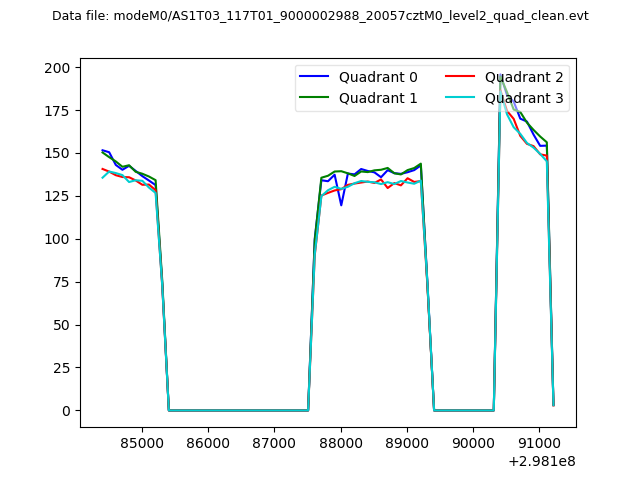 |
|
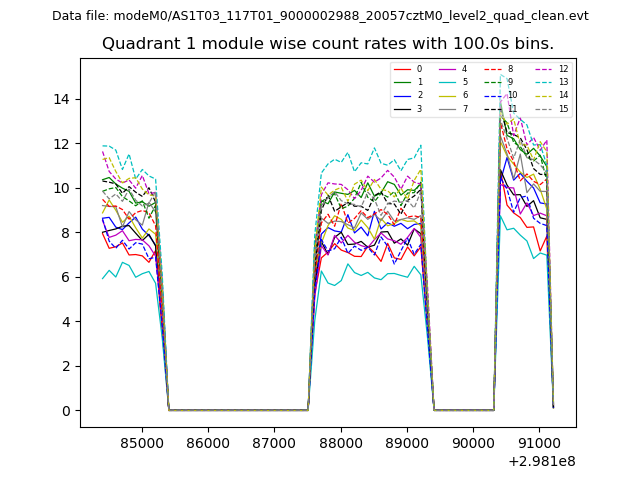
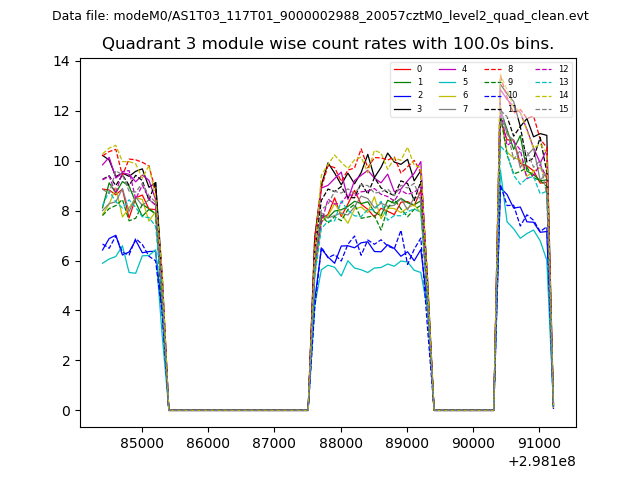
| Module-wise count rates for Quadrant A Data is divided into 100 sec bins |
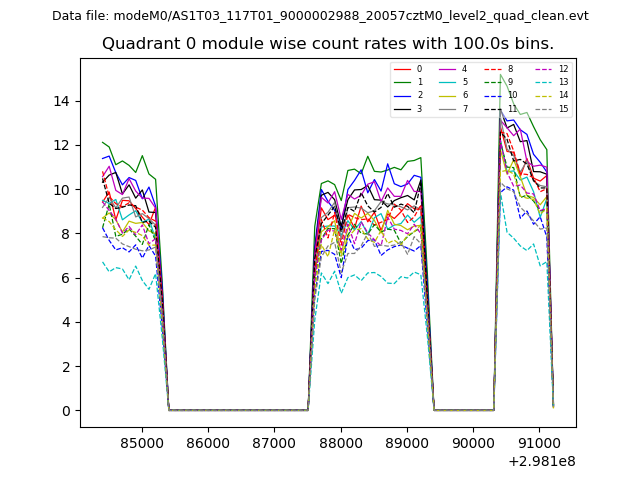 |
 |
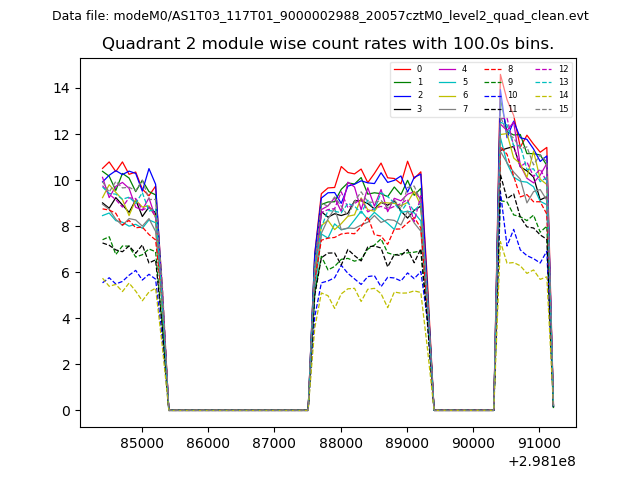
| Module-wise count rates for Quadrant B Data is divided into 100 sec bins |
 |
 |
| Module-wise count rates for Quadrant C Data is divided into 100 sec bins |
 |
 |
| Module-wise count rates for Quadrant D Data is divided into 100 sec bins |
 |
 |
| Parameter | Plot |
|---|---|
| CZT HV Monitor | 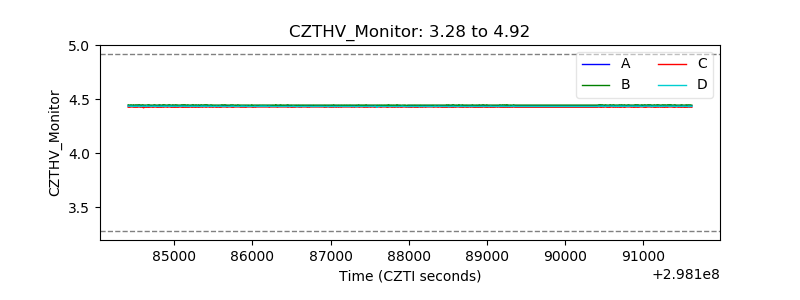 |
| D_VDD | 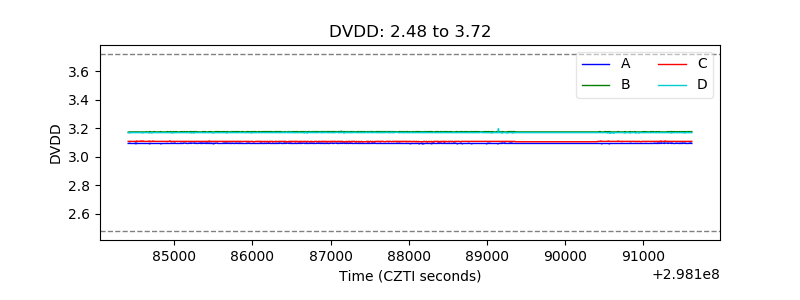 |
| Temperature 1 |  |
| Veto HV Monitor | 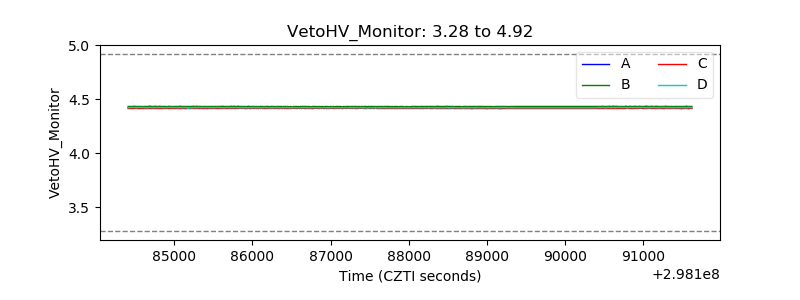 |
| Veto LLD |  |
| Alpha Counter | 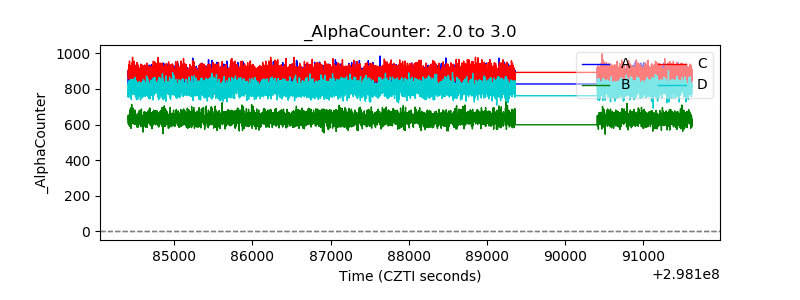 |
| _CPM_Rate | 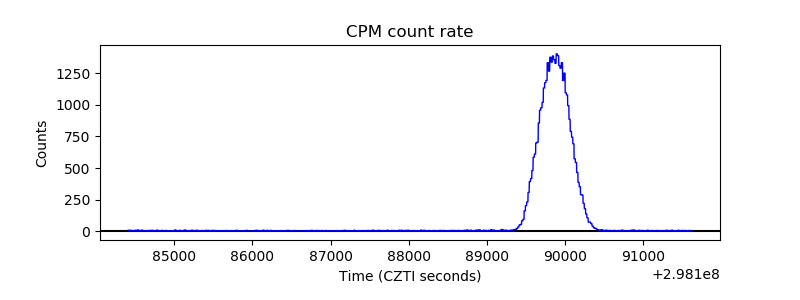 |
| CZT Counter | 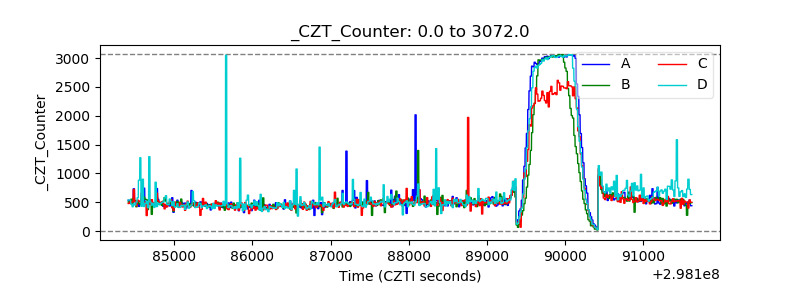 |
| +2.5 Volts monitor |  |
| +5 Volts monitor | 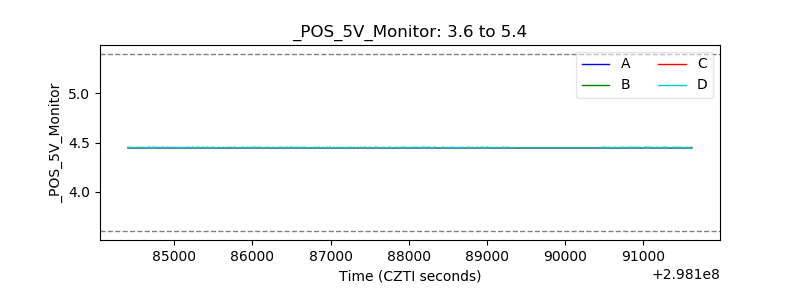 |
| _ROLL_ROT | 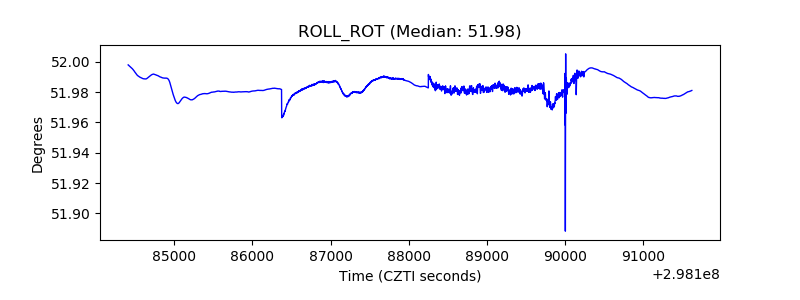 |
| _Roll_DEC | 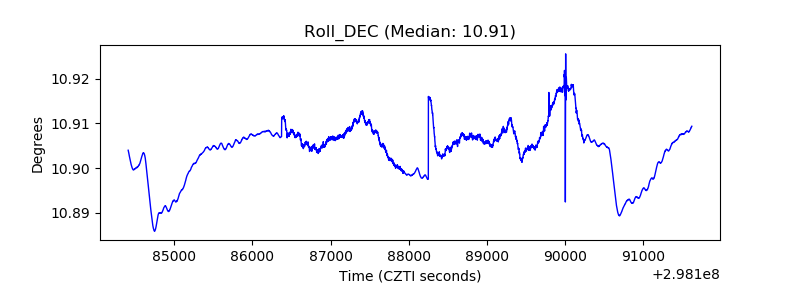 |
| _Roll_RA | 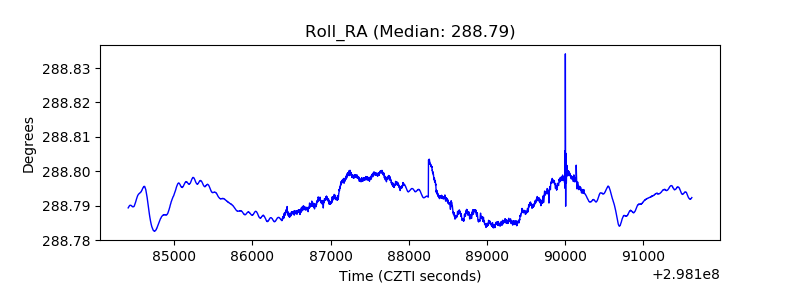 |
| Veto Counter | 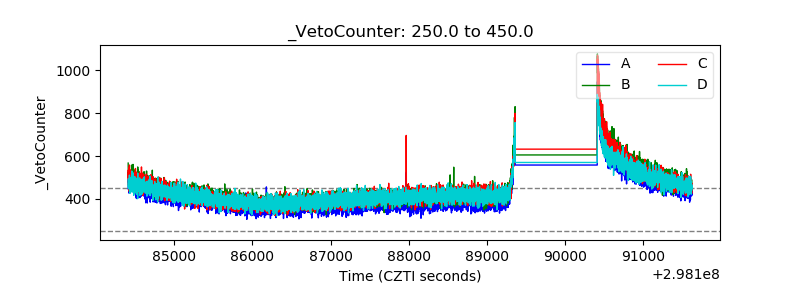 |