| Param | Original file | Final file |
|---|---|---|
| Filename | modeM0/AS1T03_117T01_9000002988_20060cztM0_level2.evt | modeM0/AS1T03_117T01_9000002988_20060cztM0_level2_quad_clean.evt |
| Size (bytes) | 497,188,800 | 69,229,440 |
| Size | 474.2 MB | 66.0 MB |
| Events in quadrant A | 3,904,515 | 421,801 |
| Events in quadrant B | 3,590,261 | 427,321 |
| Events in quadrant C | 3,519,326 | 400,231 |
| Events in quadrant D | 3,610,439 | 401,785 |
| Mode M9 | |||
|---|---|---|---|
| Quadrant | BADHDUFLAG | Total packets | Discarded packets |
| A | 0 | 14 | 0 |
| B | 0 | 15 | 0 |
| C | 0 | 15 | 0 |
| D | 0 | 15 | 0 |
| Mode M0 | |||
|---|---|---|---|
| Quadrant | BADHDUFLAG | Total packets | Discarded packets |
| A | 0 | 15598 | 2 |
| B | 0 | 14546 | 2 |
| C | 0 | 14225 | 2 |
| D | 0 | 14626 | 3 |
| Mode SS | |||
|---|---|---|---|
| Quadrant | BADHDUFLAG | Total packets | Discarded packets |
| A | 0 | 130 | 0 |
| B | 0 | 130 | 0 |
| C | 0 | 130 | 0 |
| D | 0 | 130 | 0 |
| Quadrant | Total seconds | Saturated seconds | Saturation percentage |
|---|---|---|---|
| A | 6370 | 256 | 4.018838% |
| B | 6370 | 138 | 2.166405% |
| C | 6370 | 131 | 2.056515% |
| D | 6369 | 98 | 1.538703% |
Noise dominated data is calculated using 1-second bins in cleaned event files. If a bin has >2000 counts, and if more than 50% of those come from <1% of pixels, then it is considered to be noise-dominated and hence unusable.
| Quadrant | # 1 sec bins | Bins with >0 counts | Bins with >2000 counts | High rate bins dominated by noise | Noise dominated (total time) | Noise dominated (detector-on time) | Marked lightcurve |
|---|---|---|---|---|---|---|---|
| A | 7615 | 6371 | 92 | 92 | 1.21% | 1.44% | 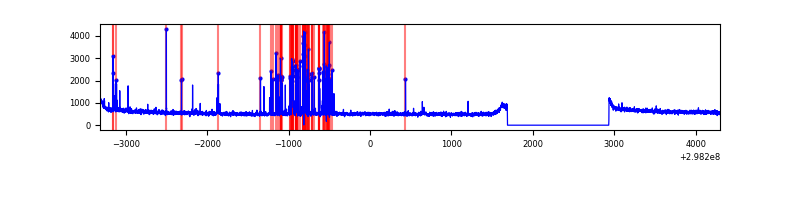 |
| B | 7615 | 6371 | 6 | 6 | 0.08% | 0.09% | 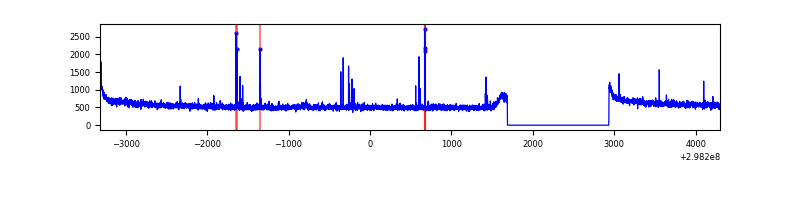 |
| C | 7615 | 6371 | 0 | 0 | 0.00% | 0.00% | 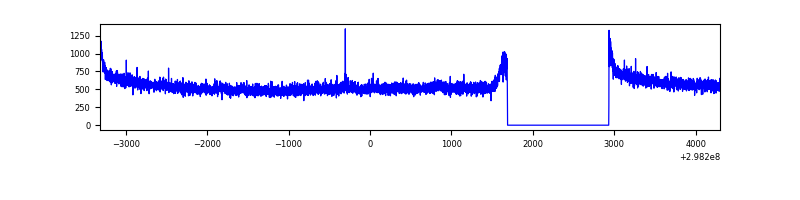 |
| D | 7614 | 6370 | 9 | 9 | 0.12% | 0.14% | 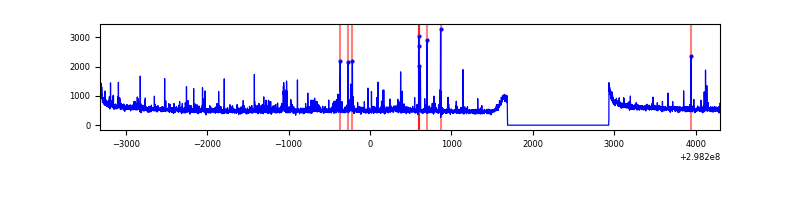 |
Top three noisy pixels from each quadrant. If the there are fewer than three noisy pixels in the level2.evt file, extra rows are filled as -1
| Pixel properties | Quadrant properties | ||||||
|---|---|---|---|---|---|---|---|
| Quadrant | DetID | PixID | Counts | Sigma | Mean | Median | Sigma |
| A | 14 | 238 | 393889 | 2187.64 | 909 | 894 | 179.6 |
| A | 14 | 254 | 9389 | 47.29 | 909 | 894 | 179.6 |
| A | 0 | 226 | 7900 | 39.0 | 909 | 894 | 179.6 |
| B | 4 | 80 | 30007 | 172.42 | 901 | 884 | 168.9 |
| B | 3 | 64 | 22395 | 127.35 | 901 | 884 | 168.9 |
| B | 12 | 111 | 19664 | 111.18 | 901 | 884 | 168.9 |
| C | 14 | 238 | 138441 | 696.02 | 859 | 871 | 197.7 |
| C | 4 | 175 | 19060 | 92.03 | 859 | 871 | 197.7 |
| C | 3 | 233 | 7615 | 34.12 | 859 | 871 | 197.7 |
| D | 1 | 52 | 263256 | 1236.82 | 885 | 859 | 212.2 |
| D | 2 | 234 | 23074 | 104.71 | 885 | 859 | 212.2 |
| D | 14 | 226 | 8731 | 37.11 | 885 | 859 | 212.2 |
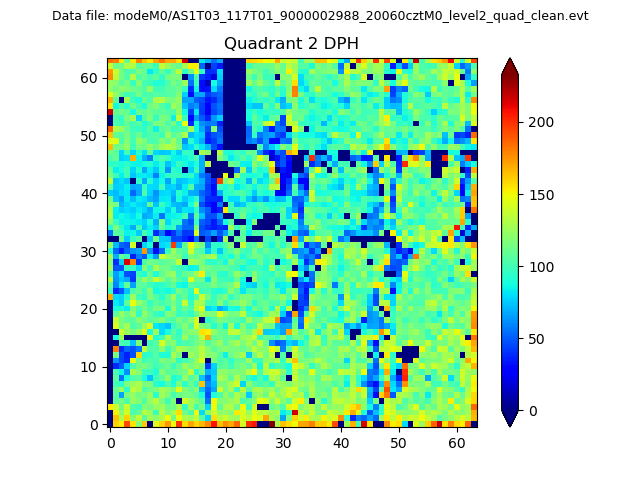
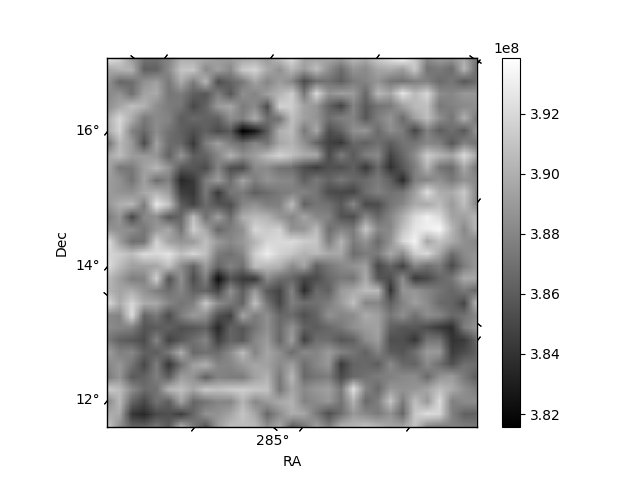
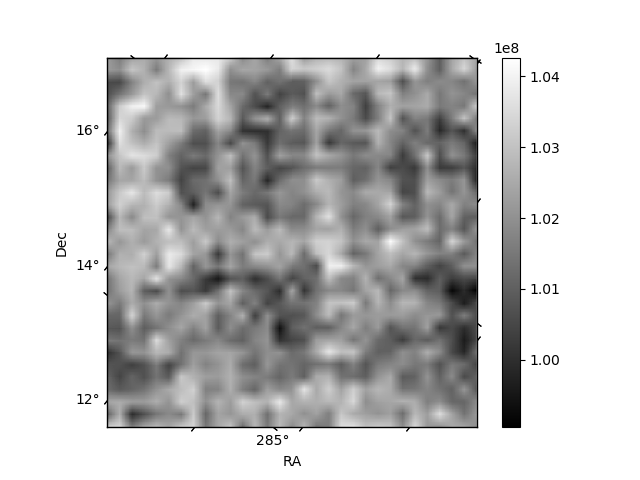
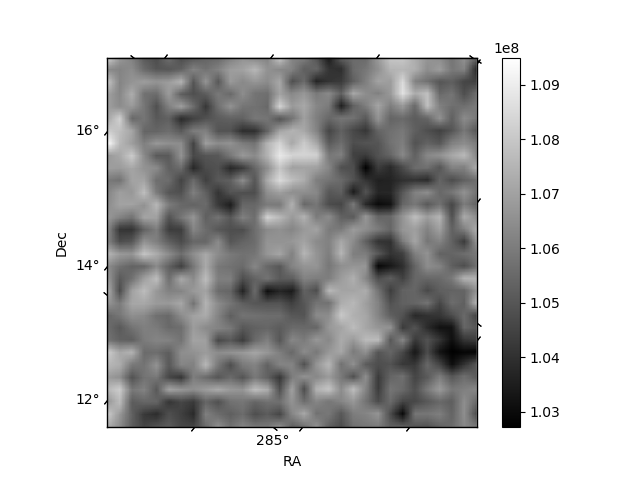
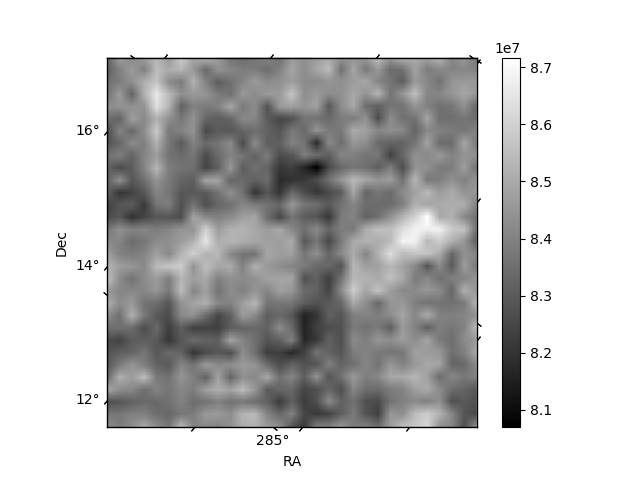
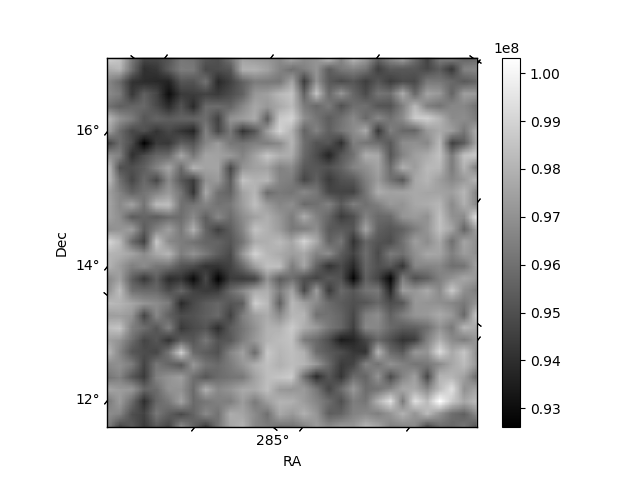
Histogram calculated using DETX and DETY for each event in the final _common_clean file
| Quadrant A | 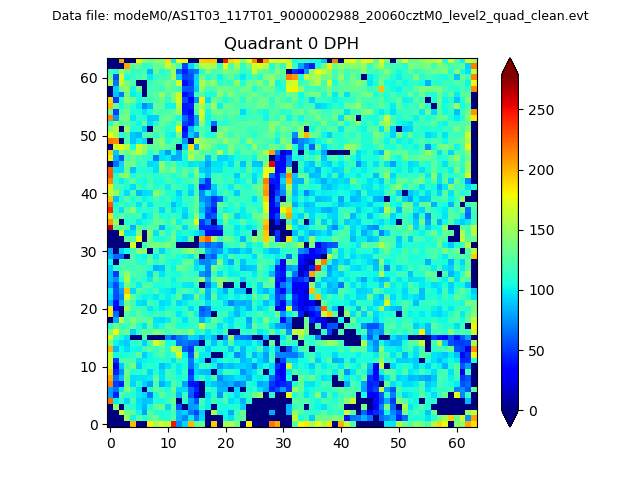 |
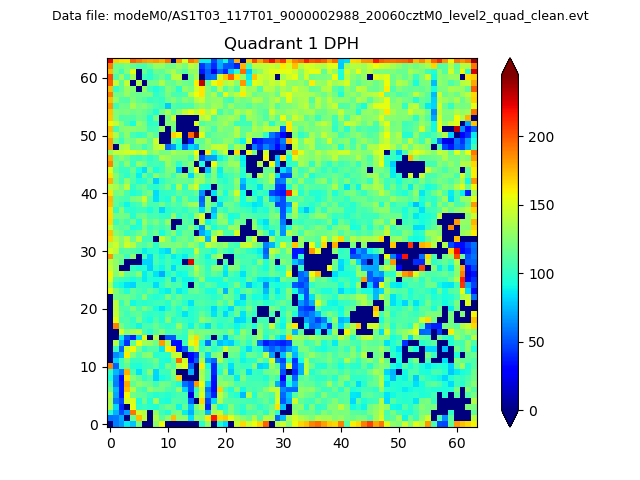 |
Quadrant B |
|---|---|---|---|
| Quadrant D | 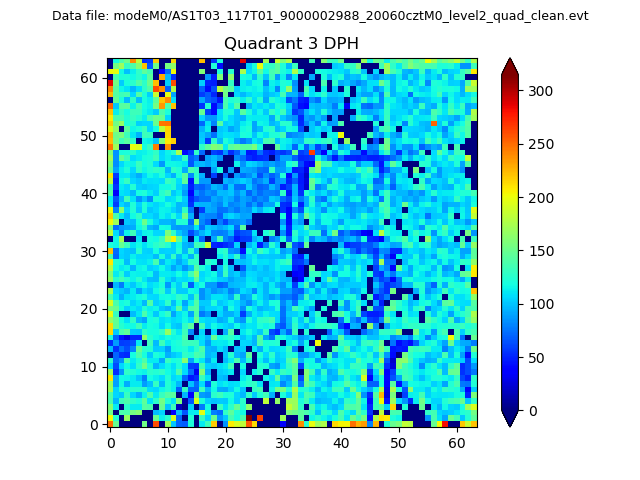 |
 |
Quadrant C |
| Plot type | Count rate plots | Images |
|---|---|---|
| Comparison with Poisson distribution Blue bars denote a histogram of data divided into 1 sec bins. Red curve is a Poisson curve with rate = median count rate of data. |
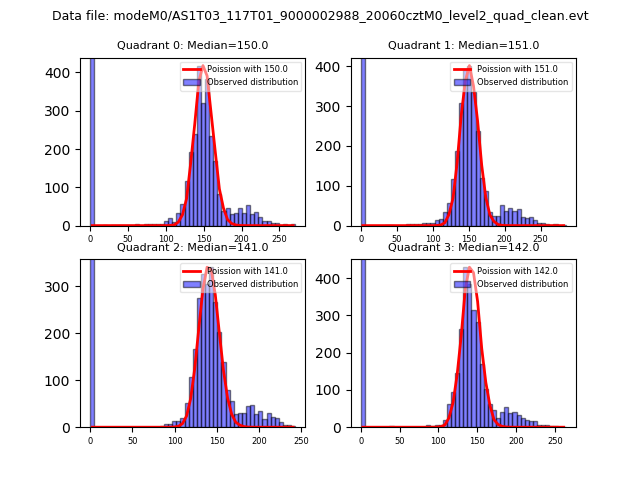 |
 |
| Quadrant-wise count rates Data is divided into 100 sec bins |
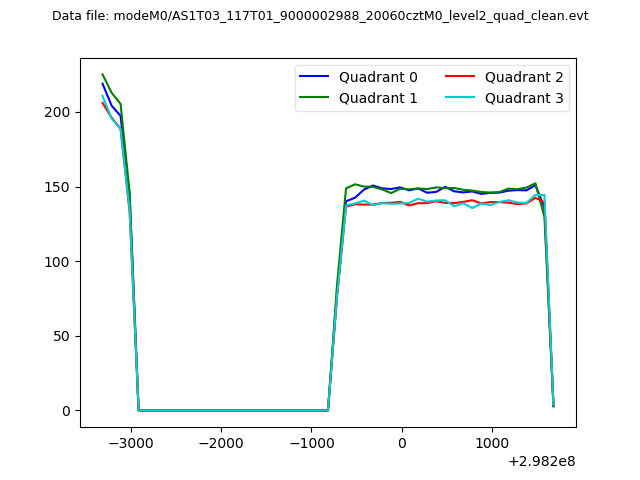 |
|
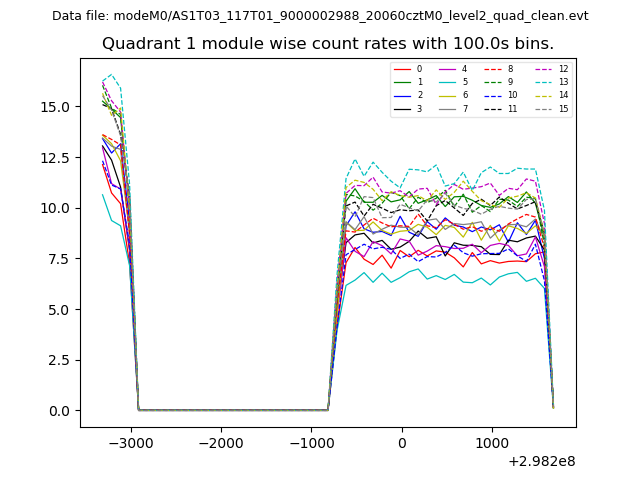
| Module-wise count rates for Quadrant A Data is divided into 100 sec bins |
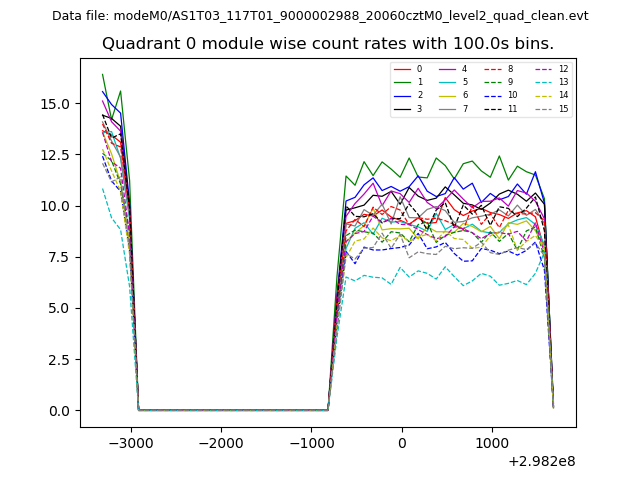 |
 |
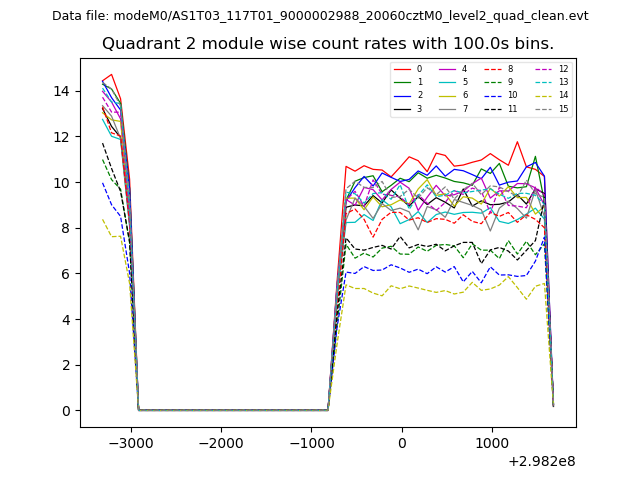
| Module-wise count rates for Quadrant B Data is divided into 100 sec bins |
 |
 |
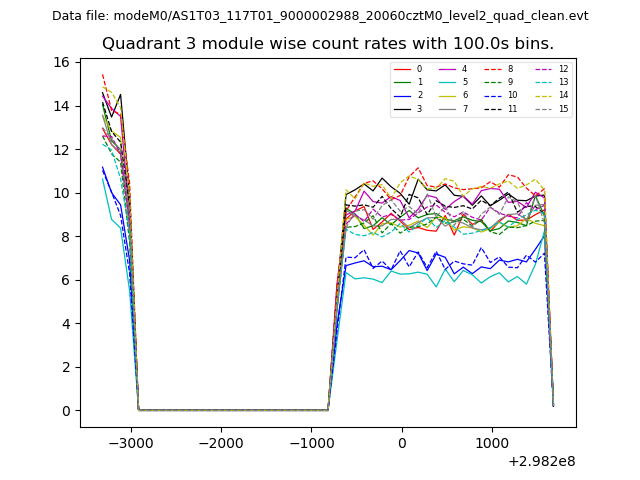
| Module-wise count rates for Quadrant C Data is divided into 100 sec bins |
 |
 |
| Module-wise count rates for Quadrant D Data is divided into 100 sec bins |
 |
 |
| Parameter | Plot |
|---|---|
| CZT HV Monitor | 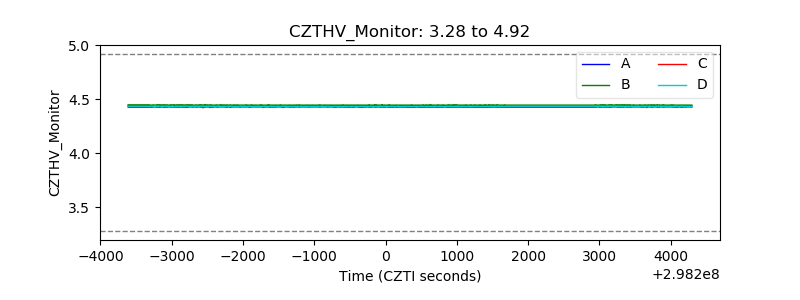 |
| D_VDD | 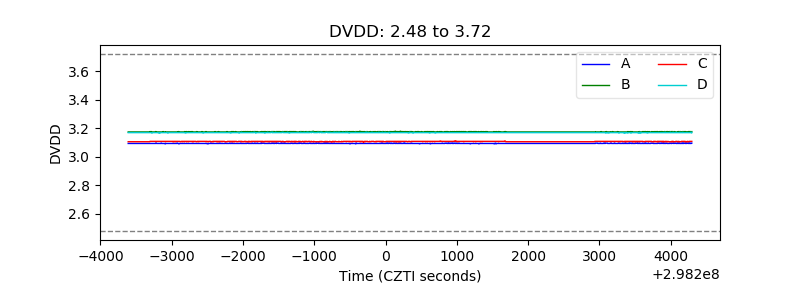 |
| Temperature 1 | 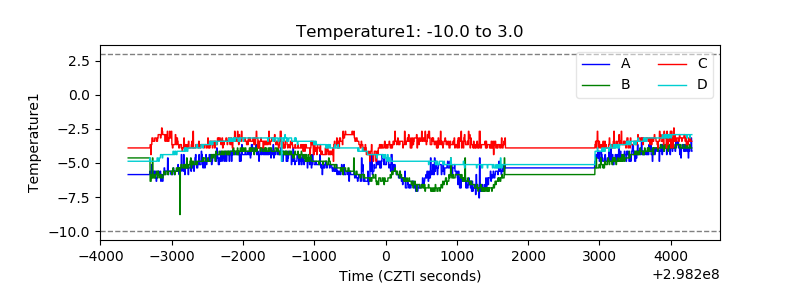 |
| Veto HV Monitor | 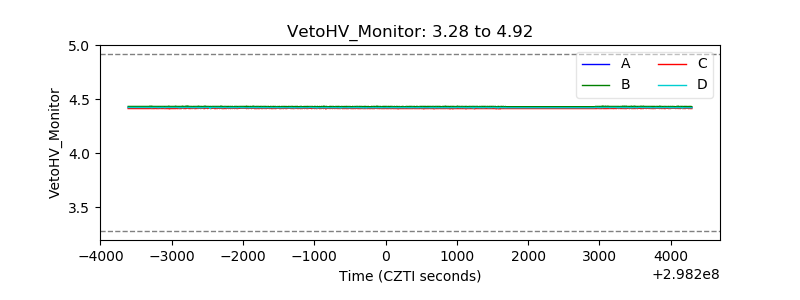 |
| Veto LLD | 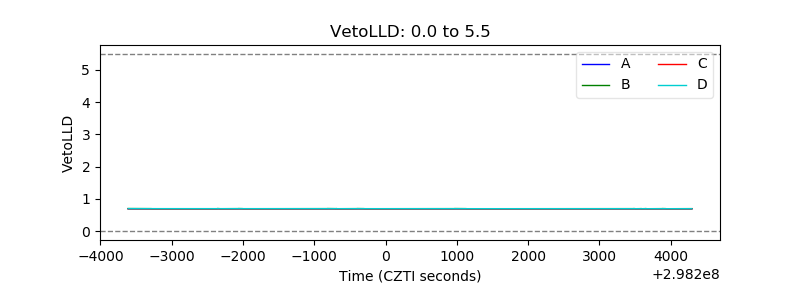 |
| Alpha Counter | 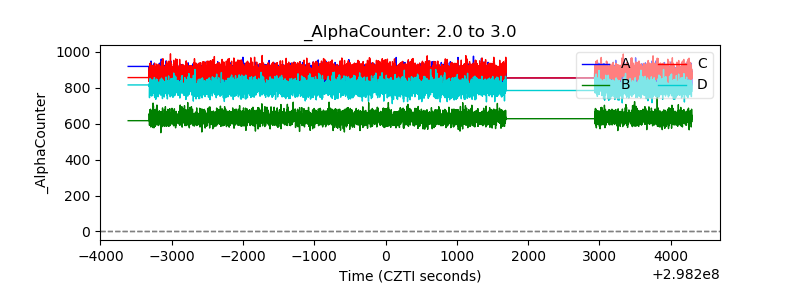 |
| _CPM_Rate | 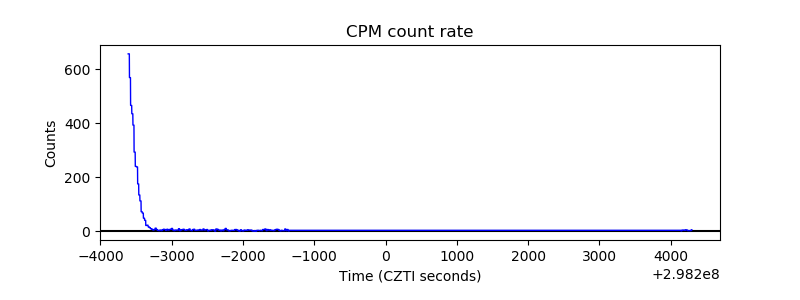 |
| CZT Counter | 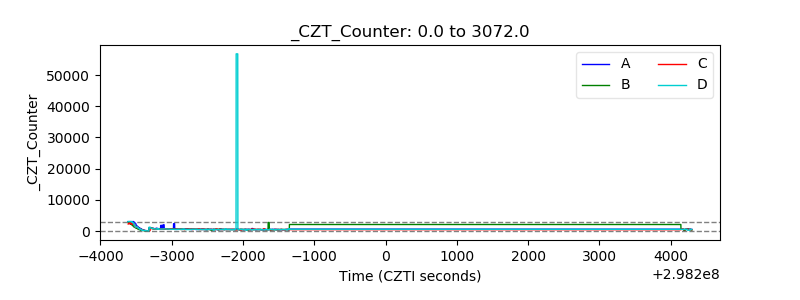 |
| +2.5 Volts monitor | 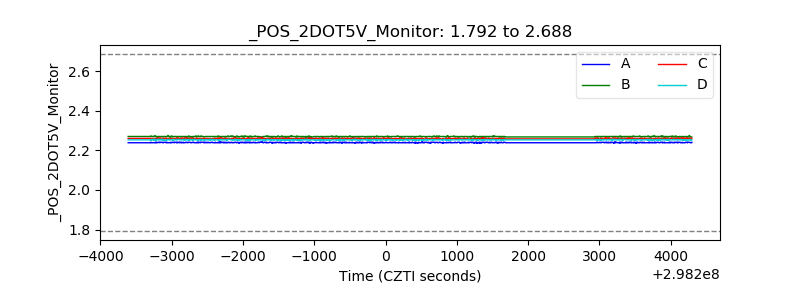 |
| +5 Volts monitor | 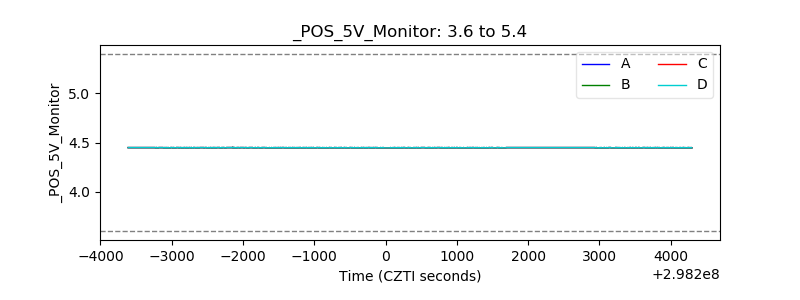 |
| _ROLL_ROT | 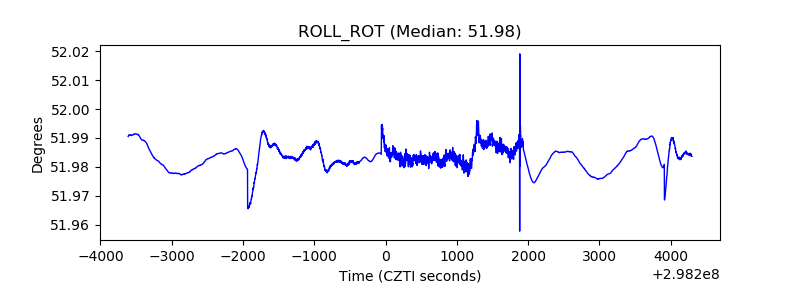 |
| _Roll_DEC | 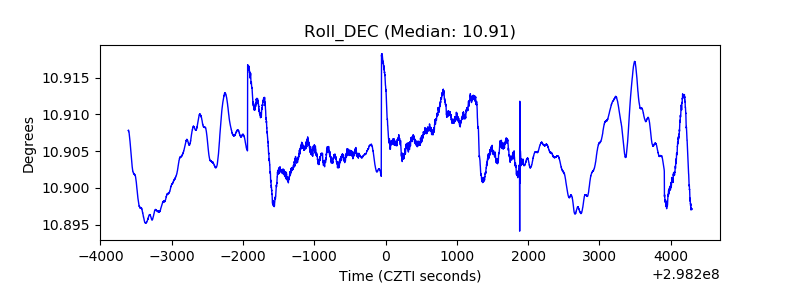 |
| _Roll_RA | 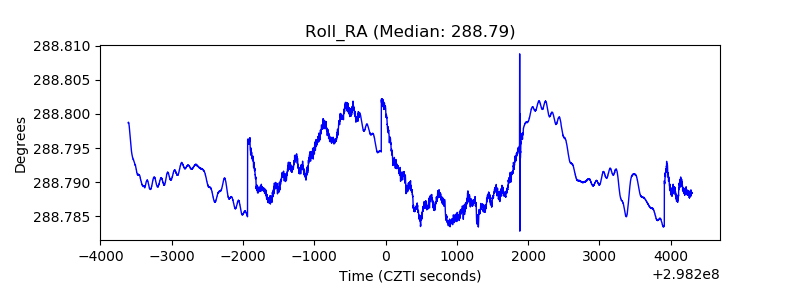 |
| Veto Counter | 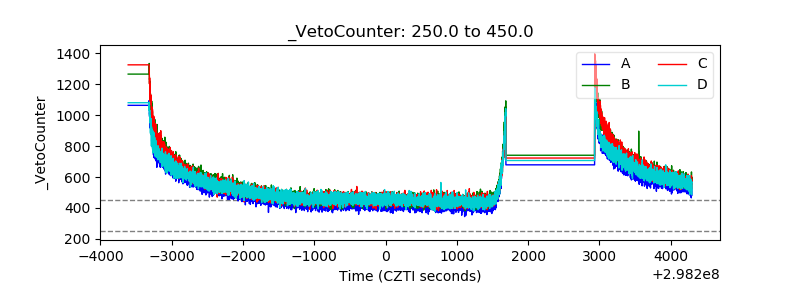 |