| Param | Original file | Final file |
|---|---|---|
| Filename | modeM0/AS1T03_117T01_9000002988_20063cztM0_level2.evt | modeM0/AS1T03_117T01_9000002988_20063cztM0_level2_quad_clean.evt |
| Size (bytes) | 319,406,400 | 68,333,760 |
| Size | 304.6 MB | 65.2 MB |
| Events in quadrant A | 2,334,788 | 450,380 |
| Events in quadrant B | 2,315,876 | 451,648 |
| Events in quadrant C | 2,301,152 | 428,111 |
| Events in quadrant D | 2,421,578 | 429,634 |
| Mode M9 | |||
|---|---|---|---|
| Quadrant | BADHDUFLAG | Total packets | Discarded packets |
| A | 0 | 8 | 0 |
| B | 0 | 9 | 0 |
| C | 0 | 9 | 0 |
| D | 0 | 9 | 0 |
| Mode M0 | |||
|---|---|---|---|
| Quadrant | BADHDUFLAG | Total packets | Discarded packets |
| A | 0 | 9634 | 1 |
| B | 0 | 9503 | 1 |
| C | 0 | 9375 | 1 |
| D | 0 | 10020 | 1 |
| Mode SS | |||
|---|---|---|---|
| Quadrant | BADHDUFLAG | Total packets | Discarded packets |
| A | 0 | 88 | 0 |
| B | 0 | 88 | 0 |
| C | 0 | 88 | 0 |
| D | 0 | 88 | 0 |
| Quadrant | Total seconds | Saturated seconds | Saturation percentage |
|---|---|---|---|
| A | 4398 | 15 | 0.341064% |
| B | 4398 | 22 | 0.500227% |
| C | 4398 | 34 | 0.773079% |
| D | 4398 | 15 | 0.341064% |
Noise dominated data is calculated using 1-second bins in cleaned event files. If a bin has >2000 counts, and if more than 50% of those come from <1% of pixels, then it is considered to be noise-dominated and hence unusable.
| Quadrant | # 1 sec bins | Bins with >0 counts | Bins with >2000 counts | High rate bins dominated by noise | Noise dominated (total time) | Noise dominated (detector-on time) | Marked lightcurve |
|---|---|---|---|---|---|---|---|
| A | 4398 | 4398 | 6 | 6 | 0.14% | 0.14% | 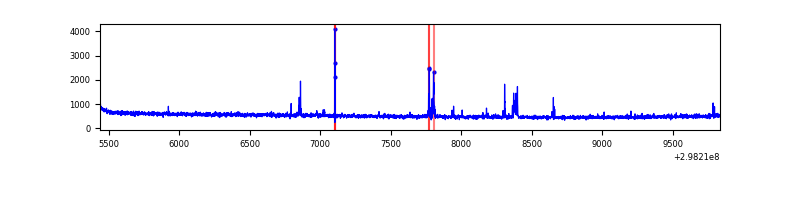 |
| B | 4398 | 4398 | 8 | 8 | 0.18% | 0.18% | 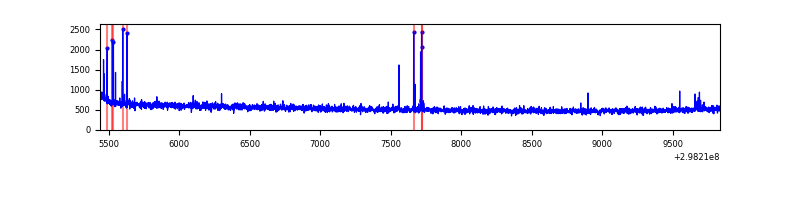 |
| C | 4398 | 4398 | 0 | 0 | 0.00% | 0.00% | 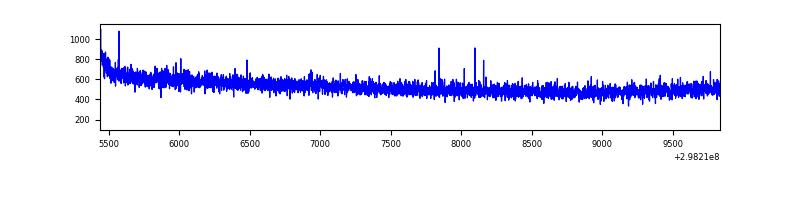 |
| D | 4398 | 4398 | 7 | 7 | 0.16% | 0.16% | 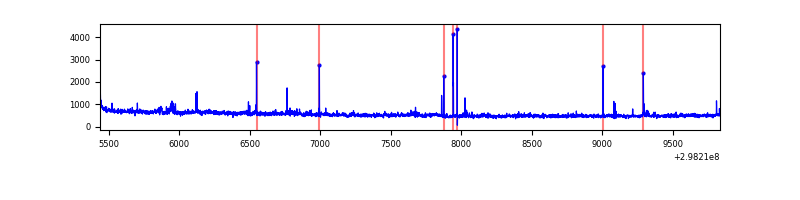 |
Top three noisy pixels from each quadrant. If the there are fewer than three noisy pixels in the level2.evt file, extra rows are filled as -1
| Pixel properties | Quadrant properties | ||||||
|---|---|---|---|---|---|---|---|
| Quadrant | DetID | PixID | Counts | Sigma | Mean | Median | Sigma |
| A | 14 | 254 | 46716 | 393.05 | 587 | 578 | 117.4 |
| A | 14 | 238 | 26598 | 221.67 | 587 | 578 | 117.4 |
| A | 0 | 226 | 4969 | 37.41 | 587 | 578 | 117.4 |
| B | 4 | 80 | 36151 | 321.74 | 583 | 571 | 110.6 |
| B | 12 | 111 | 12703 | 109.71 | 583 | 571 | 110.6 |
| B | 11 | 111 | 11417 | 98.08 | 583 | 571 | 110.6 |
| C | 14 | 238 | 91413 | 692.22 | 565 | 573 | 131.2 |
| C | 13 | 61 | 3918 | 25.49 | 565 | 573 | 131.2 |
| C | 4 | 254 | 3357 | 21.21 | 565 | 573 | 131.2 |
| D | 2 | 184 | 158799 | 1155.08 | 574 | 560 | 137.0 |
| D | 1 | 52 | 80157 | 581.03 | 574 | 560 | 137.0 |
| D | 2 | 234 | 15995 | 112.67 | 574 | 560 | 137.0 |
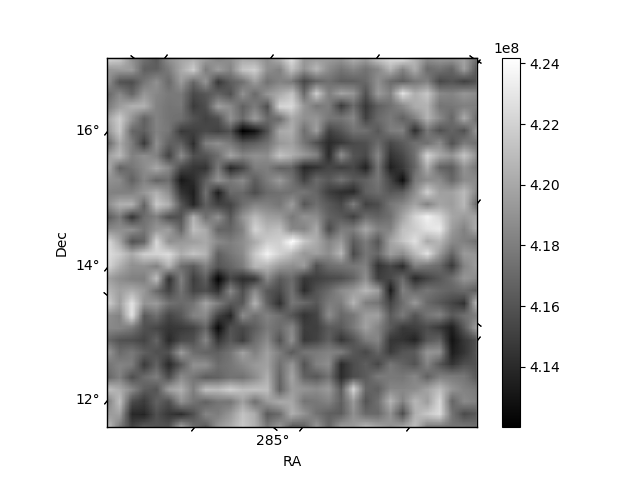
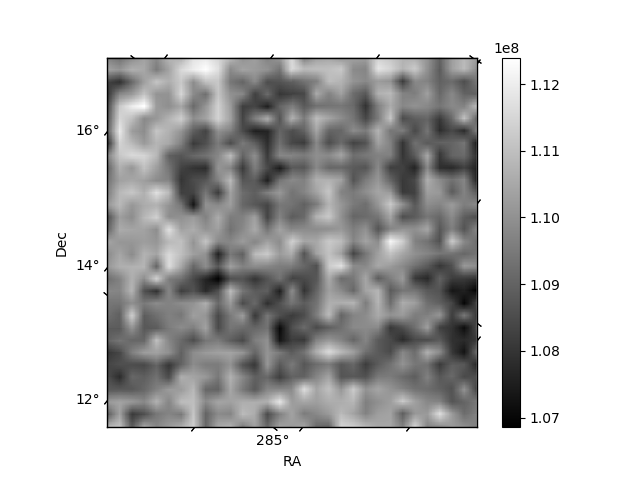
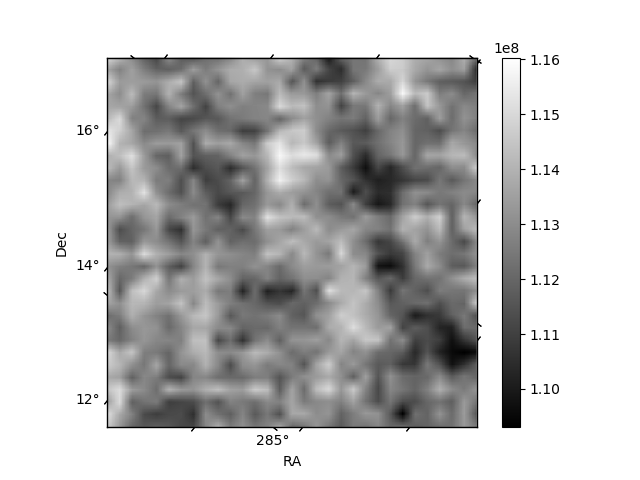
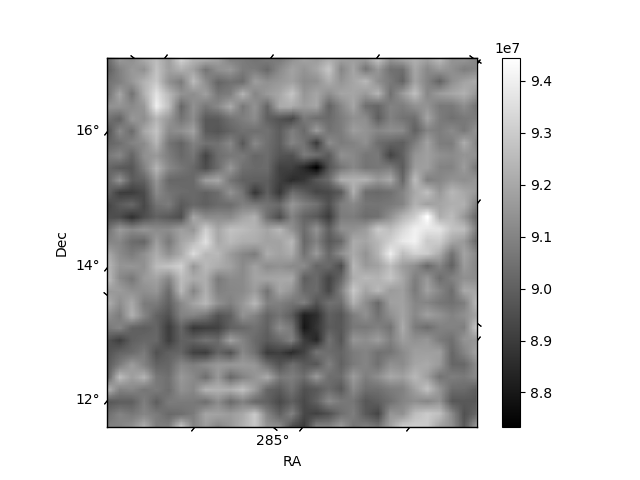
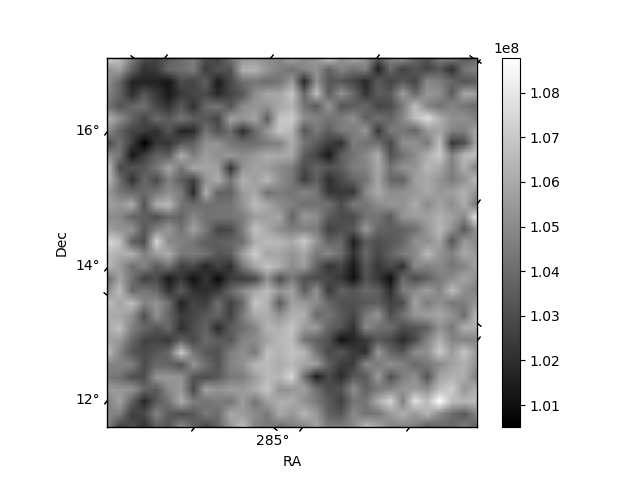
Histogram calculated using DETX and DETY for each event in the final _common_clean file
| Quadrant A | 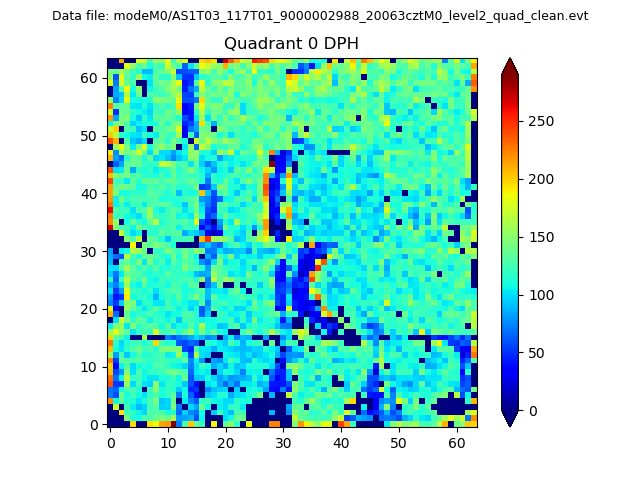 |
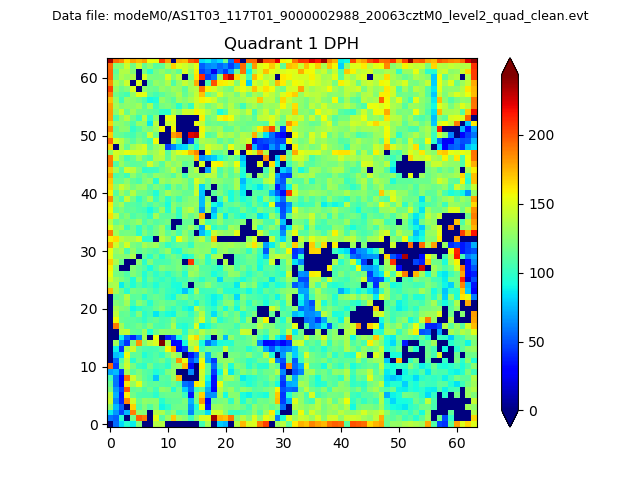 |
Quadrant B |
|---|---|---|---|
| Quadrant D | 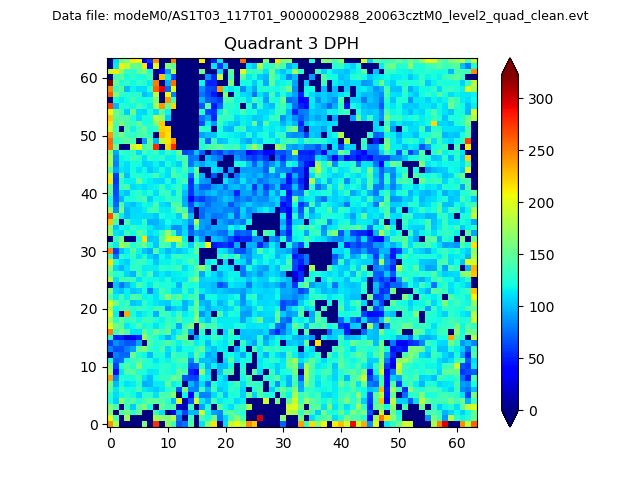 |
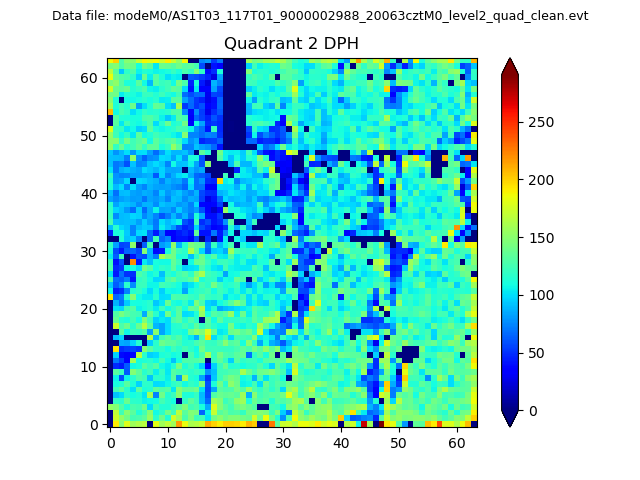 |
Quadrant C |
| Plot type | Count rate plots | Images |
|---|---|---|
| Comparison with Poisson distribution Blue bars denote a histogram of data divided into 1 sec bins. Red curve is a Poisson curve with rate = median count rate of data. |
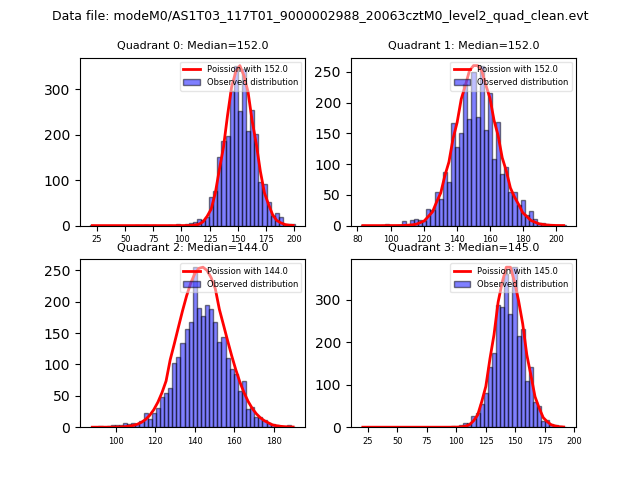 |
 |
| Quadrant-wise count rates Data is divided into 100 sec bins |
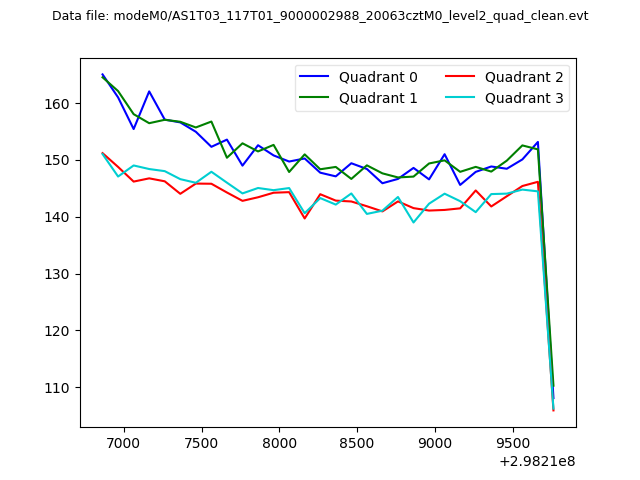 |
|
| Module-wise count rates for Quadrant A Data is divided into 100 sec bins |
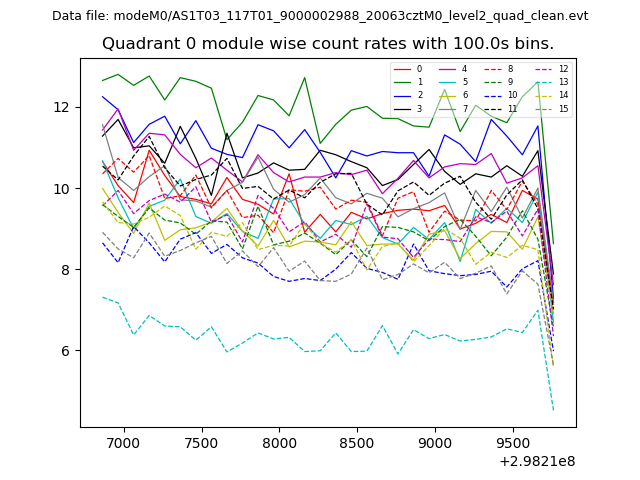 |
 |
| Module-wise count rates for Quadrant B Data is divided into 100 sec bins |
 |
 |
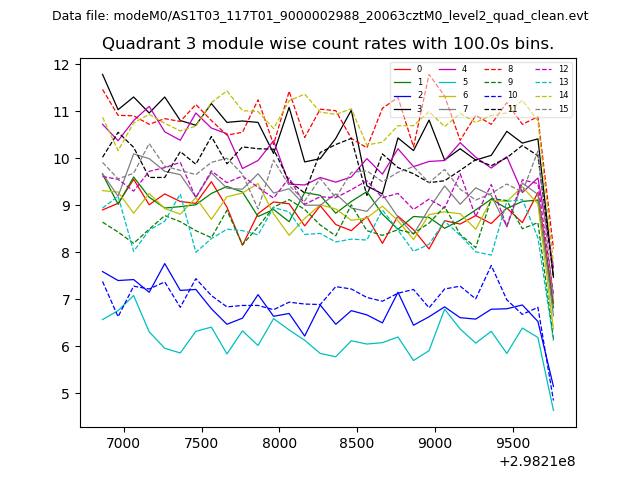
| Module-wise count rates for Quadrant C Data is divided into 100 sec bins |
 |
 |
| Module-wise count rates for Quadrant D Data is divided into 100 sec bins |
 |
 |
| Parameter | Plot |
|---|---|
| CZT HV Monitor |  |
| D_VDD | 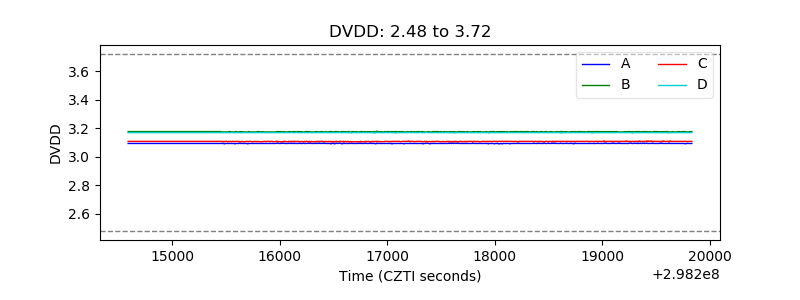 |
| Temperature 1 | 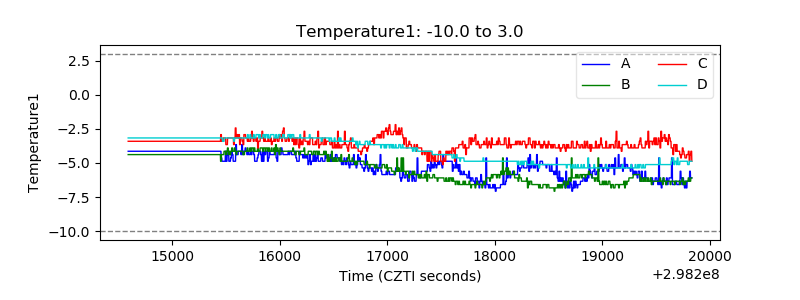 |
| Veto HV Monitor | 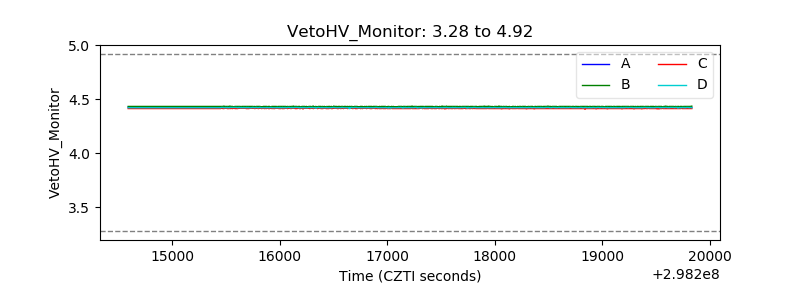 |
| Veto LLD | 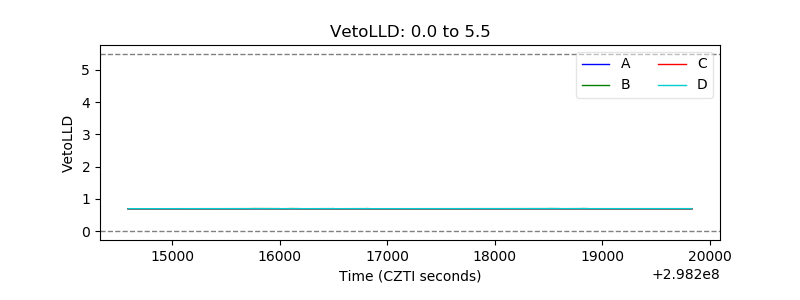 |
| Alpha Counter | 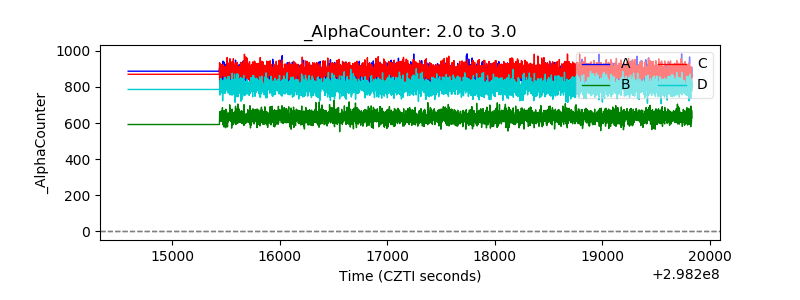 |
| _CPM_Rate | 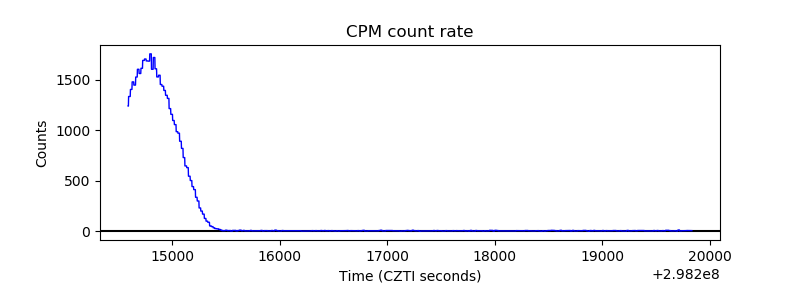 |
| CZT Counter | 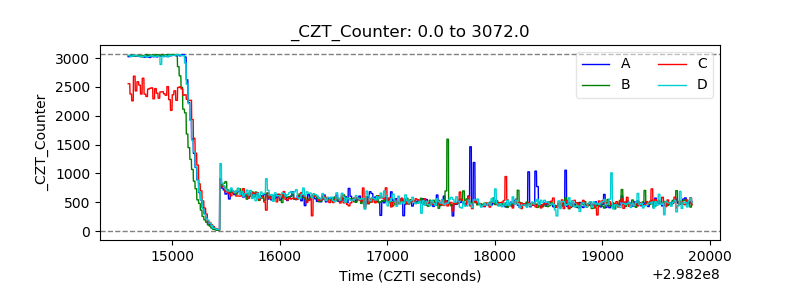 |
| +2.5 Volts monitor | 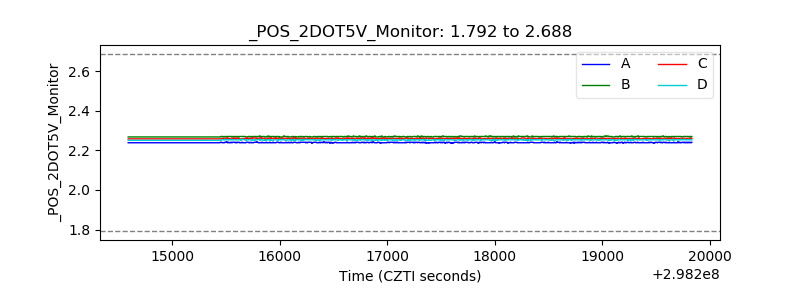 |
| +5 Volts monitor |  |
| _ROLL_ROT | 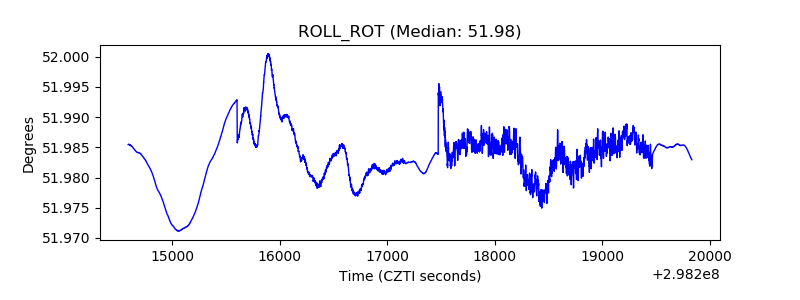 |
| _Roll_DEC | 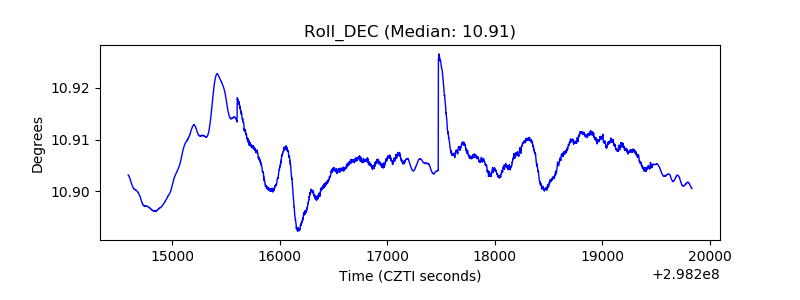 |
| _Roll_RA | 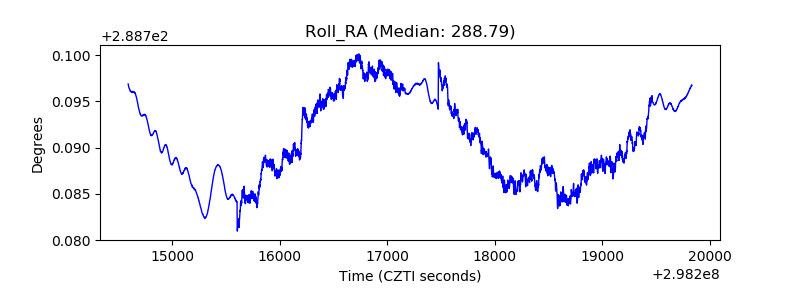 |
| Veto Counter |  |