| Param | Original file | Final file |
|---|---|---|
| Filename | modeM0/AS1T03_120T01_9000002990cztM0_level2.fits | modeM0/AS1T03_120T01_9000002990cztM0_level2_quad_clean.evt |
| Size (bytes) | 533,704,320 | 713,327,040 |
| Size | 509.0 MB | 680.3 MB |
| Events in quadrant A | 3,273,416 | 4,722,294 |
| Events in quadrant B | 3,159,220 | 4,723,520 |
| Events in quadrant C | 3,238,640 | 4,545,238 |
| Events in quadrant D | 2,718,220 | 3,843,806 |
| Mode SS | |||
|---|---|---|---|
| Quadrant | BADHDUFLAG | Total packets | Discarded packets |
| A | 0 | 1116 | 0 |
| B | 0 | 1116 | 0 |
| C | 0 | 1116 | 0 |
| D | 0 | 1116 | 0 |
| Mode M9 | |||
|---|---|---|---|
| Quadrant | BADHDUFLAG | Total packets | Discarded packets |
| A | 0 | 63 | 0 |
| B | 0 | 63 | 0 |
| C | 0 | 63 | 0 |
| D | 0 | 63 | 0 |
| Mode M0 | |||
|---|---|---|---|
| Quadrant | BADHDUFLAG | Total packets | Discarded packets |
| A | 0 | 131911 | 0 |
| B | 0 | 126728 | 0 |
| C | 0 | 113922 | 0 |
| D | 0 | 177070 | 0 |
| Quadrant | Total seconds | Saturated seconds | Saturation percentage |
|---|---|---|---|
| A | 54973 | 2395 | 4.356684% |
| B | 54973 | 1186 | 2.157423% |
| C | 54973 | 652 | 1.186037% |
| D | 54973 | 4620 | 8.404126% |
Noise dominated data is calculated using 1-second bins in cleaned event files. If a bin has >2000 counts, and if more than 50% of those come from <1% of pixels, then it is considered to be noise-dominated and hence unusable.
| Quadrant | # 1 sec bins | Bins with >0 counts | Bins with >2000 counts | High rate bins dominated by noise | Noise dominated (total time) | Noise dominated (detector-on time) | Marked lightcurve |
|---|---|---|---|---|---|---|---|
| A | 60852 | 54945 | 0 | 0 | 0.00% | 0.00% |  |
| B | 60852 | 54967 | 0 | 0 | 0.00% | 0.00% |  |
| C | 60852 | 54972 | 0 | 0 | 0.00% | 0.00% |  |
| D | 60852 | 54963 | 0 | 0 | 0.00% | 0.00% |  |
Top three noisy pixels from each quadrant. If the there are fewer than three noisy pixels in the level2.evt file, extra rows are filled as -1
| Pixel properties | Quadrant properties | ||||||
|---|---|---|---|---|---|---|---|
| Quadrant | DetID | PixID | Counts | Sigma | Mean | Median | Sigma |
| A | 14 | 188 | 3577 | 13.17 | 851 | 802 | 210.6 |
| A | 0 | 29 | 3243 | 11.59 | 851 | 802 | 210.6 |
| A | 14 | 204 | 3030 | 10.58 | 851 | 802 | 210.6 |
| B | 2 | 9 | 2484 | 10.11 | 836 | 801 | 166.4 |
| B | 2 | 8 | 2102 | 7.82 | 836 | 801 | 166.4 |
| B | 3 | 17 | 2087 | 7.73 | 836 | 801 | 166.4 |
| C | 2 | 191 | 2240 | 6.56 | 855 | 805 | 218.9 |
| C | 3 | 126 | 2238 | 6.55 | 855 | 805 | 218.9 |
| C | 12 | 241 | 2230 | 6.51 | 855 | 805 | 218.9 |
| D | 4 | 246 | 2138 | 6.81 | 776 | 709 | 209.9 |
| D | 3 | 14 | 2051 | 6.39 | 776 | 709 | 209.9 |
| D | 15 | 46 | 1987 | 6.09 | 776 | 709 | 209.9 |
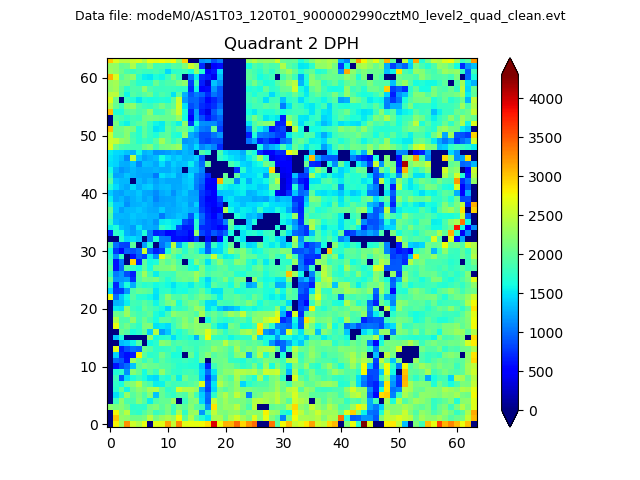
Histogram calculated using DETX and DETY for each event in the final _common_clean file
| Quadrant A |  |
 |
Quadrant B |
|---|---|---|---|
| Quadrant D | 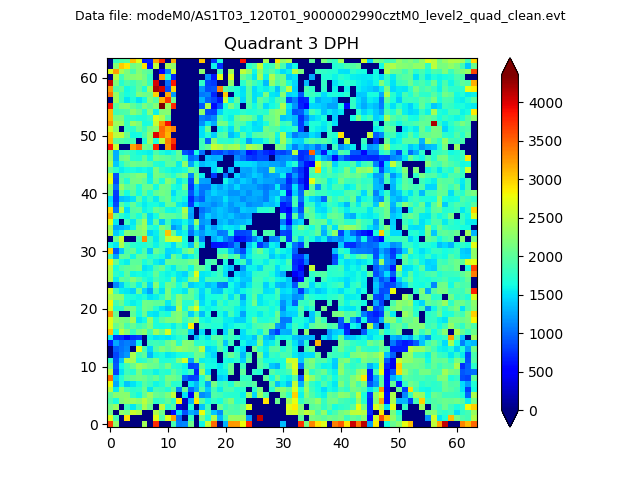 |
 |
Quadrant C |
| Plot type | Count rate plots | Images |
|---|---|---|
| Comparison with Poisson distribution Blue bars denote a histogram of data divided into 1 sec bins. Red curve is a Poisson curve with rate = median count rate of data. |
 |
 |
| Quadrant-wise count rates Data is divided into 100 sec bins |
 |
|
| Module-wise count rates for Quadrant A Data is divided into 100 sec bins |
 |
 |
| Module-wise count rates for Quadrant B Data is divided into 100 sec bins |
 |
 |
| Module-wise count rates for Quadrant C Data is divided into 100 sec bins |
 |
 |
| Module-wise count rates for Quadrant D Data is divided into 100 sec bins |
 |
 |
| Parameter | Plot |
|---|---|
| CZT HV Monitor |  |
| D_VDD |  |
| Temperature 1 |  |
| Veto HV Monitor |  |
| Veto LLD |  |
| Alpha Counter | 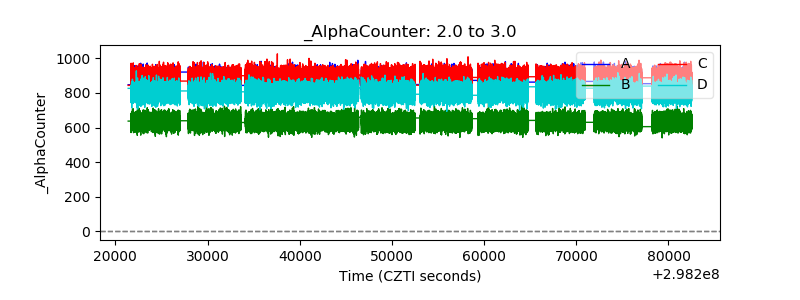 |
| _CPM_Rate |  |
| CZT Counter |  |
| +2.5 Volts monitor |  |
| +5 Volts monitor |  |
| _ROLL_ROT |  |
| _Roll_DEC |  |
| _Roll_RA |  |
| Veto Counter |  |