| Param | Original file | Final file |
|---|---|---|
| Filename | modeM0/AS1T03_120T01_9000002990_20063cztM0_level2.evt | modeM0/AS1T03_120T01_9000002990_20063cztM0_level2_quad_clean.evt |
| Size (bytes) | 131,008,320 | 37,560,960 |
| Size | 124.9 MB | 35.8 MB |
| Events in quadrant A | 852,122 | 261,758 |
| Events in quadrant B | 919,293 | 264,165 |
| Events in quadrant C | 835,669 | 252,337 |
| Events in quadrant D | 1,250,534 | 242,236 |
| Mode SS | |||
|---|---|---|---|
| Quadrant | BADHDUFLAG | Total packets | Discarded packets |
| A | 0 | 32 | 0 |
| B | 0 | 32 | 0 |
| C | 0 | 32 | 0 |
| D | 0 | 32 | 0 |
| Mode M9 | |||
|---|---|---|---|
| Quadrant | BADHDUFLAG | Total packets | Discarded packets |
| A | 0 | 3 | 0 |
| B | 0 | 3 | 0 |
| C | 0 | 3 | 0 |
| D | 0 | 3 | 0 |
| Mode M0 | |||
|---|---|---|---|
| Quadrant | BADHDUFLAG | Total packets | Discarded packets |
| A | 0 | 3417 | 1 |
| B | 0 | 3708 | 1 |
| C | 0 | 3391 | 1 |
| D | 0 | 4773 | 1 |
| Quadrant | Total seconds | Saturated seconds | Saturation percentage |
|---|---|---|---|
| A | 1579 | 5 | 0.316656% |
| B | 1579 | 10 | 0.633312% |
| C | 1579 | 15 | 0.949968% |
| D | 1579 | 84 | 5.319823% |
Noise dominated data is calculated using 1-second bins in cleaned event files. If a bin has >2000 counts, and if more than 50% of those come from <1% of pixels, then it is considered to be noise-dominated and hence unusable.
| Quadrant | # 1 sec bins | Bins with >0 counts | Bins with >2000 counts | High rate bins dominated by noise | Noise dominated (total time) | Noise dominated (detector-on time) | Marked lightcurve |
|---|---|---|---|---|---|---|---|
| A | 1579 | 1579 | 1 | 1 | 0.06% | 0.06% | 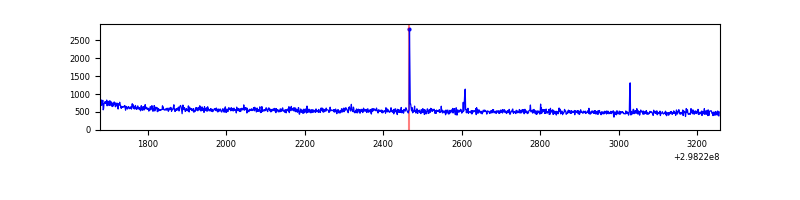 |
| B | 1579 | 1579 | 2 | 2 | 0.13% | 0.13% | 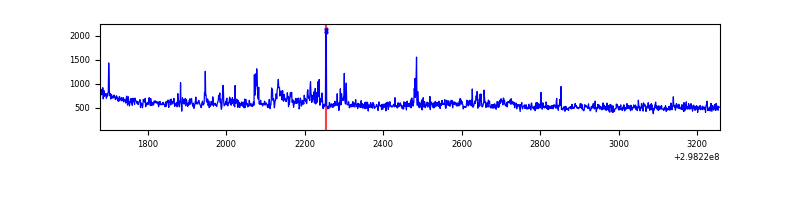 |
| C | 1579 | 1579 | 0 | 0 | 0.00% | 0.00% | 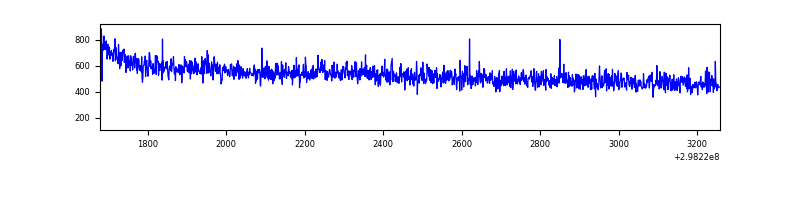 |
| D | 1579 | 1579 | 69 | 69 | 4.37% | 4.37% | 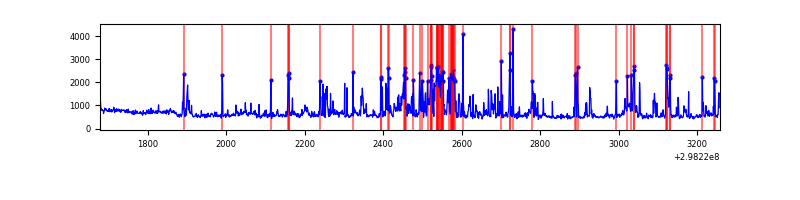 |
Top three noisy pixels from each quadrant. If the there are fewer than three noisy pixels in the level2.evt file, extra rows are filled as -1
| Pixel properties | Quadrant properties | ||||||
|---|---|---|---|---|---|---|---|
| Quadrant | DetID | PixID | Counts | Sigma | Mean | Median | Sigma |
| A | 11 | 29 | 4767 | 100.01 | 218 | 215 | 45.5 |
| A | 14 | 238 | 2947 | 60.03 | 218 | 215 | 45.5 |
| A | 5 | 16 | 2158 | 42.69 | 218 | 215 | 45.5 |
| B | 0 | 190 | 22811 | 528.36 | 216 | 212 | 42.8 |
| B | 4 | 216 | 22495 | 520.98 | 216 | 212 | 42.8 |
| B | 4 | 171 | 6172 | 139.34 | 216 | 212 | 42.8 |
| C | 14 | 238 | 33134 | 680.28 | 203 | 205 | 48.4 |
| C | 4 | 175 | 3811 | 74.5 | 203 | 205 | 48.4 |
| C | 4 | 254 | 2409 | 45.53 | 203 | 205 | 48.4 |
| D | 1 | 52 | 149594 | 2913.01 | 207 | 202 | 51.3 |
| D | 12 | 218 | 127257 | 2477.46 | 207 | 202 | 51.3 |
| D | 7 | 38 | 59209 | 1150.59 | 207 | 202 | 51.3 |
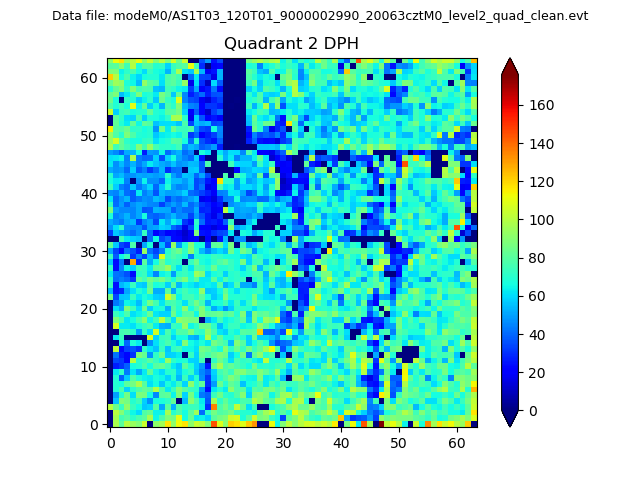
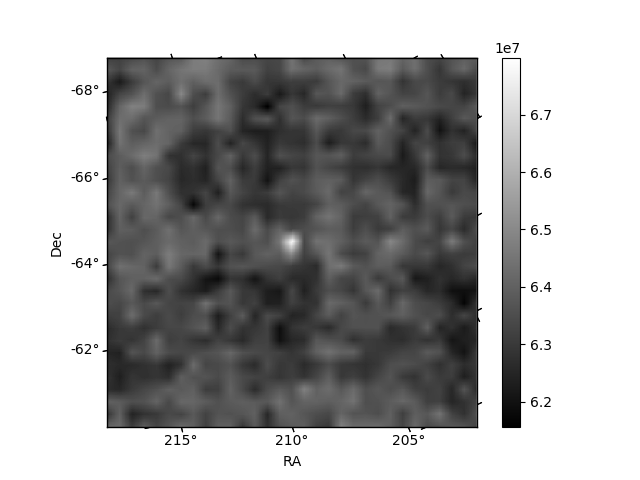
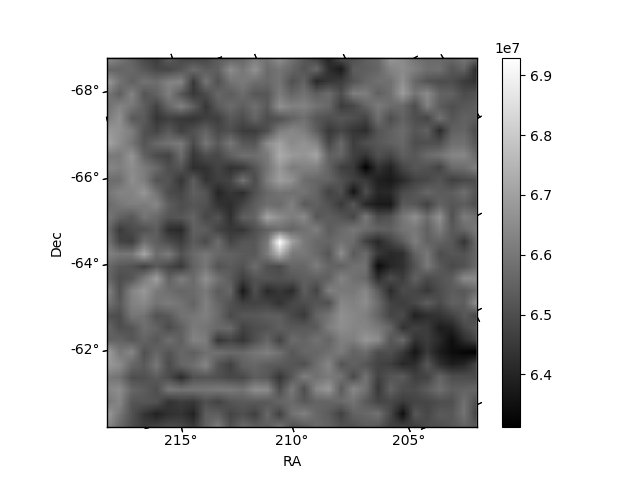
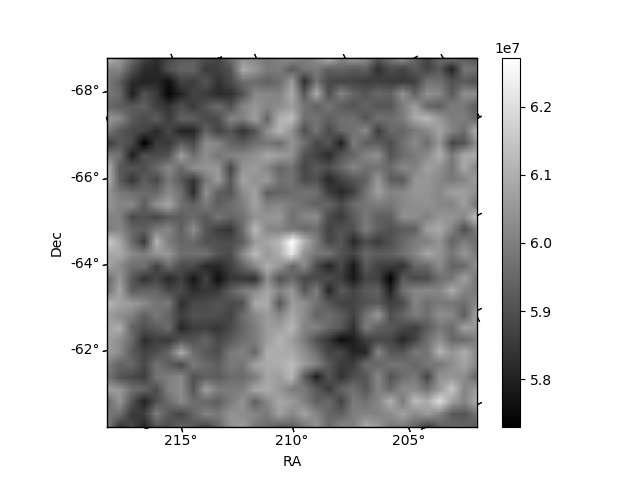
Histogram calculated using DETX and DETY for each event in the final _common_clean file
| Quadrant A | 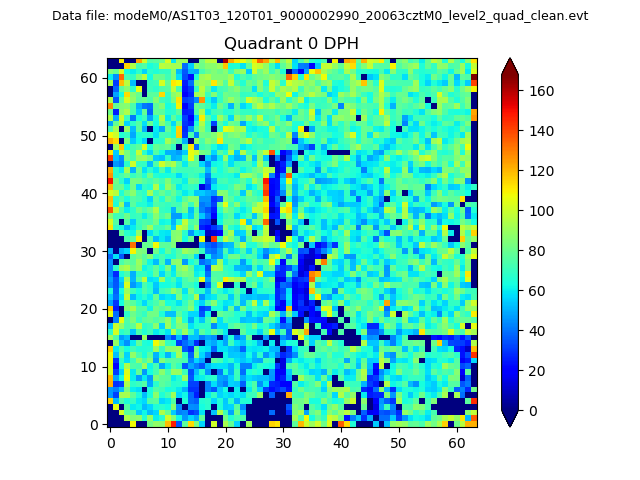 |
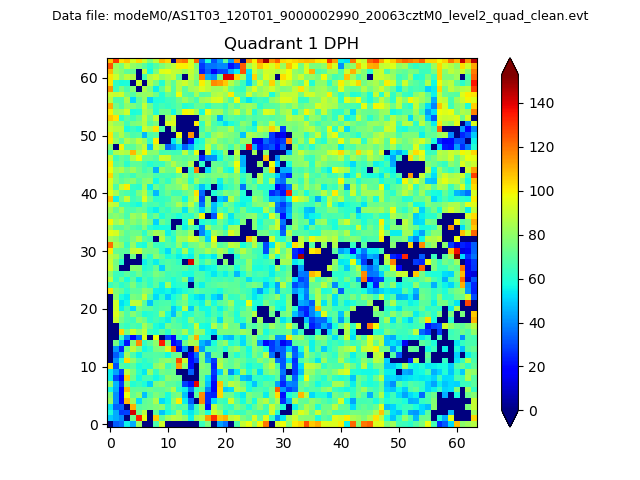 |
Quadrant B |
|---|---|---|---|
| Quadrant D | 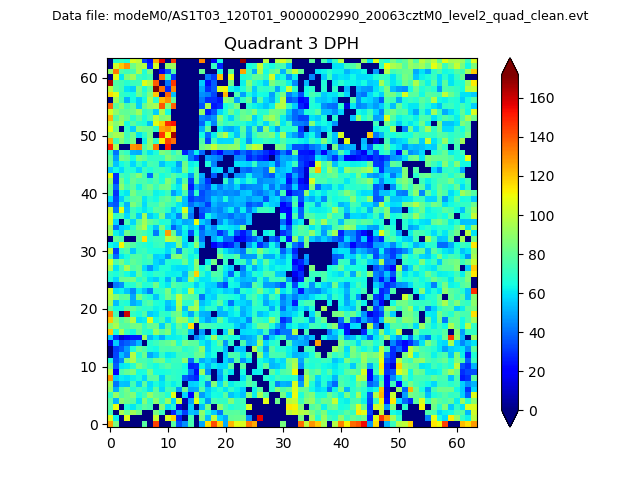 |
 |
Quadrant C |
| Plot type | Count rate plots | Images |
|---|---|---|
| Comparison with Poisson distribution Blue bars denote a histogram of data divided into 1 sec bins. Red curve is a Poisson curve with rate = median count rate of data. |
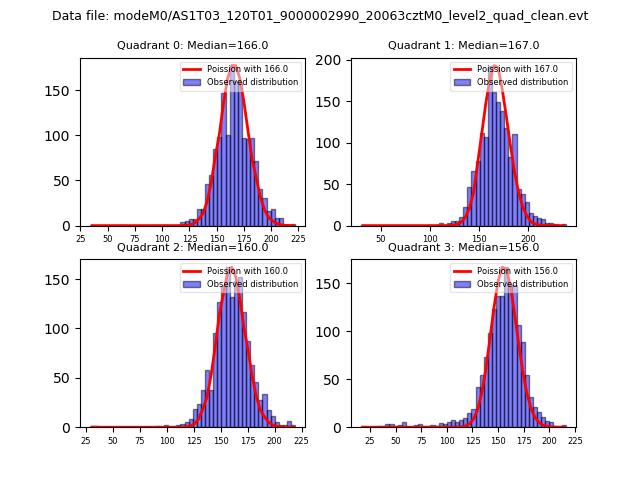 |
 |
| Quadrant-wise count rates Data is divided into 100 sec bins |
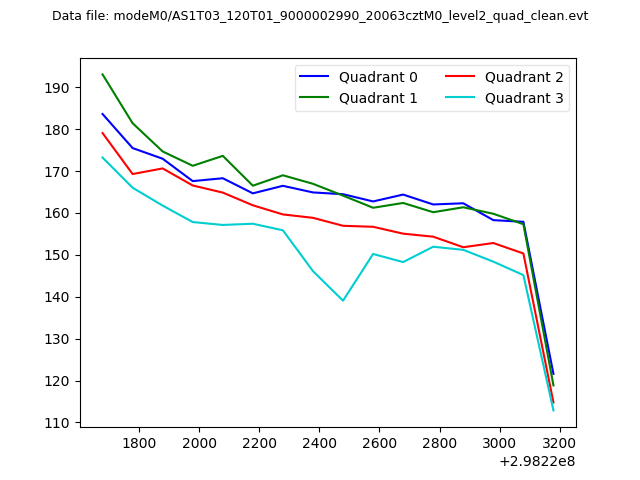 |
|
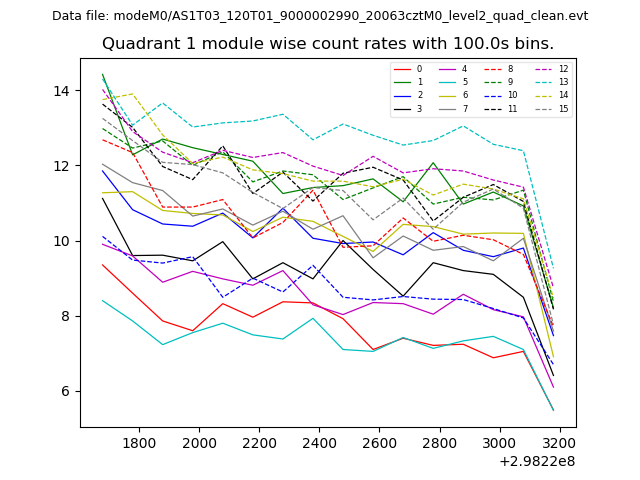
| Module-wise count rates for Quadrant A Data is divided into 100 sec bins |
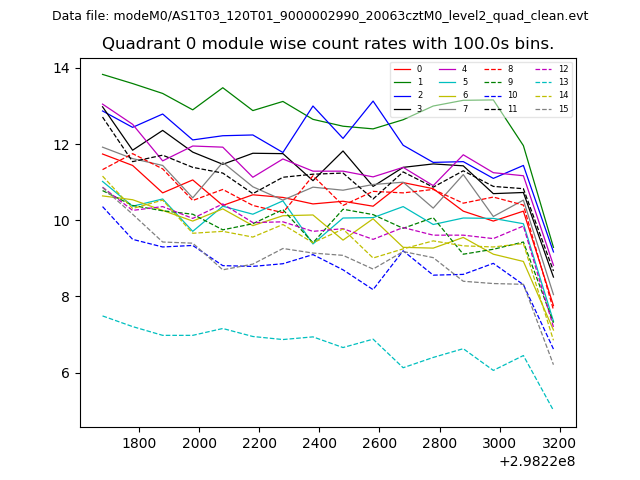 |
 |
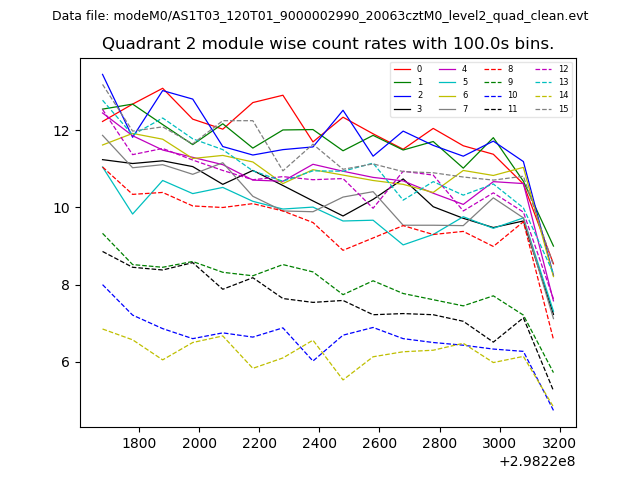
| Module-wise count rates for Quadrant B Data is divided into 100 sec bins |
 |
 |
| Module-wise count rates for Quadrant C Data is divided into 100 sec bins |
 |
 |
| Module-wise count rates for Quadrant D Data is divided into 100 sec bins |
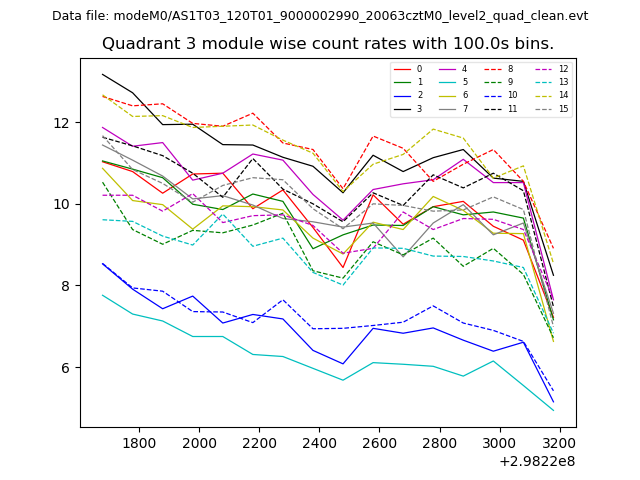 |
 |
| Parameter | Plot |
|---|---|
| CZT HV Monitor | 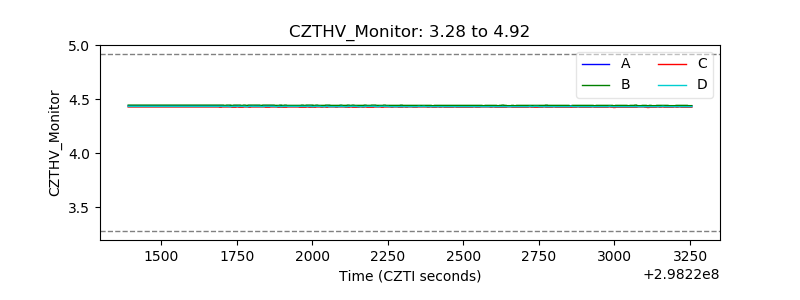 |
| D_VDD | 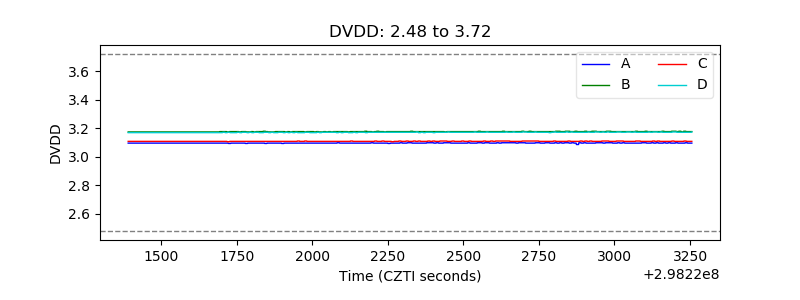 |
| Temperature 1 | 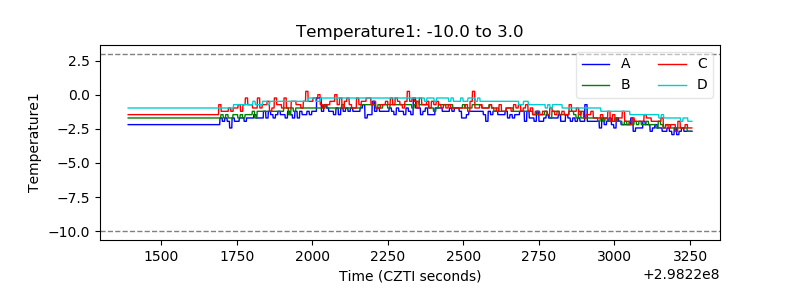 |
| Veto HV Monitor | 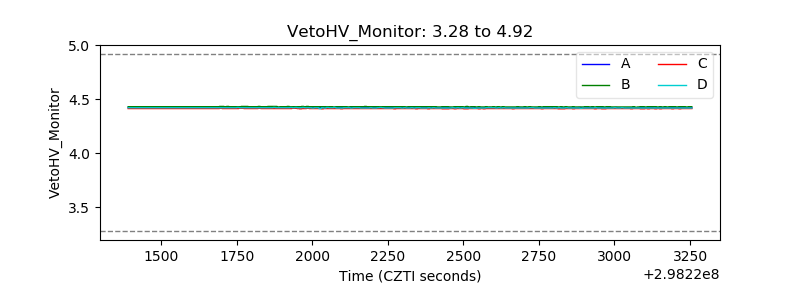 |
| Veto LLD | 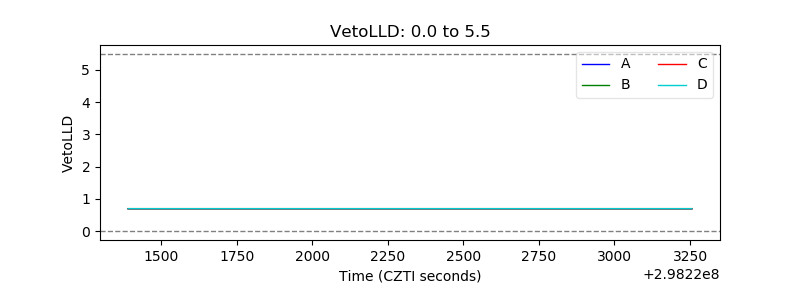 |
| Alpha Counter | 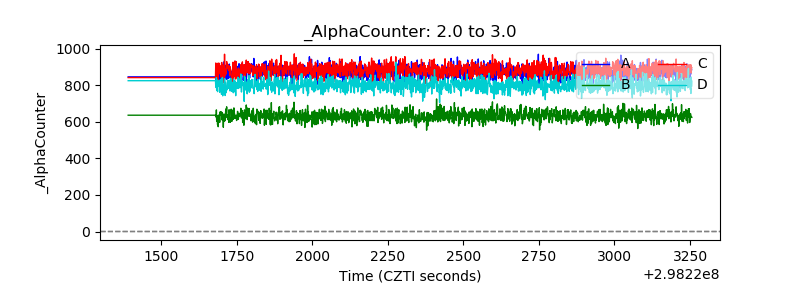 |
| _CPM_Rate | 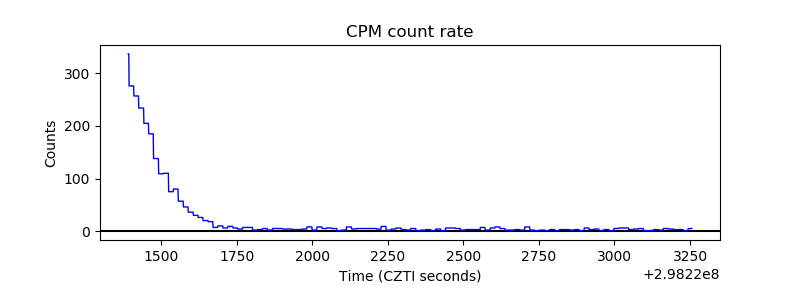 |
| CZT Counter | 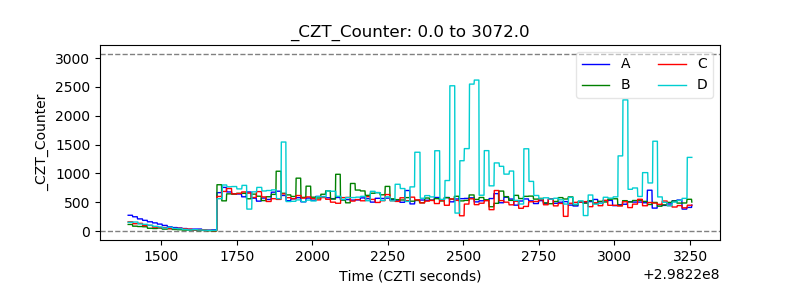 |
| +2.5 Volts monitor |  |
| +5 Volts monitor |  |
| _ROLL_ROT | 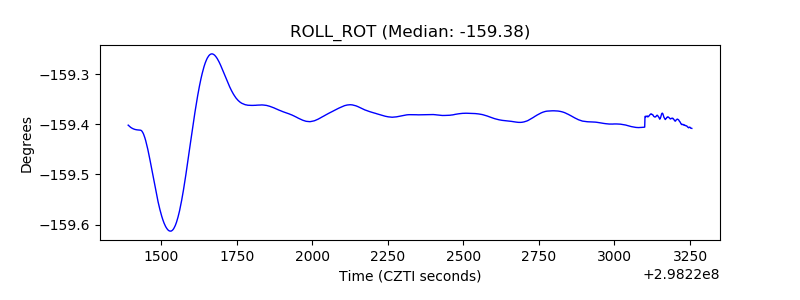 |
| _Roll_DEC | 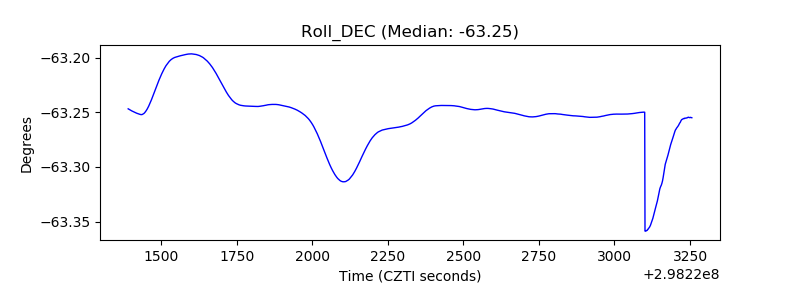 |
| _Roll_RA | 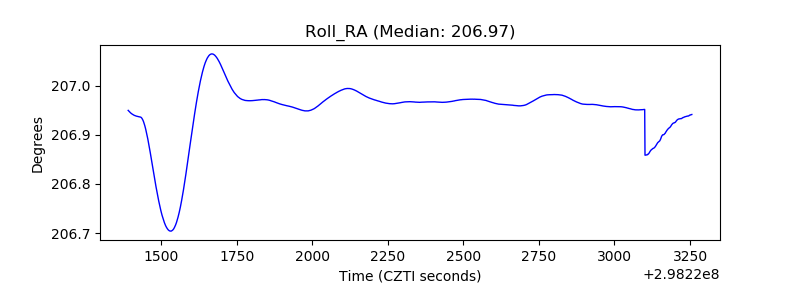 |
| Veto Counter | 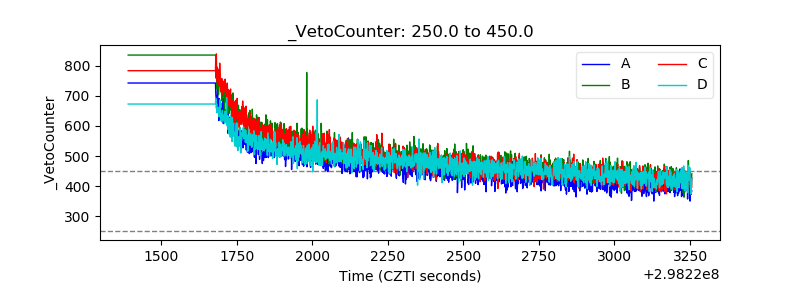 |