| Param | Original file | Final file |
|---|---|---|
| Filename | modeM0/AS1T03_120T01_9000002990_20065cztM0_level2.evt | modeM0/AS1T03_120T01_9000002990_20065cztM0_level2_quad_clean.evt |
| Size (bytes) | 541,062,720 | 139,867,200 |
| Size | 516.0 MB | 133.4 MB |
| Events in quadrant A | 3,562,616 | 965,253 |
| Events in quadrant B | 4,198,268 | 953,390 |
| Events in quadrant C | 3,512,883 | 917,257 |
| Events in quadrant D | 4,628,665 | 903,744 |
| Mode SS | |||
|---|---|---|---|
| Quadrant | BADHDUFLAG | Total packets | Discarded packets |
| A | 0 | 144 | 0 |
| B | 0 | 144 | 0 |
| C | 0 | 144 | 0 |
| D | 0 | 144 | 0 |
| Mode M9 | |||
|---|---|---|---|
| Quadrant | BADHDUFLAG | Total packets | Discarded packets |
| A | 0 | 5 | 0 |
| B | 0 | 5 | 0 |
| C | 0 | 5 | 0 |
| D | 0 | 5 | 0 |
| Mode M0 | |||
|---|---|---|---|
| Quadrant | BADHDUFLAG | Total packets | Discarded packets |
| A | 0 | 15039 | 2 |
| B | 0 | 17045 | 2 |
| C | 0 | 14878 | 2 |
| D | 0 | 18462 | 2 |
| Quadrant | Total seconds | Saturated seconds | Saturation percentage |
|---|---|---|---|
| A | 7136 | 46 | 0.644619% |
| B | 7136 | 133 | 1.863789% |
| C | 7136 | 56 | 0.784753% |
| D | 7137 | 108 | 1.513241% |
Noise dominated data is calculated using 1-second bins in cleaned event files. If a bin has >2000 counts, and if more than 50% of those come from <1% of pixels, then it is considered to be noise-dominated and hence unusable.
| Quadrant | # 1 sec bins | Bins with >0 counts | Bins with >2000 counts | High rate bins dominated by noise | Noise dominated (total time) | Noise dominated (detector-on time) | Marked lightcurve |
|---|---|---|---|---|---|---|---|
| A | 7611 | 7137 | 7 | 7 | 0.09% | 0.10% | 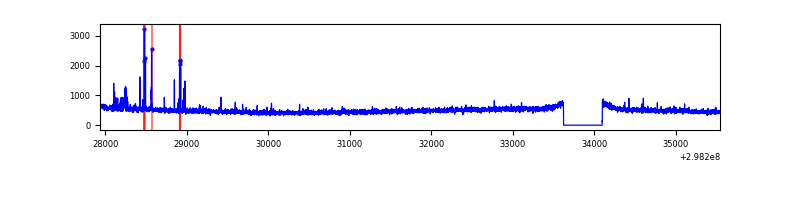 |
| B | 7611 | 7137 | 46 | 46 | 0.60% | 0.64% | 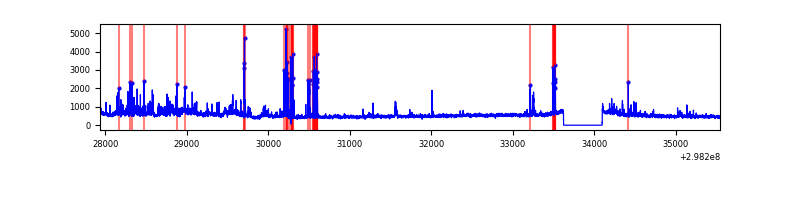 |
| C | 7611 | 7137 | 0 | 0 | 0.00% | 0.00% | 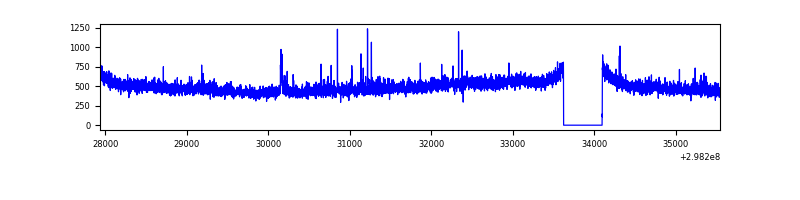 |
| D | 7612 | 7138 | 85 | 85 | 1.12% | 1.19% | 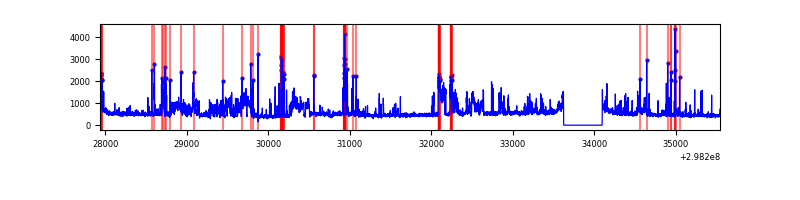 |
Top three noisy pixels from each quadrant. If the there are fewer than three noisy pixels in the level2.evt file, extra rows are filled as -1
| Pixel properties | Quadrant properties | ||||||
|---|---|---|---|---|---|---|---|
| Quadrant | DetID | PixID | Counts | Sigma | Mean | Median | Sigma |
| A | 14 | 238 | 50065 | 269.78 | 900 | 885 | 182.3 |
| A | 10 | 253 | 31490 | 167.88 | 900 | 885 | 182.3 |
| A | 11 | 29 | 8021 | 39.14 | 900 | 885 | 182.3 |
| B | 10 | 245 | 275649 | 1647.17 | 888 | 870 | 166.8 |
| B | 4 | 80 | 161256 | 961.44 | 888 | 870 | 166.8 |
| B | 7 | 220 | 145298 | 865.78 | 888 | 870 | 166.8 |
| C | 14 | 238 | 137032 | 688.05 | 851 | 856 | 197.9 |
| C | 4 | 254 | 27436 | 134.3 | 851 | 856 | 197.9 |
| C | 3 | 233 | 26724 | 130.7 | 851 | 856 | 197.9 |
| D | 1 | 52 | 944636 | 4518.24 | 861 | 842 | 208.9 |
| D | 12 | 218 | 222601 | 1061.63 | 861 | 842 | 208.9 |
| D | 13 | 249 | 51029 | 240.26 | 861 | 842 | 208.9 |
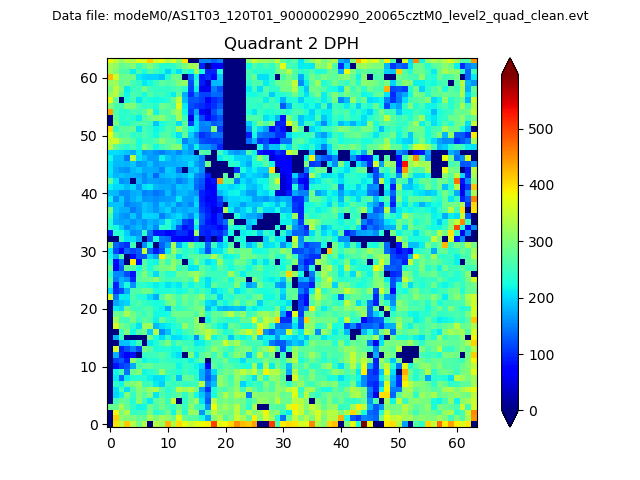
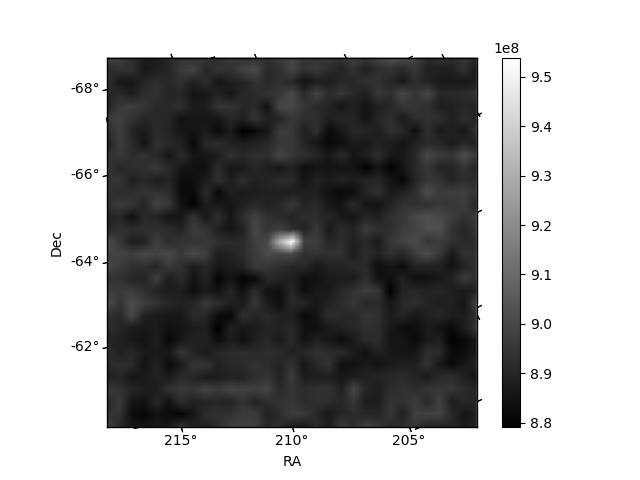
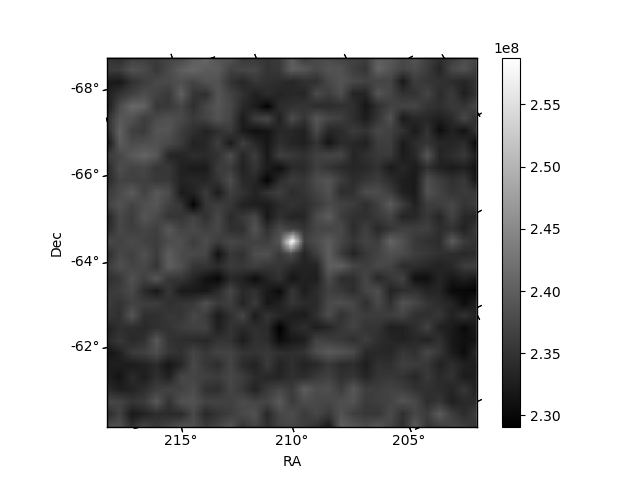
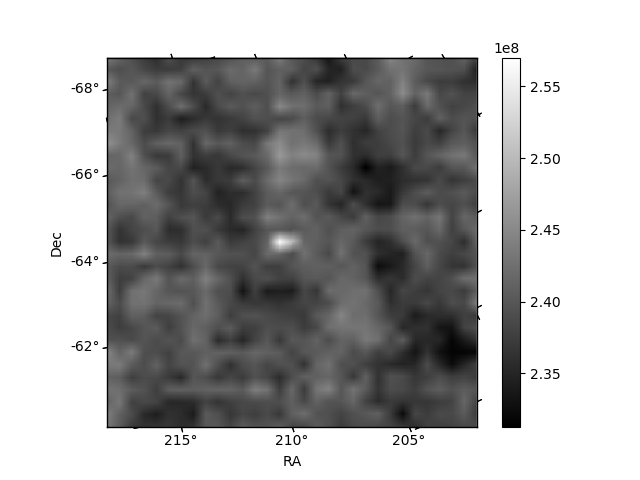
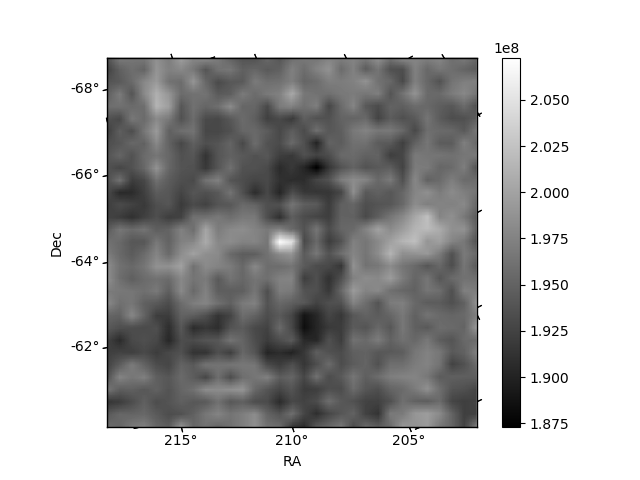
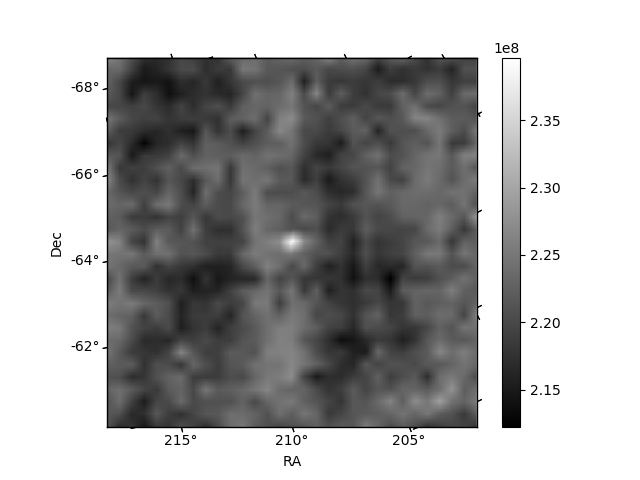
Histogram calculated using DETX and DETY for each event in the final _common_clean file
| Quadrant A | 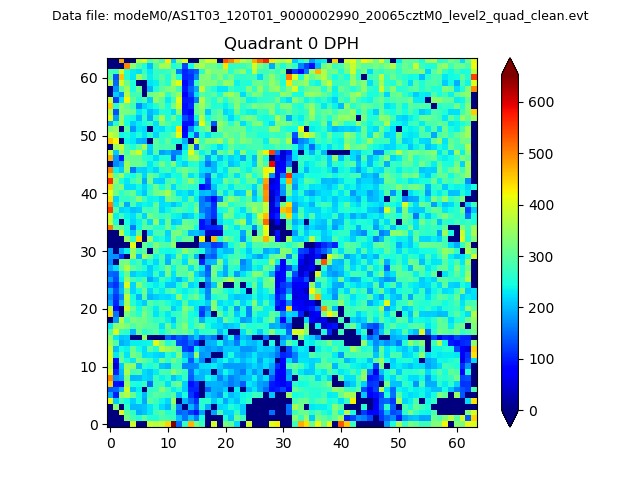 |
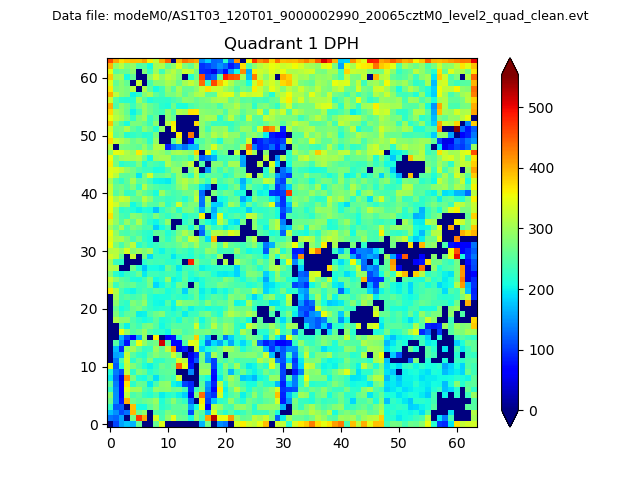 |
Quadrant B |
|---|---|---|---|
| Quadrant D | 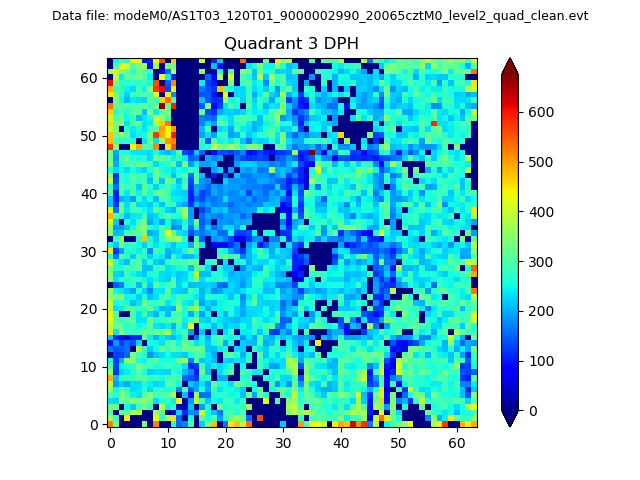 |
 |
Quadrant C |
| Plot type | Count rate plots | Images |
|---|---|---|
| Comparison with Poisson distribution Blue bars denote a histogram of data divided into 1 sec bins. Red curve is a Poisson curve with rate = median count rate of data. |
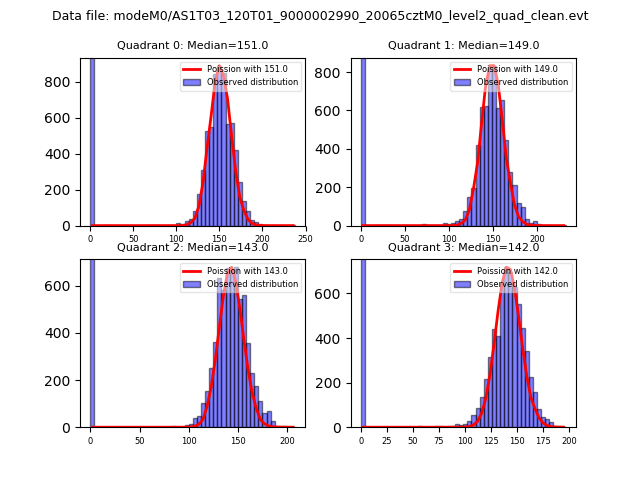 |
 |
| Quadrant-wise count rates Data is divided into 100 sec bins |
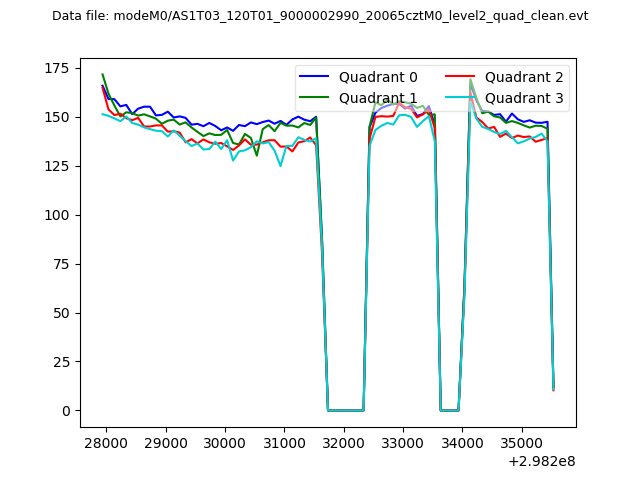 |
|
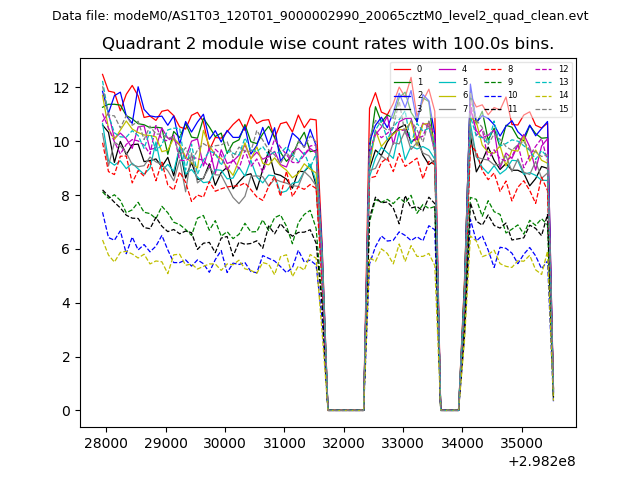
| Module-wise count rates for Quadrant A Data is divided into 100 sec bins |
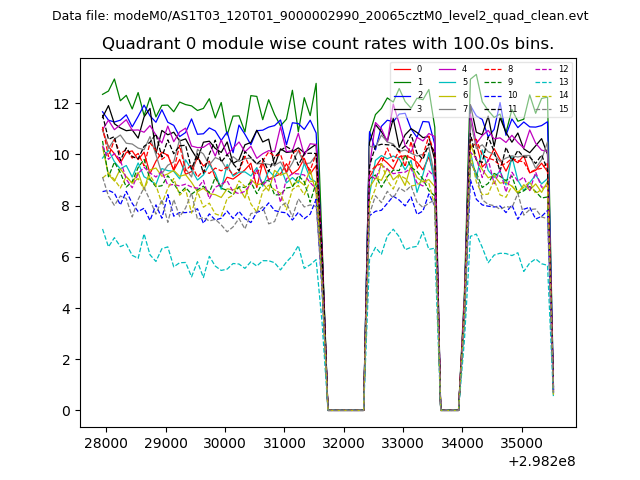 |
 |
| Module-wise count rates for Quadrant B Data is divided into 100 sec bins |
 |
 |
| Module-wise count rates for Quadrant C Data is divided into 100 sec bins |
 |
 |
| Module-wise count rates for Quadrant D Data is divided into 100 sec bins |
 |
 |
| Parameter | Plot |
|---|---|
| CZT HV Monitor | 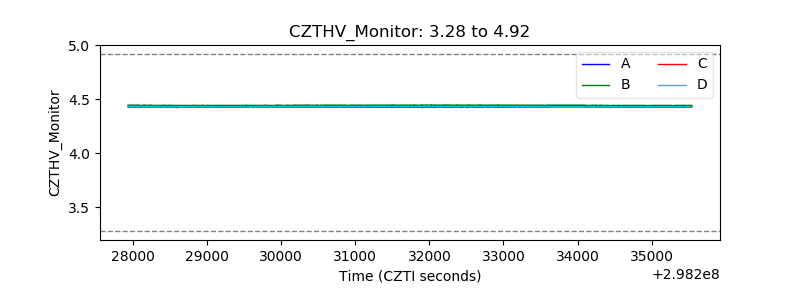 |
| D_VDD | 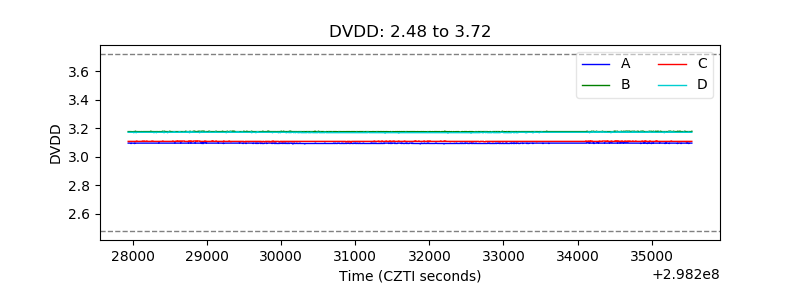 |
| Temperature 1 | 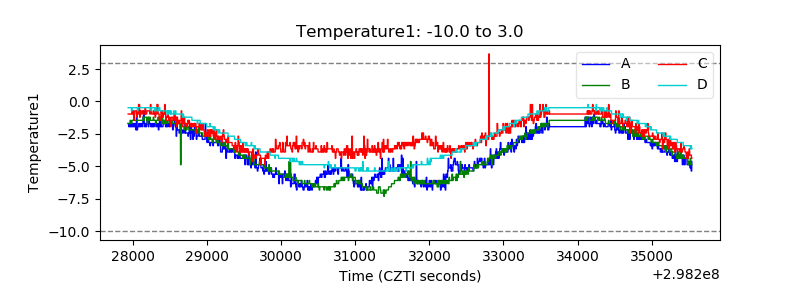 |
| Veto HV Monitor | 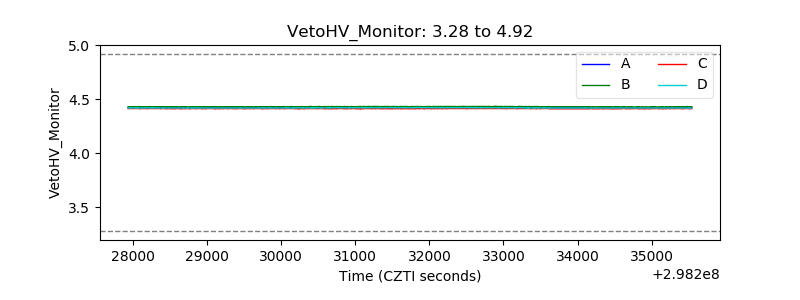 |
| Veto LLD | 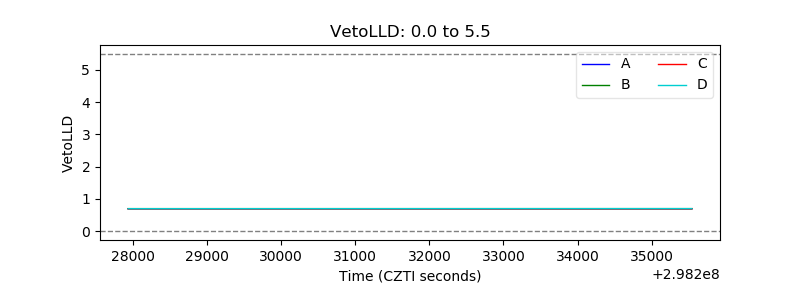 |
| Alpha Counter | 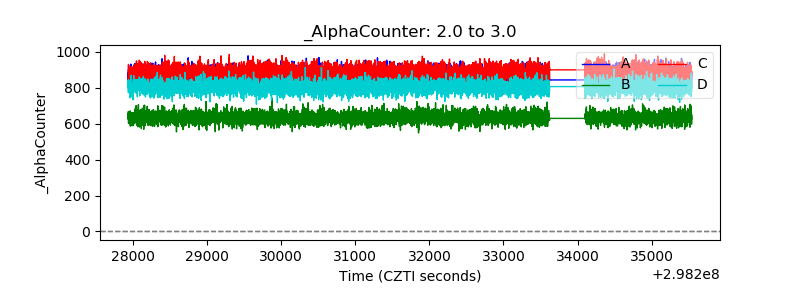 |
| _CPM_Rate | 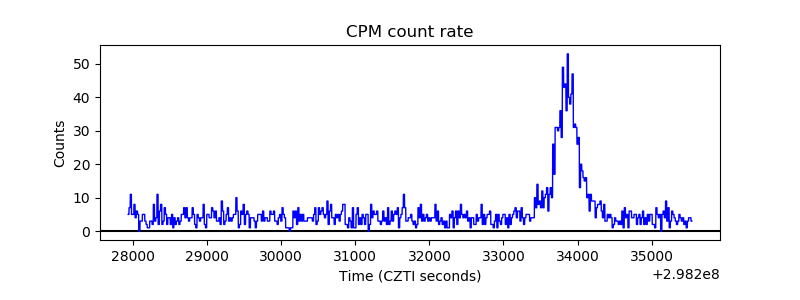 |
| CZT Counter | 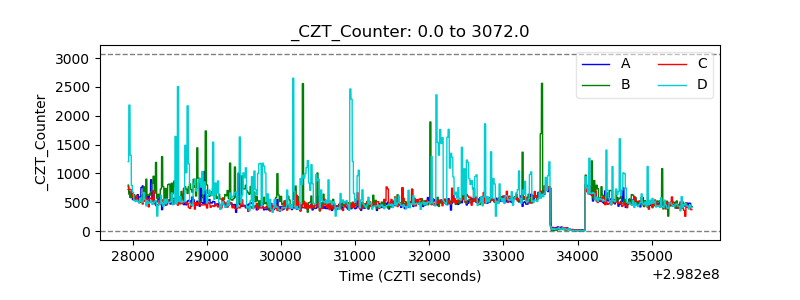 |
| +2.5 Volts monitor | 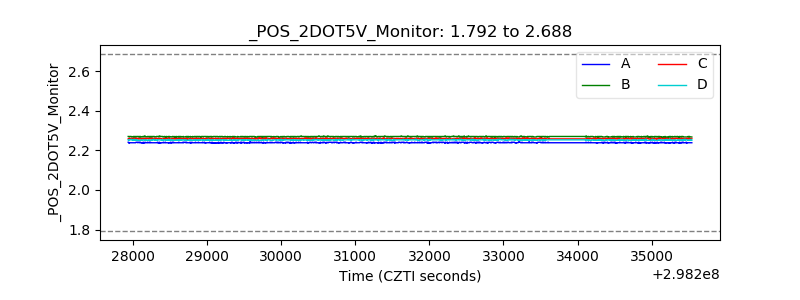 |
| +5 Volts monitor |  |
| _ROLL_ROT | 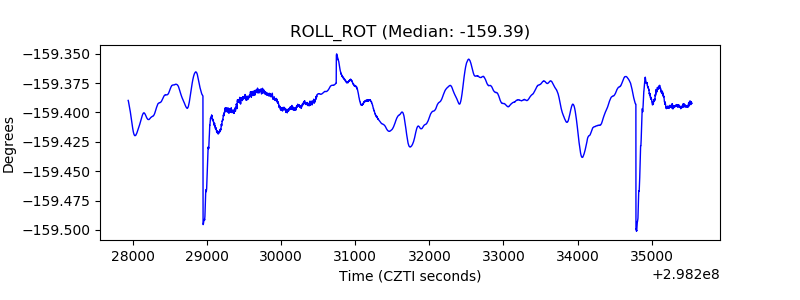 |
| _Roll_DEC | 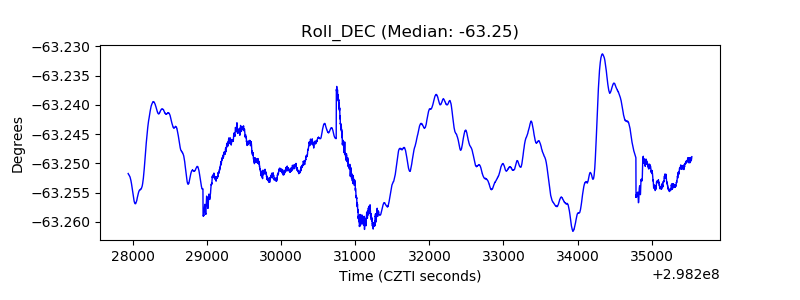 |
| _Roll_RA | 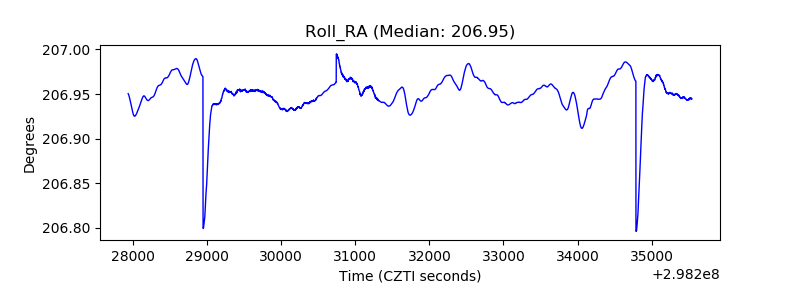 |
| Veto Counter | 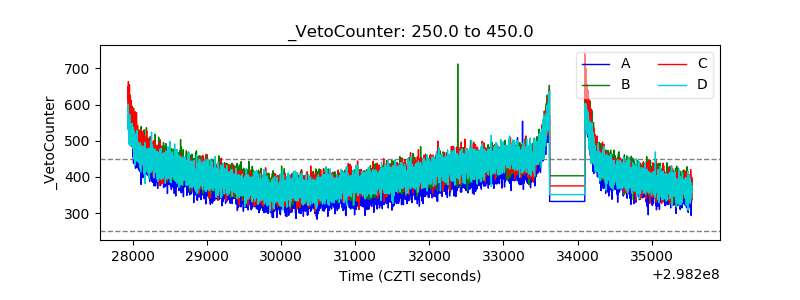 |