| Param | Original file | Final file |
|---|---|---|
| Filename | modeM0/AS1T03_120T01_9000002990_20067cztM0_level2.evt | modeM0/AS1T03_120T01_9000002990_20067cztM0_level2_quad_clean.evt |
| Size (bytes) | 712,523,520 | 152,959,680 |
| Size | 679.5 MB | 145.9 MB |
| Events in quadrant A | 4,748,396 | 1,049,653 |
| Events in quadrant B | 4,292,128 | 1,056,054 |
| Events in quadrant C | 3,873,191 | 1,011,333 |
| Events in quadrant D | 8,126,760 | 962,143 |
| Mode SS | |||
|---|---|---|---|
| Quadrant | BADHDUFLAG | Total packets | Discarded packets |
| A | 0 | 160 | 0 |
| B | 0 | 160 | 0 |
| C | 0 | 160 | 0 |
| D | 0 | 160 | 0 |
| Mode M9 | |||
|---|---|---|---|
| Quadrant | BADHDUFLAG | Total packets | Discarded packets |
| A | 0 | 5 | 0 |
| B | 0 | 5 | 0 |
| C | 0 | 5 | 0 |
| D | 0 | 5 | 0 |
| Mode M0 | |||
|---|---|---|---|
| Quadrant | BADHDUFLAG | Total packets | Discarded packets |
| A | 0 | 19240 | 1 |
| B | 0 | 17754 | 1 |
| C | 0 | 16574 | 1 |
| D | 0 | 29695 | 1 |
| Quadrant | Total seconds | Saturated seconds | Saturation percentage |
|---|---|---|---|
| A | 7971 | 333 | 4.177644% |
| B | 7972 | 189 | 2.370798% |
| C | 7972 | 144 | 1.806322% |
| D | 7972 | 701 | 8.793276% |
Noise dominated data is calculated using 1-second bins in cleaned event files. If a bin has >2000 counts, and if more than 50% of those come from <1% of pixels, then it is considered to be noise-dominated and hence unusable.
| Quadrant | # 1 sec bins | Bins with >0 counts | Bins with >2000 counts | High rate bins dominated by noise | Noise dominated (total time) | Noise dominated (detector-on time) | Marked lightcurve |
|---|---|---|---|---|---|---|---|
| A | 8371 | 7973 | 169 | 169 | 2.02% | 2.12% | 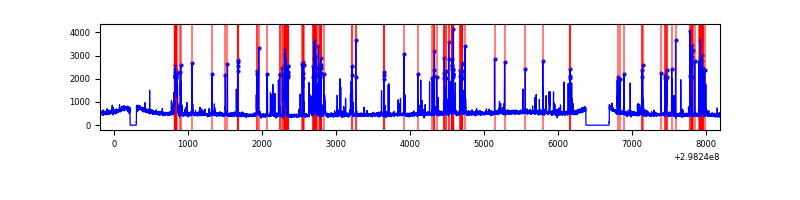 |
| B | 8372 | 7974 | 26 | 26 | 0.31% | 0.33% | 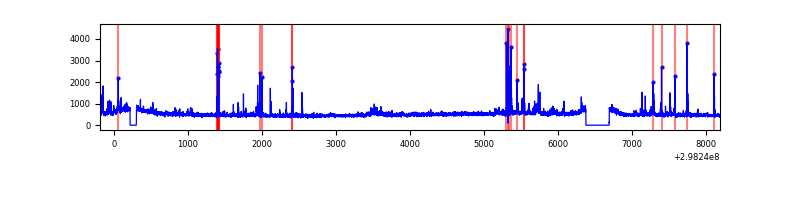 |
| C | 8372 | 7974 | 0 | 0 | 0.00% | 0.00% | 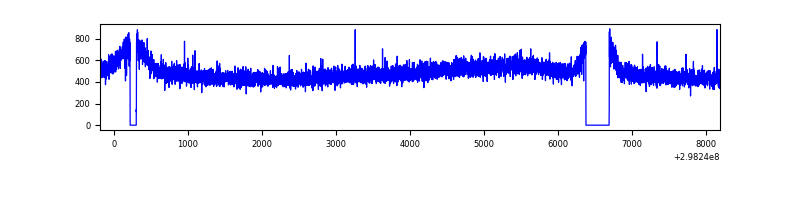 |
| D | 8372 | 7974 | 271 | 271 | 3.24% | 3.40% | 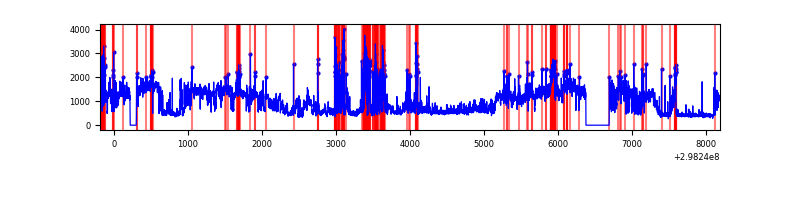 |
Top three noisy pixels from each quadrant. If the there are fewer than three noisy pixels in the level2.evt file, extra rows are filled as -1
| Pixel properties | Quadrant properties | ||||||
|---|---|---|---|---|---|---|---|
| Quadrant | DetID | PixID | Counts | Sigma | Mean | Median | Sigma |
| A | 14 | 238 | 711013 | 3526.3 | 988 | 970 | 201.4 |
| A | 14 | 254 | 204649 | 1011.53 | 988 | 970 | 201.4 |
| A | 15 | 192 | 9876 | 44.23 | 988 | 970 | 201.4 |
| B | 7 | 220 | 69380 | 357.93 | 994 | 972 | 191.1 |
| B | 0 | 197 | 67348 | 347.3 | 994 | 972 | 191.1 |
| B | 4 | 80 | 61027 | 314.22 | 994 | 972 | 191.1 |
| C | 14 | 238 | 150326 | 681.28 | 945 | 955 | 219.3 |
| C | 3 | 233 | 28385 | 125.11 | 945 | 955 | 219.3 |
| C | 13 | 61 | 6732 | 26.35 | 945 | 955 | 219.3 |
| D | 1 | 52 | 3577653 | 15614.08 | 935 | 911 | 229.1 |
| D | 12 | 218 | 623499 | 2717.88 | 935 | 911 | 229.1 |
| D | 7 | 38 | 146304 | 634.71 | 935 | 911 | 229.1 |
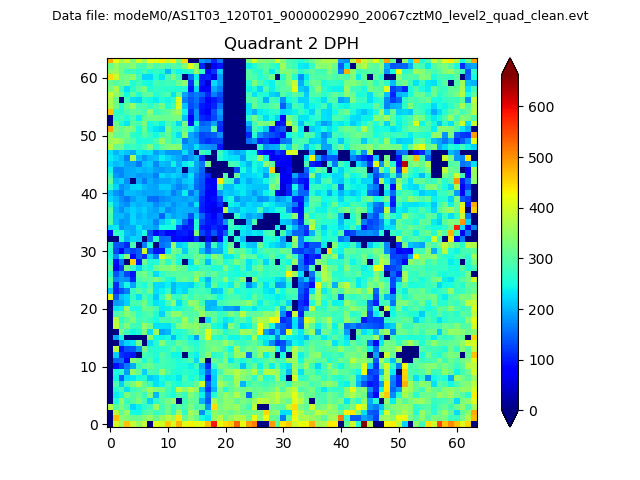
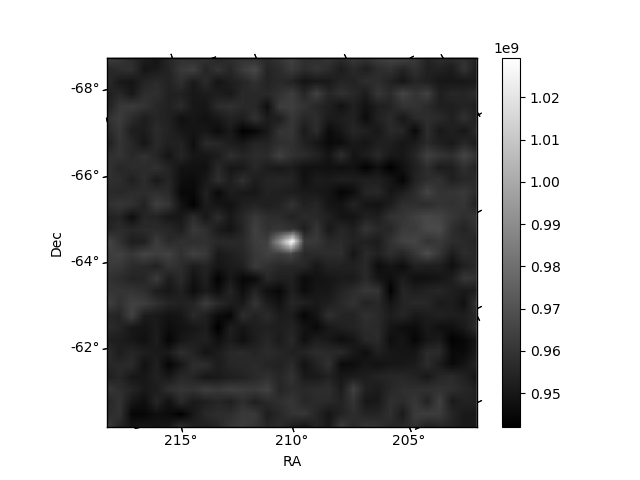
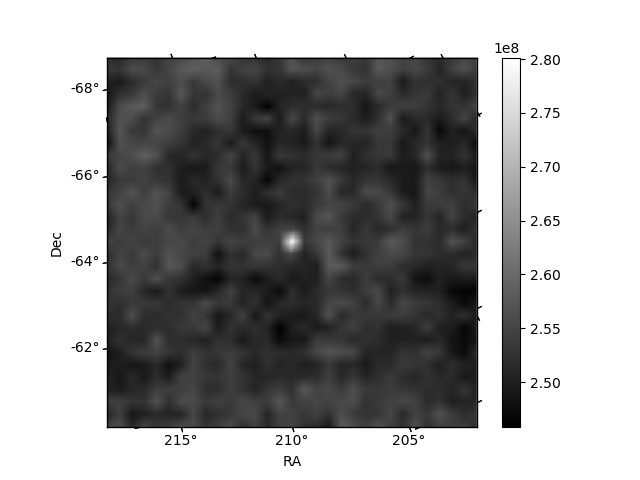
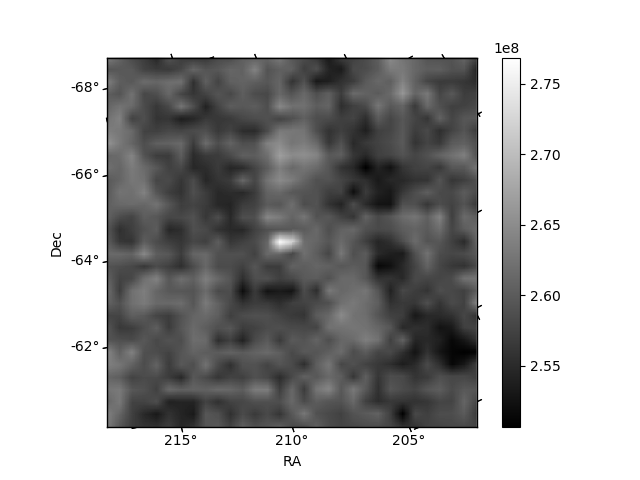
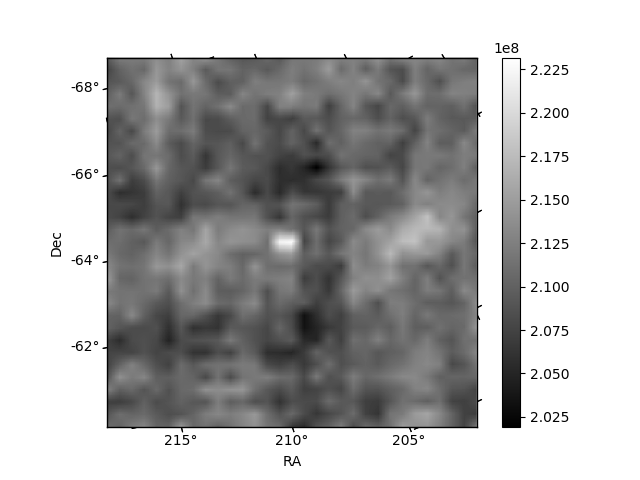
Histogram calculated using DETX and DETY for each event in the final _common_clean file
| Quadrant A | 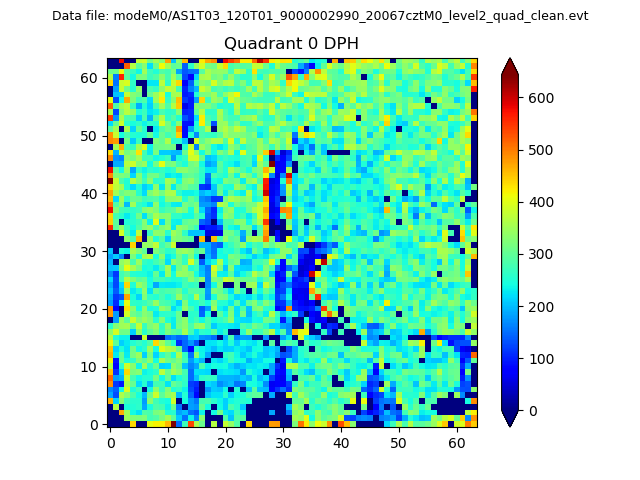 |
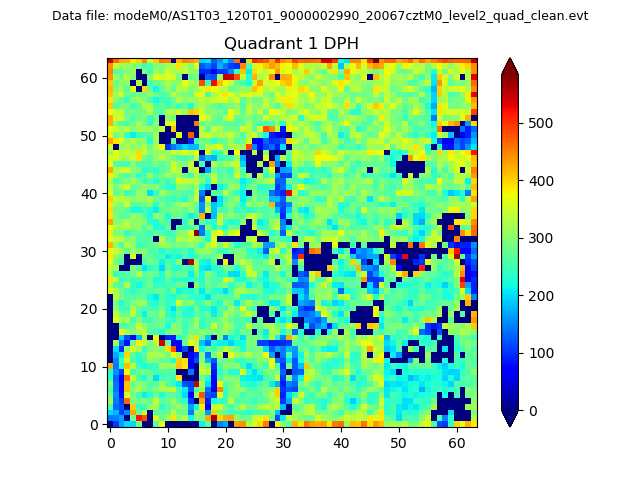 |
Quadrant B |
|---|---|---|---|
| Quadrant D | 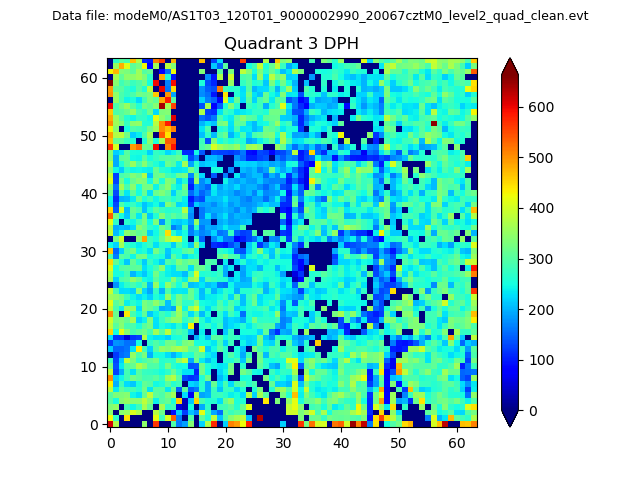 |
 |
Quadrant C |
| Plot type | Count rate plots | Images |
|---|---|---|
| Comparison with Poisson distribution Blue bars denote a histogram of data divided into 1 sec bins. Red curve is a Poisson curve with rate = median count rate of data. |
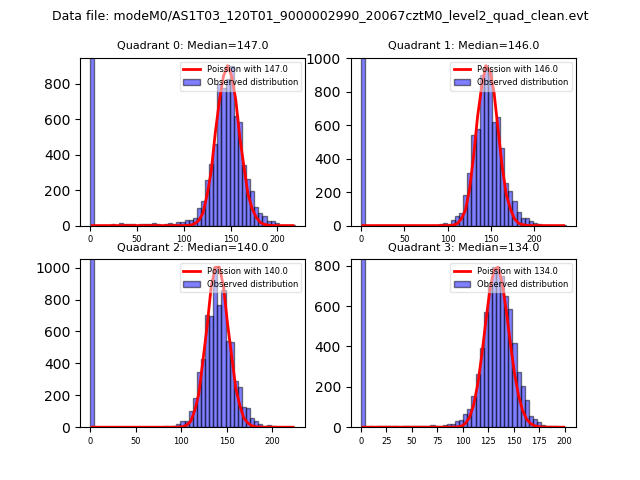 |
 |
| Quadrant-wise count rates Data is divided into 100 sec bins |
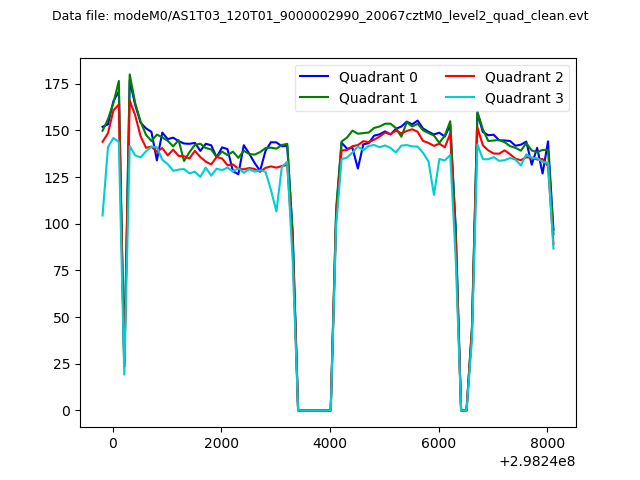 |
|
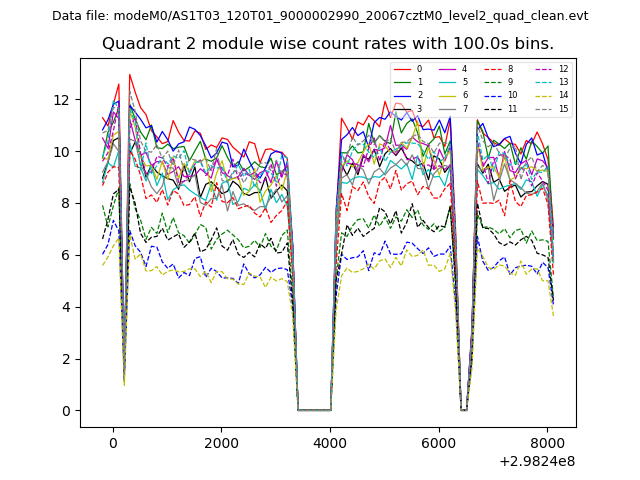
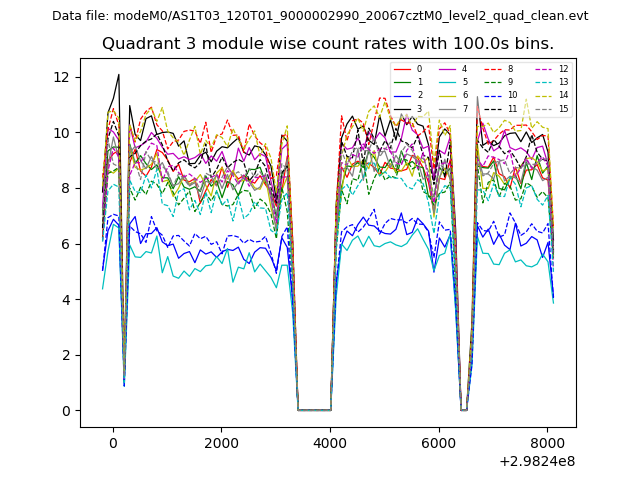
| Module-wise count rates for Quadrant A Data is divided into 100 sec bins |
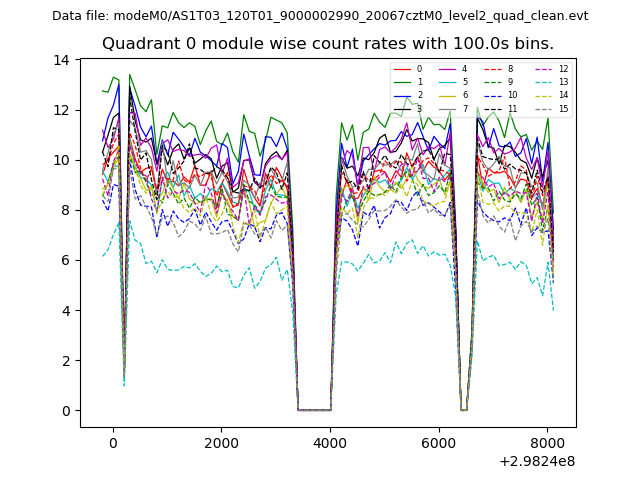 |
 |
| Module-wise count rates for Quadrant B Data is divided into 100 sec bins |
 |
 |
| Module-wise count rates for Quadrant C Data is divided into 100 sec bins |
 |
 |
| Module-wise count rates for Quadrant D Data is divided into 100 sec bins |
 |
 |
| Parameter | Plot |
|---|---|
| CZT HV Monitor |  |
| D_VDD | 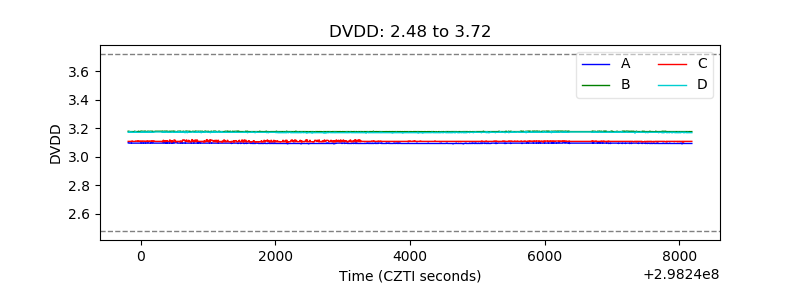 |
| Temperature 1 |  |
| Veto HV Monitor | 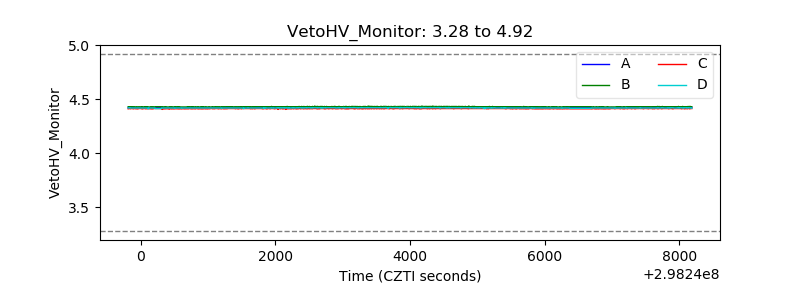 |
| Veto LLD | 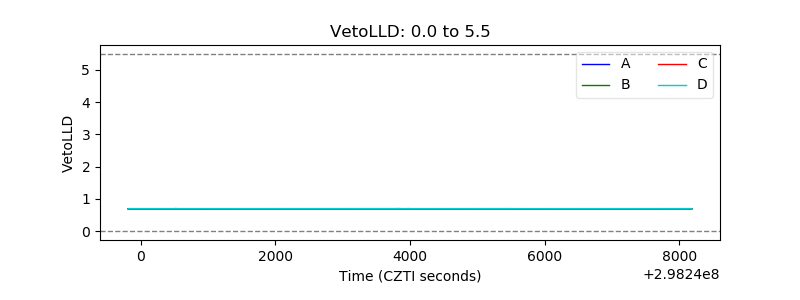 |
| Alpha Counter | 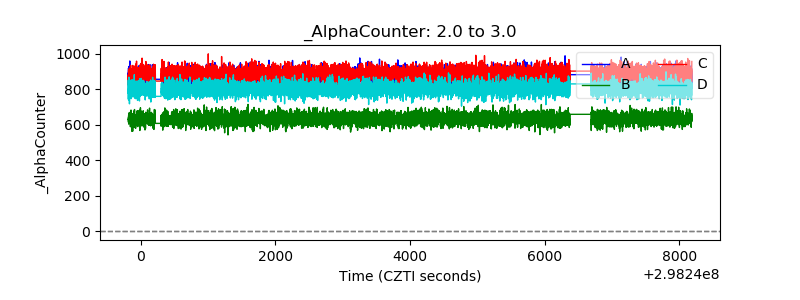 |
| _CPM_Rate | 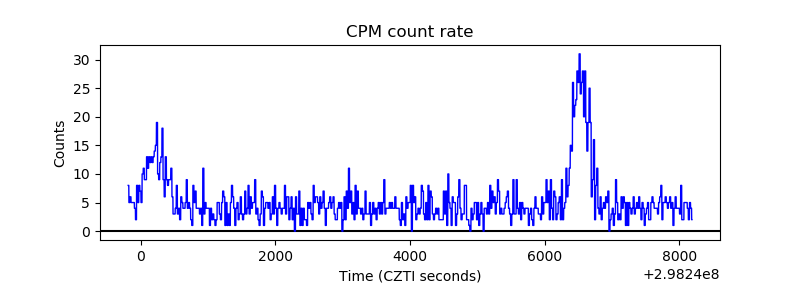 |
| CZT Counter | 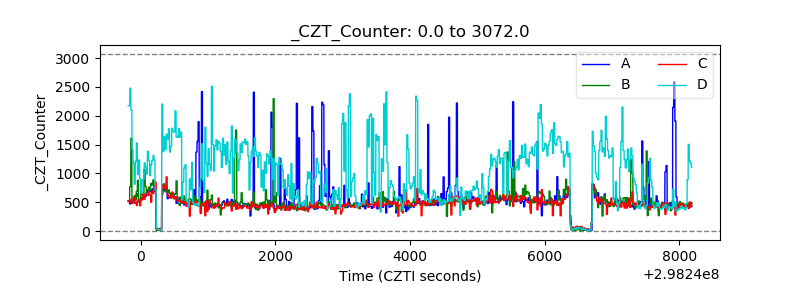 |
| +2.5 Volts monitor |  |
| +5 Volts monitor |  |
| _ROLL_ROT | 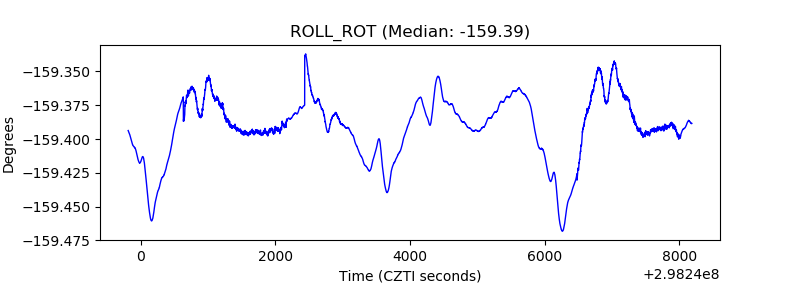 |
| _Roll_DEC | 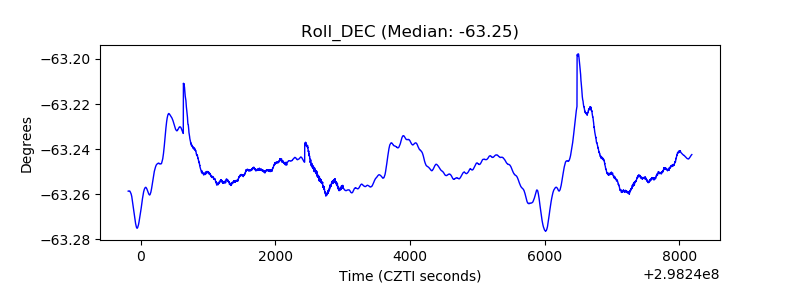 |
| _Roll_RA | 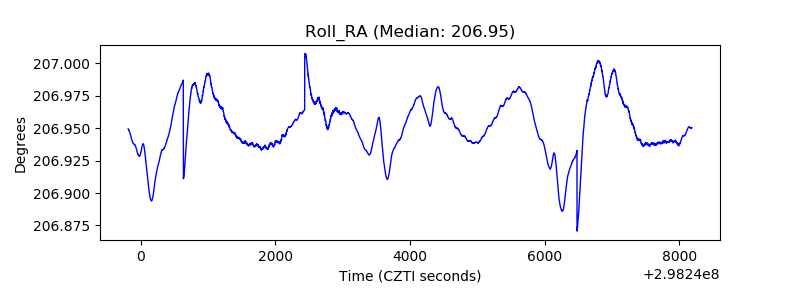 |
| Veto Counter | 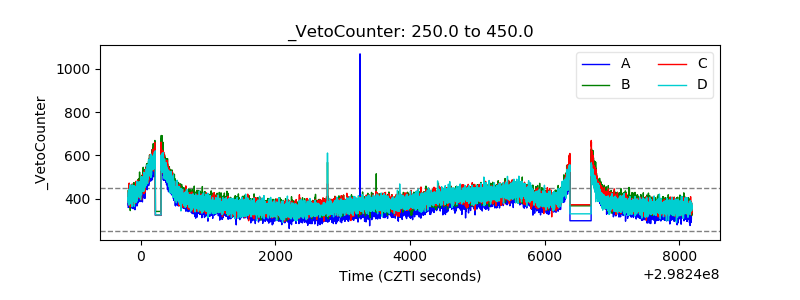 |