| Param | Original file | Final file |
|---|---|---|
| Filename | modeM0/AS1T03_120T01_9000002990_20070cztM0_level2.evt | modeM0/AS1T03_120T01_9000002990_20070cztM0_level2_quad_clean.evt |
| Size (bytes) | 2,569,354,560 | 555,258,240 |
| Size | 2.4 GB | 529.5 MB |
| Events in quadrant A | 19,314,882 | 3,744,930 |
| Events in quadrant B | 17,108,512 | 3,801,169 |
| Events in quadrant C | 14,667,781 | 3,662,373 |
| Events in quadrant D | 24,676,984 | 3,523,216 |
| Mode SS | |||
|---|---|---|---|
| Quadrant | BADHDUFLAG | Total packets | Discarded packets |
| A | 0 | 614 | 0 |
| B | 0 | 614 | 0 |
| C | 0 | 614 | 0 |
| D | 0 | 614 | 0 |
| Mode M9 | |||
|---|---|---|---|
| Quadrant | BADHDUFLAG | Total packets | Discarded packets |
| A | 0 | 25 | 0 |
| B | 0 | 25 | 0 |
| C | 0 | 25 | 0 |
| D | 0 | 25 | 0 |
| Mode M0 | |||
|---|---|---|---|
| Quadrant | BADHDUFLAG | Total packets | Discarded packets |
| A | 0 | 76484 | 4 |
| B | 0 | 69941 | 4 |
| C | 0 | 62124 | 4 |
| D | 0 | 94103 | 4 |
| Quadrant | Total seconds | Saturated seconds | Saturation percentage |
|---|---|---|---|
| A | 30377 | 1839 | 6.053922% |
| B | 30378 | 675 | 2.222003% |
| C | 30378 | 333 | 1.096188% |
| D | 30378 | 1617 | 5.322931% |
Noise dominated data is calculated using 1-second bins in cleaned event files. If a bin has >2000 counts, and if more than 50% of those come from <1% of pixels, then it is considered to be noise-dominated and hence unusable.
| Quadrant | # 1 sec bins | Bins with >0 counts | Bins with >2000 counts | High rate bins dominated by noise | Noise dominated (total time) | Noise dominated (detector-on time) | Marked lightcurve |
|---|---|---|---|---|---|---|---|
| A | 32767 | 30382 | 1028 | 1028 | 3.14% | 3.38% | 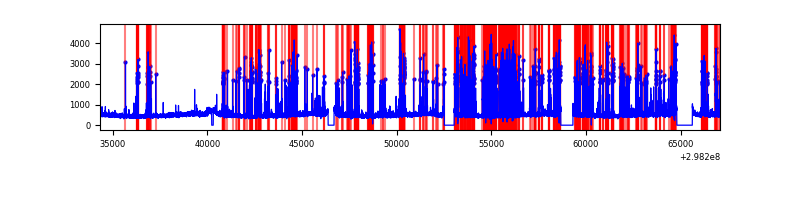 |
| B | 32768 | 30383 | 227 | 227 | 0.69% | 0.75% | 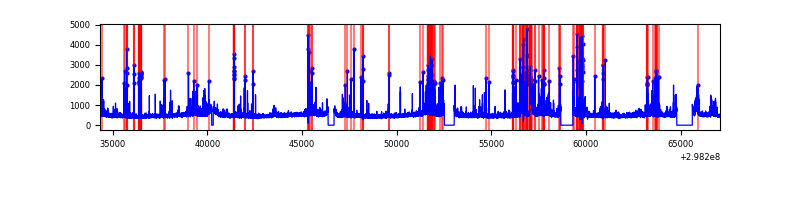 |
| C | 32768 | 30383 | 0 | 0 | 0.00% | 0.00% |  |
| D | 32768 | 30383 | 915 | 915 | 2.79% | 3.01% | 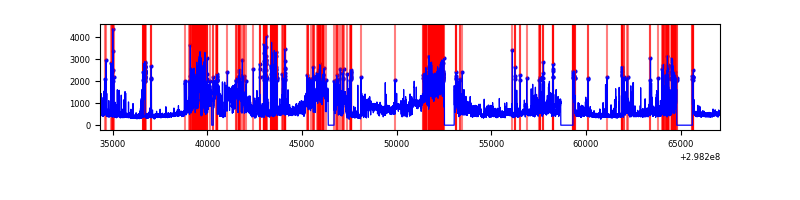 |
Top three noisy pixels from each quadrant. If the there are fewer than three noisy pixels in the level2.evt file, extra rows are filled as -1
| Pixel properties | Quadrant properties | ||||||
|---|---|---|---|---|---|---|---|
| Quadrant | DetID | PixID | Counts | Sigma | Mean | Median | Sigma |
| A | 14 | 238 | 4000348 | 5375.5 | 3668 | 3602 | 743.5 |
| A | 14 | 254 | 1098491 | 1472.59 | 3668 | 3602 | 743.5 |
| A | 0 | 226 | 31382 | 37.36 | 3668 | 3602 | 743.5 |
| B | 10 | 245 | 702883 | 998.27 | 3717 | 3634 | 700.5 |
| B | 7 | 220 | 598404 | 849.11 | 3717 | 3634 | 700.5 |
| B | 4 | 80 | 425482 | 602.24 | 3717 | 3634 | 700.5 |
| C | 14 | 238 | 571749 | 684.46 | 3583 | 3619 | 830.0 |
| C | 3 | 233 | 70452 | 80.52 | 3583 | 3619 | 830.0 |
| C | 13 | 61 | 25254 | 26.06 | 3583 | 3619 | 830.0 |
| D | 1 | 52 | 7203588 | 8369.16 | 3574 | 3486 | 860.3 |
| D | 12 | 218 | 2626378 | 3048.76 | 3574 | 3486 | 860.3 |
| D | 7 | 38 | 808884 | 936.17 | 3574 | 3486 | 860.3 |
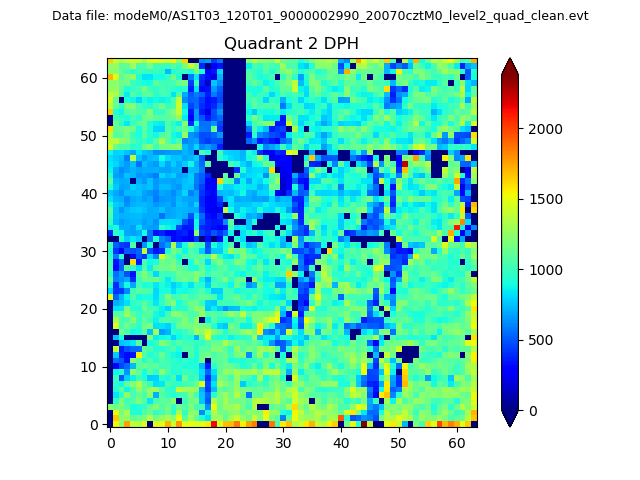
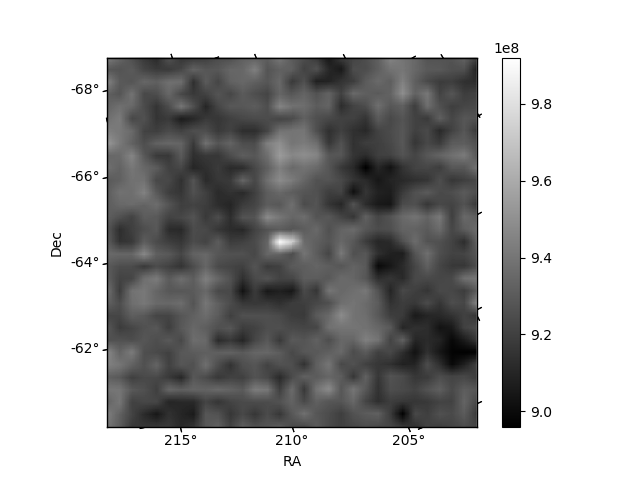
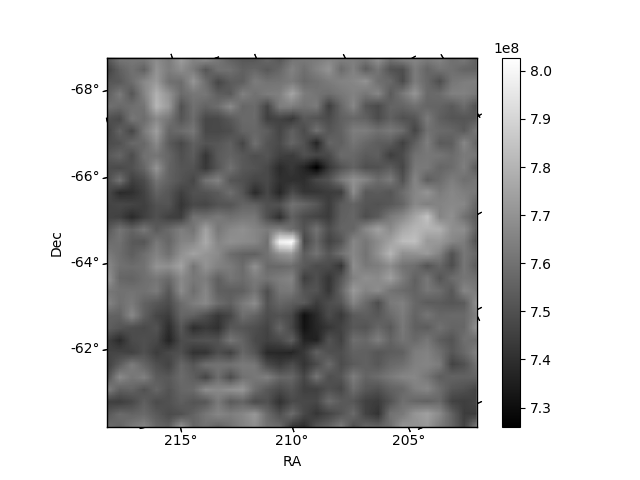
Histogram calculated using DETX and DETY for each event in the final _common_clean file
| Quadrant A | 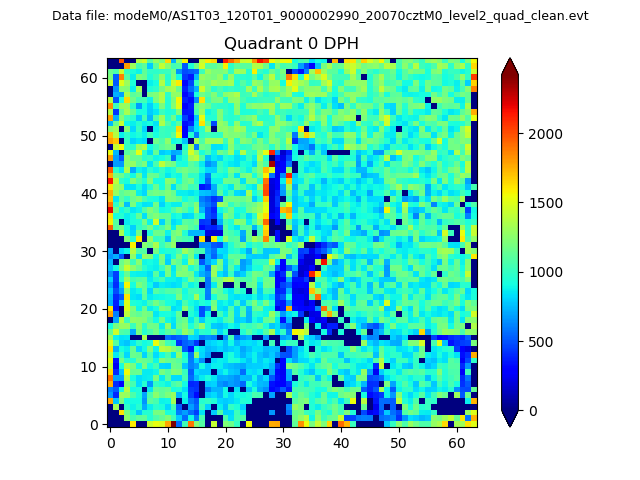 |
 |
Quadrant B |
|---|---|---|---|
| Quadrant D | 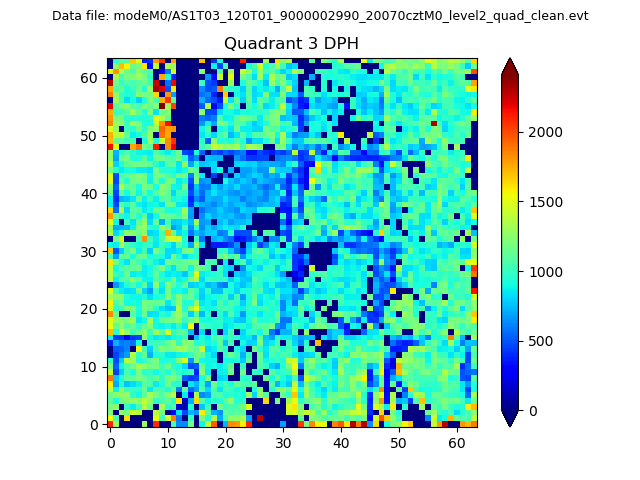 |
 |
Quadrant C |
| Plot type | Count rate plots | Images |
|---|---|---|
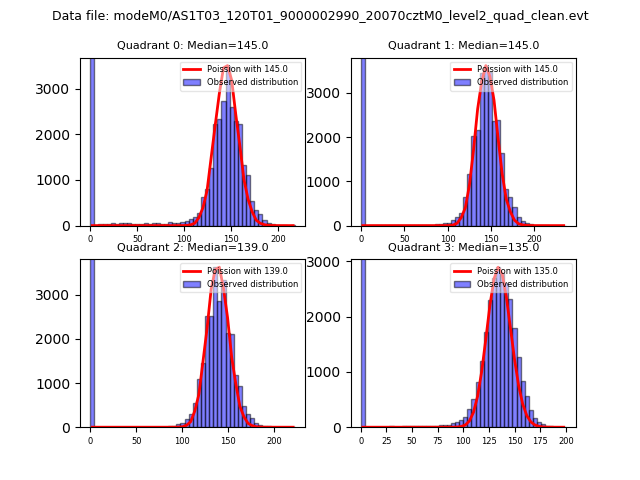
| Comparison with Poisson distribution Blue bars denote a histogram of data divided into 1 sec bins. Red curve is a Poisson curve with rate = median count rate of data. |
 |
 |
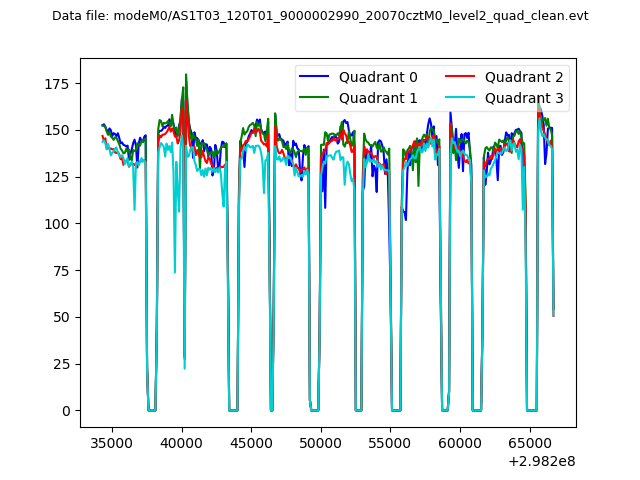
| Quadrant-wise count rates Data is divided into 100 sec bins |
 |
|
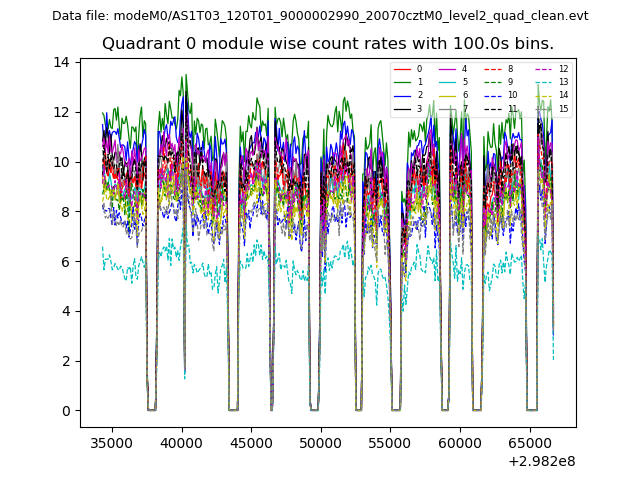
| Module-wise count rates for Quadrant A Data is divided into 100 sec bins |
 |
 |
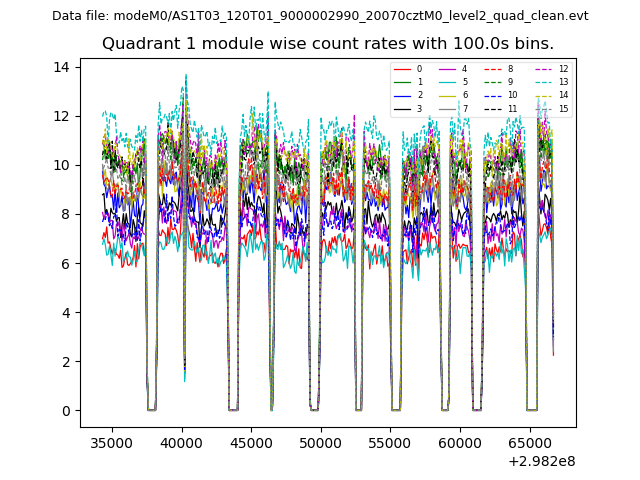
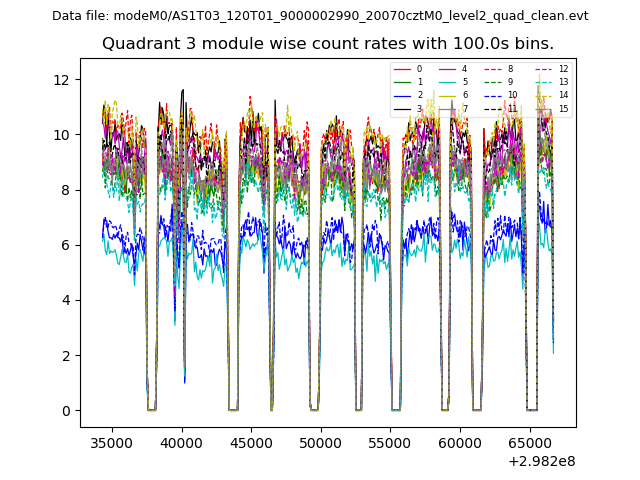
| Module-wise count rates for Quadrant B Data is divided into 100 sec bins |
 |
 |
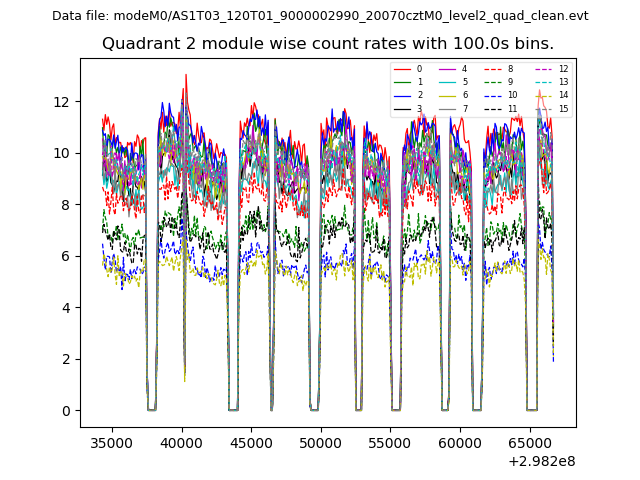
| Module-wise count rates for Quadrant C Data is divided into 100 sec bins |
 |
 |
| Module-wise count rates for Quadrant D Data is divided into 100 sec bins |
 |
 |
| Parameter | Plot |
|---|---|
| CZT HV Monitor | 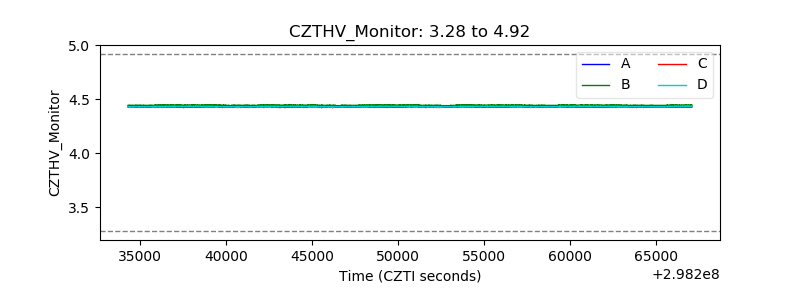 |
| D_VDD | 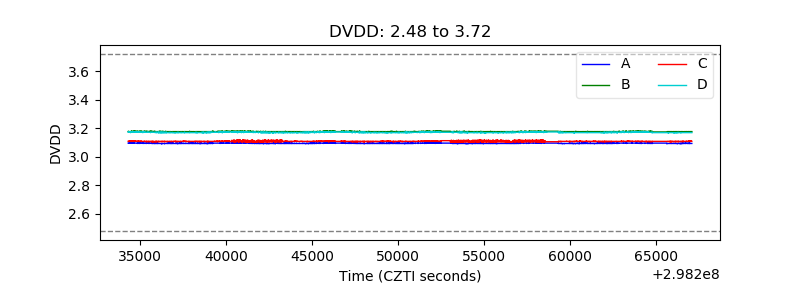 |
| Temperature 1 | 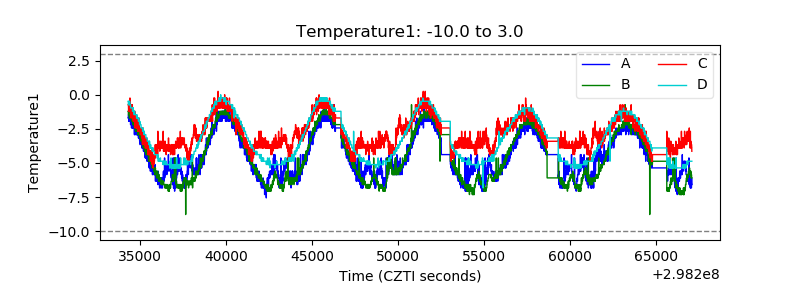 |
| Veto HV Monitor | 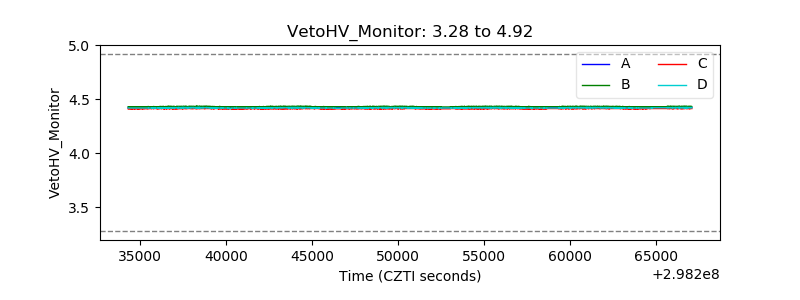 |
| Veto LLD | 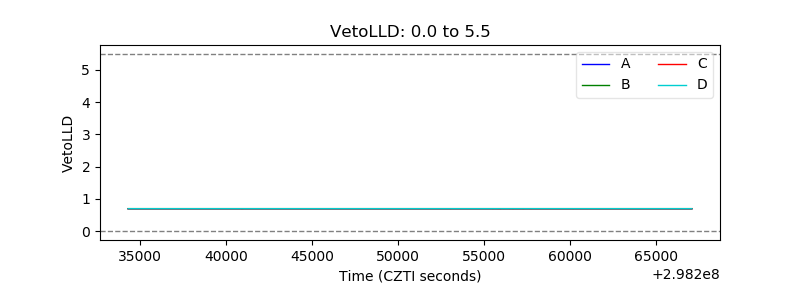 |
| Alpha Counter | 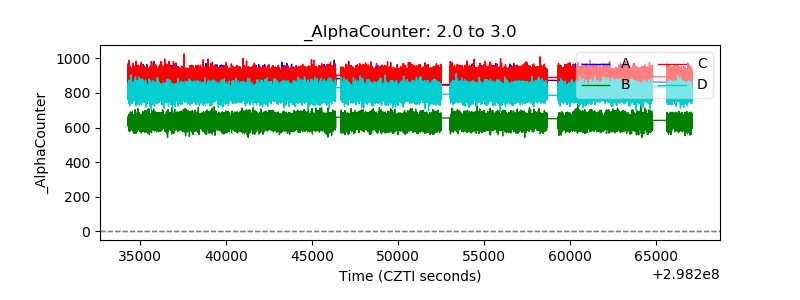 |
| _CPM_Rate | 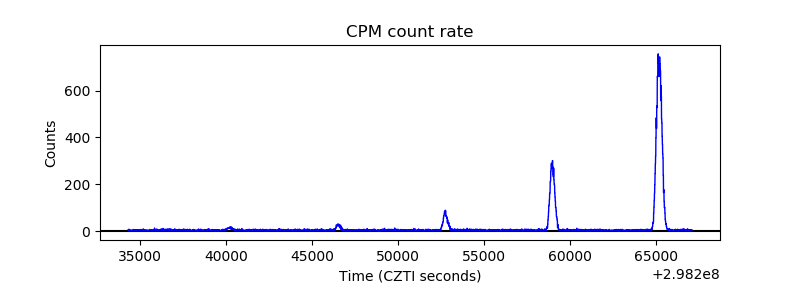 |
| CZT Counter | 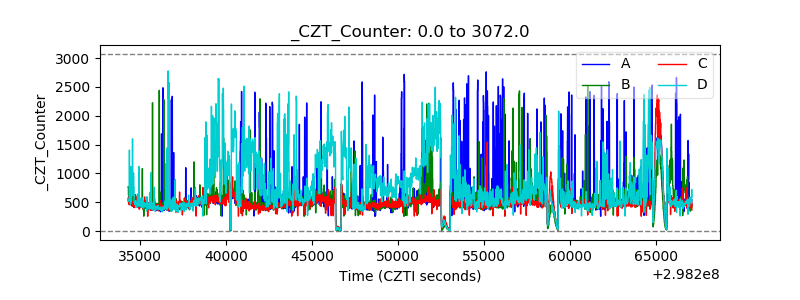 |
| +2.5 Volts monitor |  |
| +5 Volts monitor |  |
| _ROLL_ROT | 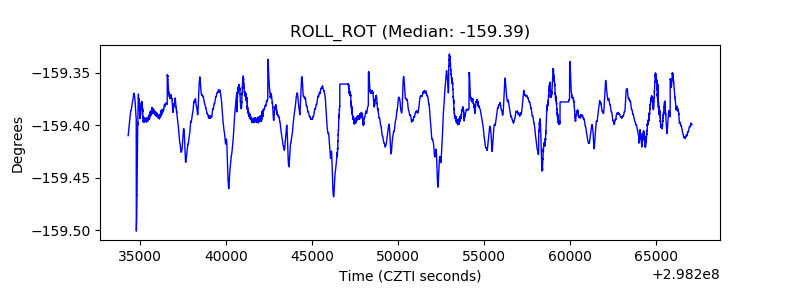 |
| _Roll_DEC | 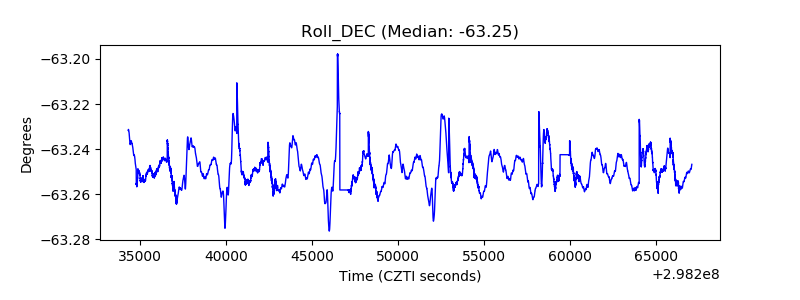 |
| _Roll_RA | 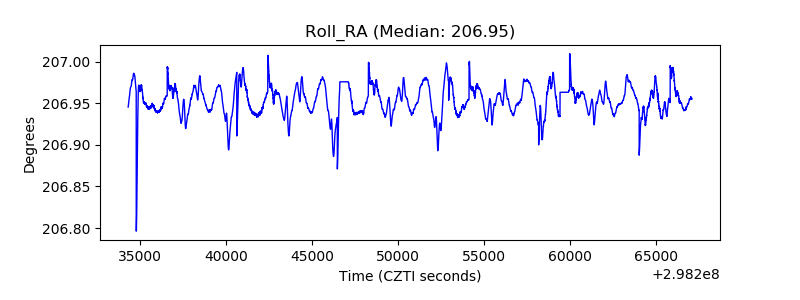 |
| Veto Counter | 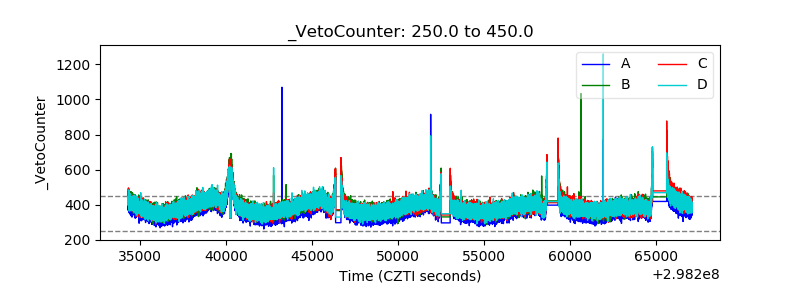 |