| Param | Original file | Final file |
|---|---|---|
| Filename | modeM0/AS1T03_120T01_9000002990_20071cztM0_level2.evt | modeM0/AS1T03_120T01_9000002990_20071cztM0_level2_quad_clean.evt |
| Size (bytes) | 534,251,520 | 114,120,000 |
| Size | 509.5 MB | 108.8 MB |
| Events in quadrant A | 3,693,192 | 770,625 |
| Events in quadrant B | 3,765,336 | 770,117 |
| Events in quadrant C | 3,333,573 | 745,755 |
| Events in quadrant D | 4,939,206 | 708,437 |
| Mode SS | |||
|---|---|---|---|
| Quadrant | BADHDUFLAG | Total packets | Discarded packets |
| A | 0 | 134 | 0 |
| B | 0 | 134 | 0 |
| C | 0 | 134 | 0 |
| D | 0 | 134 | 0 |
| Mode M9 | |||
|---|---|---|---|
| Quadrant | BADHDUFLAG | Total packets | Discarded packets |
| A | 0 | 10 | 0 |
| B | 0 | 10 | 0 |
| C | 0 | 10 | 0 |
| D | 0 | 10 | 0 |
| Mode M0 | |||
|---|---|---|---|
| Quadrant | BADHDUFLAG | Total packets | Discarded packets |
| A | 0 | 14926 | 1 |
| B | 0 | 15220 | 1 |
| C | 0 | 13790 | 1 |
| D | 0 | 18870 | 1 |
| Quadrant | Total seconds | Saturated seconds | Saturation percentage |
|---|---|---|---|
| A | 6614 | 136 | 2.056244% |
| B | 6615 | 96 | 1.451247% |
| C | 6615 | 78 | 1.179138% |
| D | 6615 | 375 | 5.668934% |
Noise dominated data is calculated using 1-second bins in cleaned event files. If a bin has >2000 counts, and if more than 50% of those come from <1% of pixels, then it is considered to be noise-dominated and hence unusable.
| Quadrant | # 1 sec bins | Bins with >0 counts | Bins with >2000 counts | High rate bins dominated by noise | Noise dominated (total time) | Noise dominated (detector-on time) | Marked lightcurve |
|---|---|---|---|---|---|---|---|
| A | 7614 | 6615 | 55 | 55 | 0.72% | 0.83% | 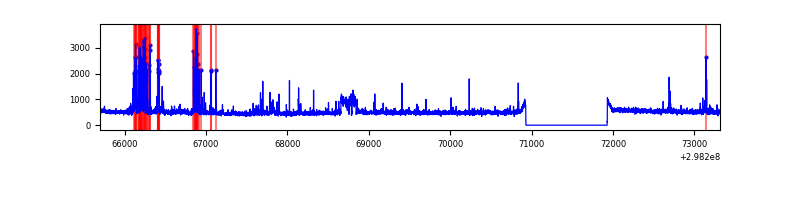 |
| B | 7615 | 6616 | 23 | 23 | 0.30% | 0.35% | 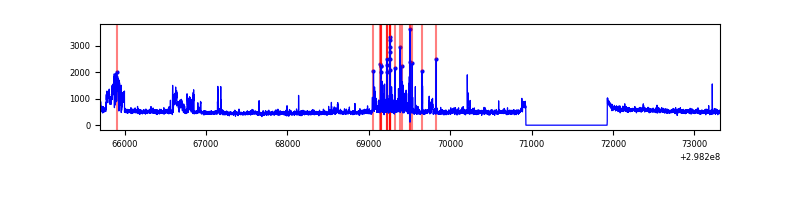 |
| C | 7615 | 6616 | 2 | 2 | 0.03% | 0.03% | 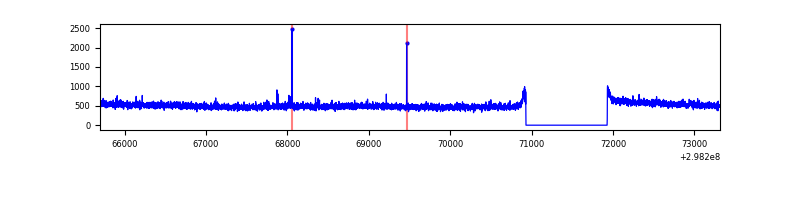 |
| D | 7615 | 6616 | 348 | 348 | 4.57% | 5.26% |  |
Top three noisy pixels from each quadrant. If the there are fewer than three noisy pixels in the level2.evt file, extra rows are filled as -1
| Pixel properties | Quadrant properties | ||||||
|---|---|---|---|---|---|---|---|
| Quadrant | DetID | PixID | Counts | Sigma | Mean | Median | Sigma |
| A | 14 | 238 | 309995 | 1838.62 | 834 | 821 | 168.2 |
| A | 15 | 192 | 81182 | 477.9 | 834 | 821 | 168.2 |
| A | 4 | 2 | 74182 | 436.27 | 834 | 821 | 168.2 |
| B | 10 | 245 | 225644 | 1424.8 | 832 | 814 | 157.8 |
| B | 7 | 220 | 132594 | 835.12 | 832 | 814 | 157.8 |
| B | 0 | 229 | 27437 | 168.72 | 832 | 814 | 157.8 |
| C | 14 | 238 | 128201 | 678.66 | 809 | 818 | 187.7 |
| C | 4 | 254 | 21335 | 109.31 | 809 | 818 | 187.7 |
| C | 4 | 175 | 21102 | 108.07 | 809 | 818 | 187.7 |
| D | 1 | 52 | 1023403 | 5306.56 | 799 | 779 | 192.7 |
| D | 7 | 38 | 799627 | 4145.35 | 799 | 779 | 192.7 |
| D | 12 | 218 | 65429 | 335.48 | 799 | 779 | 192.7 |
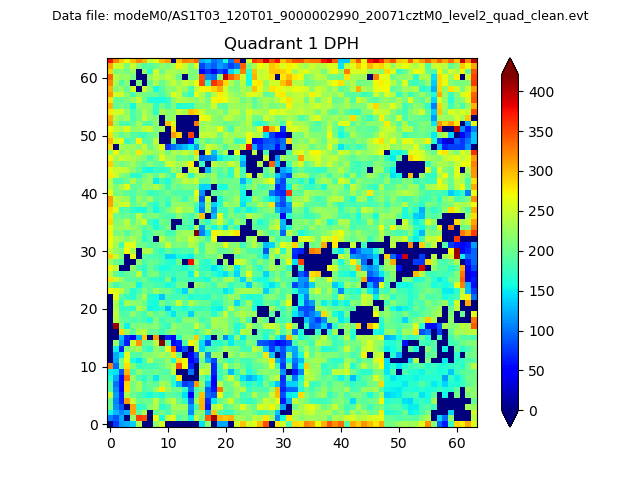
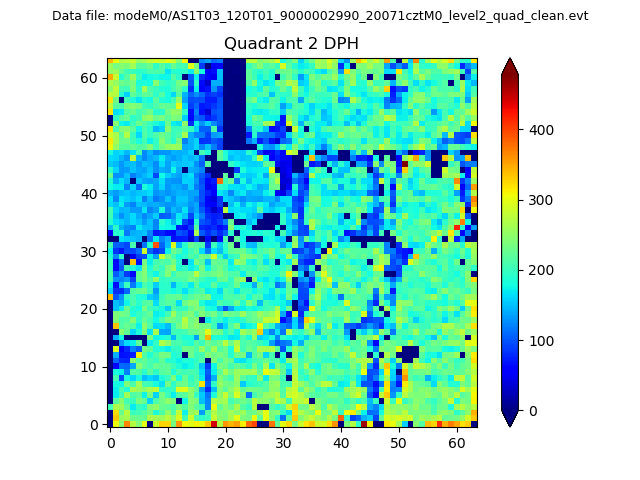
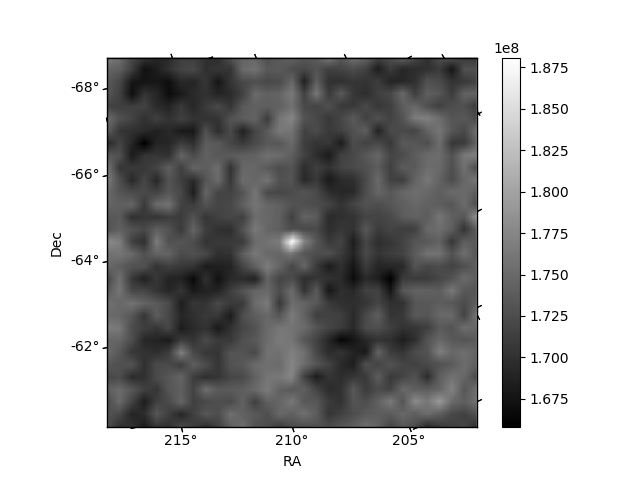
Histogram calculated using DETX and DETY for each event in the final _common_clean file
| Quadrant A | 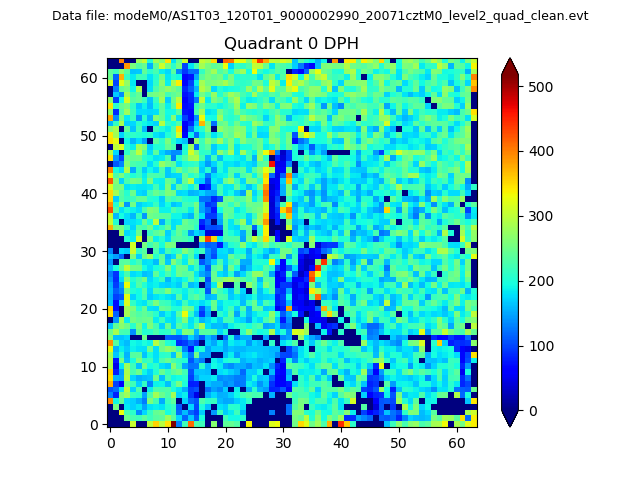 |
 |
Quadrant B |
|---|---|---|---|
| Quadrant D | 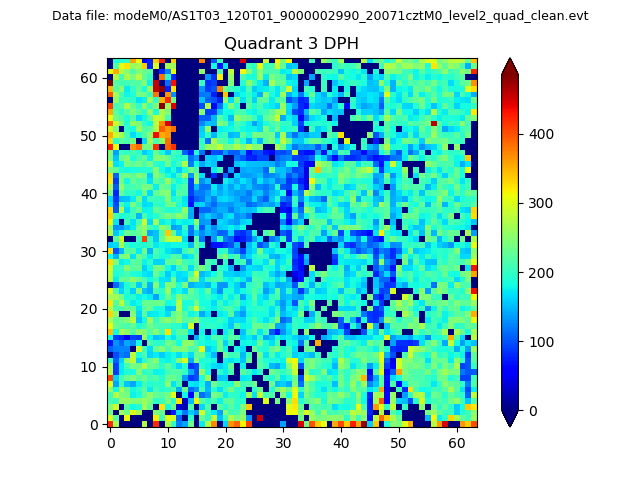 |
 |
Quadrant C |
| Plot type | Count rate plots | Images |
|---|---|---|
| Comparison with Poisson distribution Blue bars denote a histogram of data divided into 1 sec bins. Red curve is a Poisson curve with rate = median count rate of data. |
 |
 |
| Quadrant-wise count rates Data is divided into 100 sec bins |
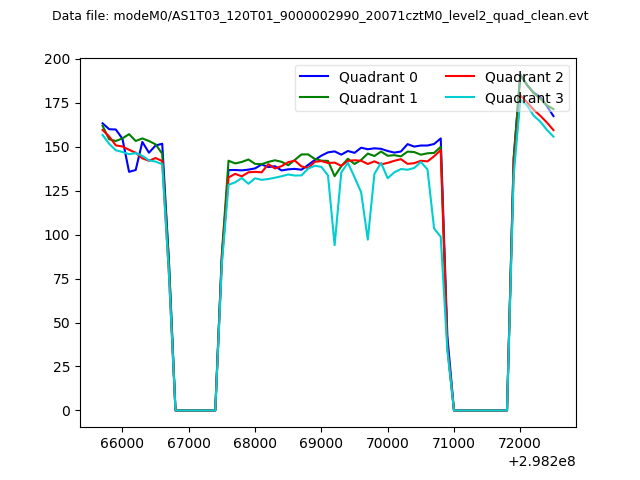 |
|
| Module-wise count rates for Quadrant A Data is divided into 100 sec bins |
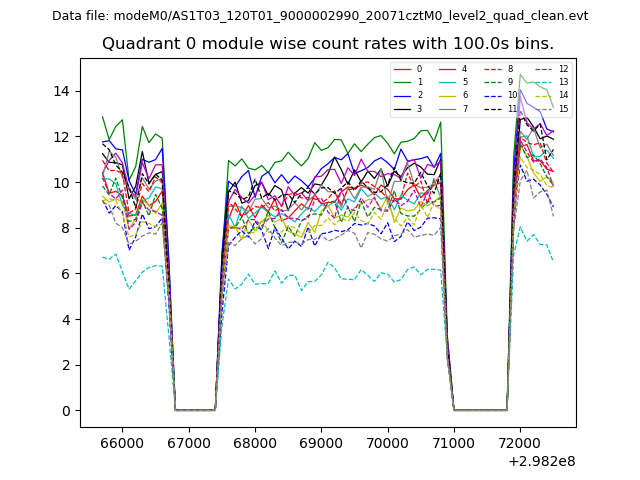 |
 |
| Module-wise count rates for Quadrant B Data is divided into 100 sec bins |
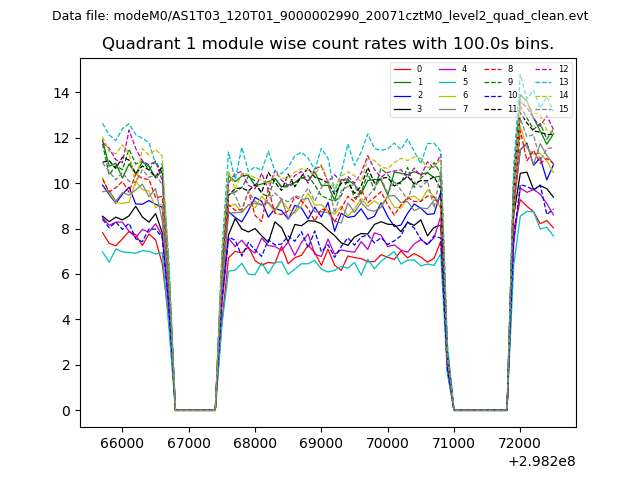 |
 |
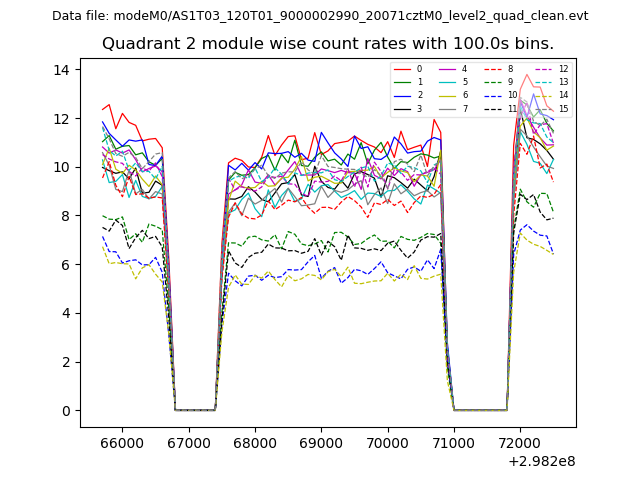
| Module-wise count rates for Quadrant C Data is divided into 100 sec bins |
 |
 |
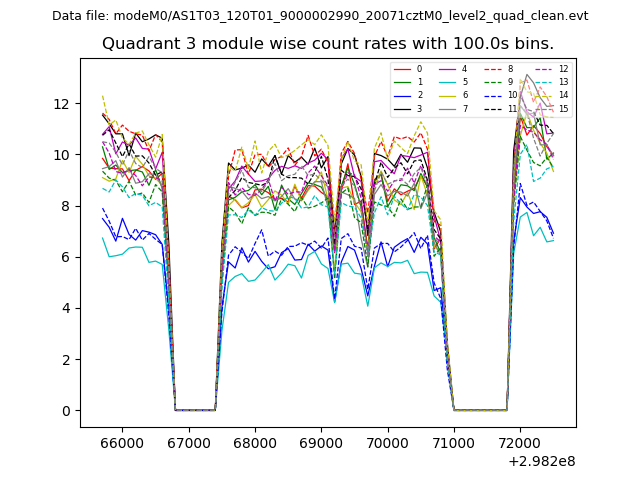
| Module-wise count rates for Quadrant D Data is divided into 100 sec bins |
 |
 |
| Parameter | Plot |
|---|---|
| CZT HV Monitor |  |
| D_VDD | 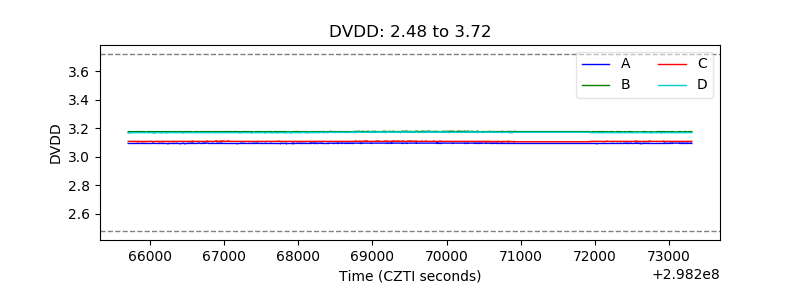 |
| Temperature 1 | 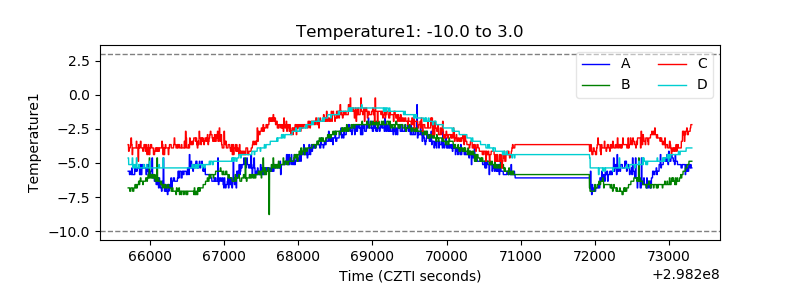 |
| Veto HV Monitor |  |
| Veto LLD | 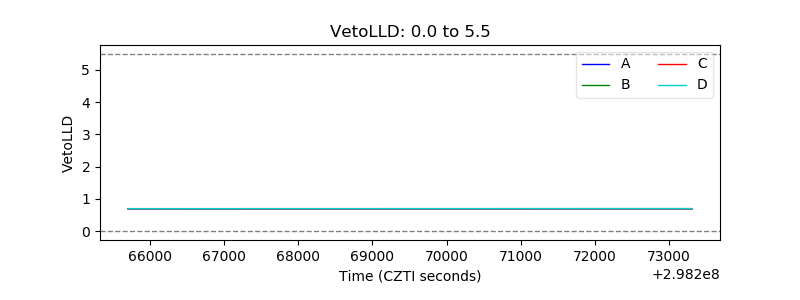 |
| Alpha Counter |  |
| _CPM_Rate | 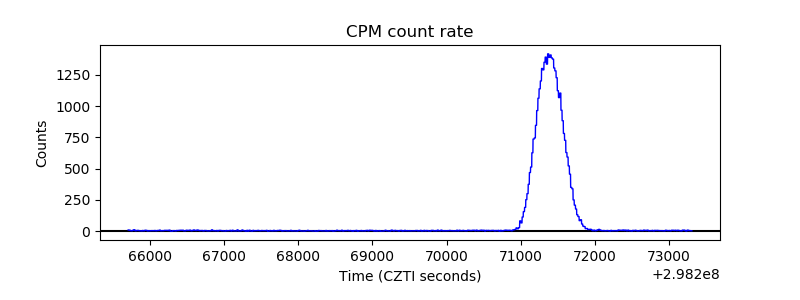 |
| CZT Counter | 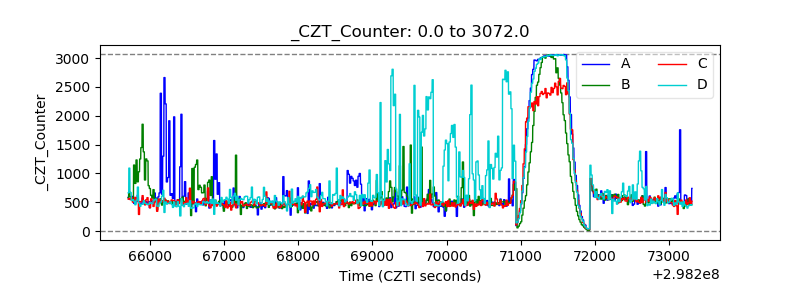 |
| +2.5 Volts monitor |  |
| +5 Volts monitor |  |
| _ROLL_ROT | 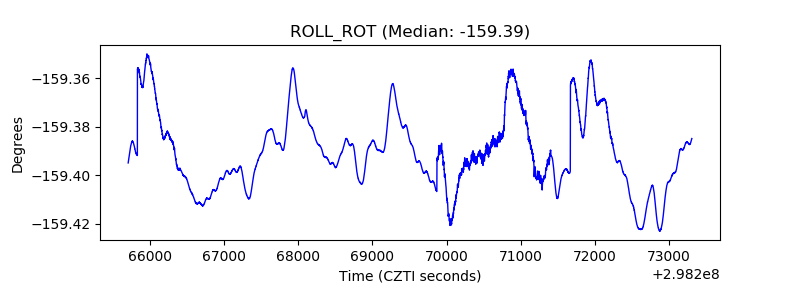 |
| _Roll_DEC | 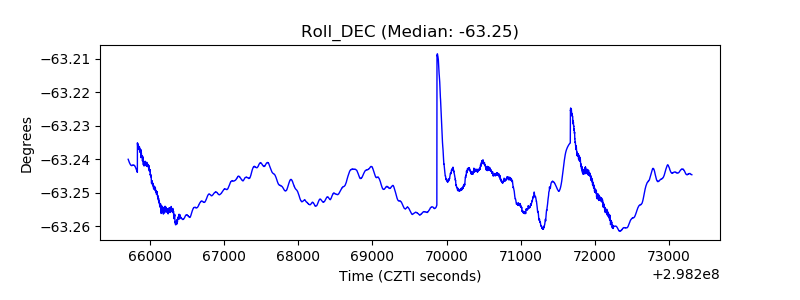 |
| _Roll_RA | 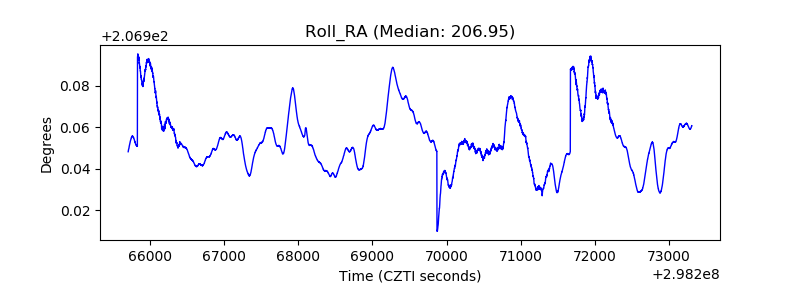 |
| Veto Counter | 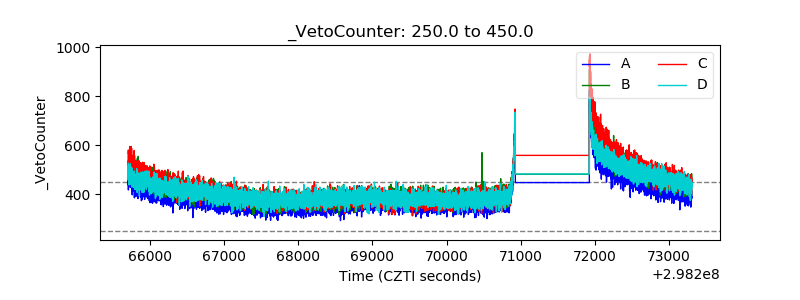 |