| Param | Original file | Final file |
|---|---|---|
| Filename | modeM0/AS1T03_120T01_9000002990_20073cztM0_level2.evt | modeM0/AS1T03_120T01_9000002990_20073cztM0_level2_quad_clean.evt |
| Size (bytes) | 572,068,800 | 103,334,400 |
| Size | 545.6 MB | 98.5 MB |
| Events in quadrant A | 3,545,260 | 709,663 |
| Events in quadrant B | 3,542,474 | 711,687 |
| Events in quadrant C | 3,216,495 | 692,051 |
| Events in quadrant D | 6,601,198 | 583,258 |
| Mode SS | |||
|---|---|---|---|
| Quadrant | BADHDUFLAG | Total packets | Discarded packets |
| A | 0 | 126 | 0 |
| B | 0 | 126 | 0 |
| C | 0 | 126 | 0 |
| D | 0 | 126 | 0 |
| Mode M9 | |||
|---|---|---|---|
| Quadrant | BADHDUFLAG | Total packets | Discarded packets |
| A | 0 | 11 | 0 |
| B | 0 | 11 | 0 |
| C | 0 | 11 | 0 |
| D | 0 | 11 | 0 |
| Mode M0 | |||
|---|---|---|---|
| Quadrant | BADHDUFLAG | Total packets | Discarded packets |
| A | 0 | 14326 | 1 |
| B | 0 | 14392 | 1 |
| C | 0 | 13360 | 1 |
| D | 0 | 23862 | 3 |
| Quadrant | Total seconds | Saturated seconds | Saturation percentage |
|---|---|---|---|
| A | 6195 | 184 | 2.970137% |
| B | 6196 | 137 | 2.211104% |
| C | 6196 | 108 | 1.743060% |
| D | 6195 | 1171 | 18.902341% |
Noise dominated data is calculated using 1-second bins in cleaned event files. If a bin has >2000 counts, and if more than 50% of those come from <1% of pixels, then it is considered to be noise-dominated and hence unusable.
| Quadrant | # 1 sec bins | Bins with >0 counts | Bins with >2000 counts | High rate bins dominated by noise | Noise dominated (total time) | Noise dominated (detector-on time) | Marked lightcurve |
|---|---|---|---|---|---|---|---|
| A | 7310 | 6196 | 80 | 80 | 1.09% | 1.29% | 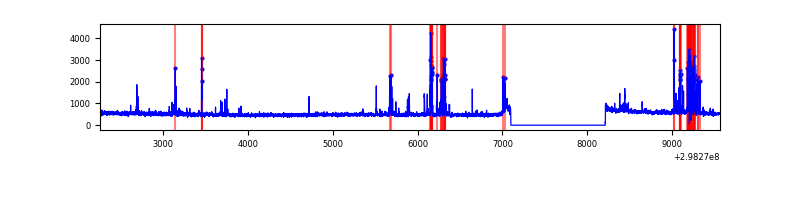 |
| B | 7311 | 6197 | 44 | 44 | 0.60% | 0.71% | 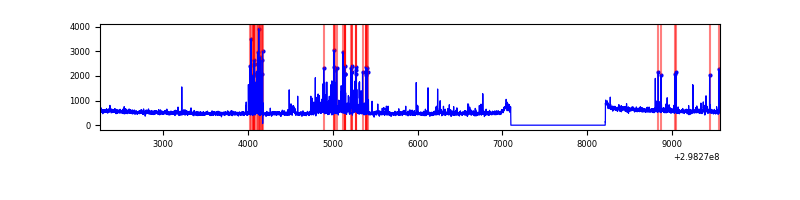 |
| C | 7311 | 6197 | 0 | 0 | 0.00% | 0.00% | 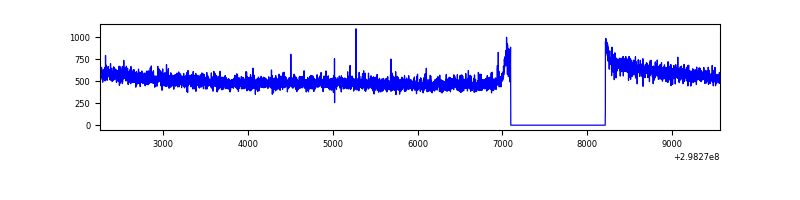 |
| D | 7310 | 6196 | 1105 | 1105 | 15.12% | 17.83% |  |
Top three noisy pixels from each quadrant. If the there are fewer than three noisy pixels in the level2.evt file, extra rows are filled as -1
| Pixel properties | Quadrant properties | ||||||
|---|---|---|---|---|---|---|---|
| Quadrant | DetID | PixID | Counts | Sigma | Mean | Median | Sigma |
| A | 14 | 238 | 350785 | 2137.76 | 811 | 798 | 163.7 |
| A | 4 | 2 | 56254 | 338.73 | 811 | 798 | 163.7 |
| A | 14 | 254 | 8330 | 46.01 | 811 | 798 | 163.7 |
| B | 7 | 220 | 198433 | 1292.17 | 807 | 790 | 153.0 |
| B | 4 | 80 | 100209 | 649.99 | 807 | 790 | 153.0 |
| B | 12 | 111 | 16783 | 104.56 | 807 | 790 | 153.0 |
| C | 14 | 238 | 126666 | 692.44 | 788 | 795 | 181.8 |
| C | 4 | 175 | 7857 | 38.85 | 788 | 795 | 181.8 |
| C | 3 | 233 | 7603 | 37.45 | 788 | 795 | 181.8 |
| D | 7 | 38 | 2761997 | 15543.55 | 733 | 713 | 177.6 |
| D | 1 | 52 | 895358 | 5036.05 | 733 | 713 | 177.6 |
| D | 12 | 218 | 152633 | 855.17 | 733 | 713 | 177.6 |
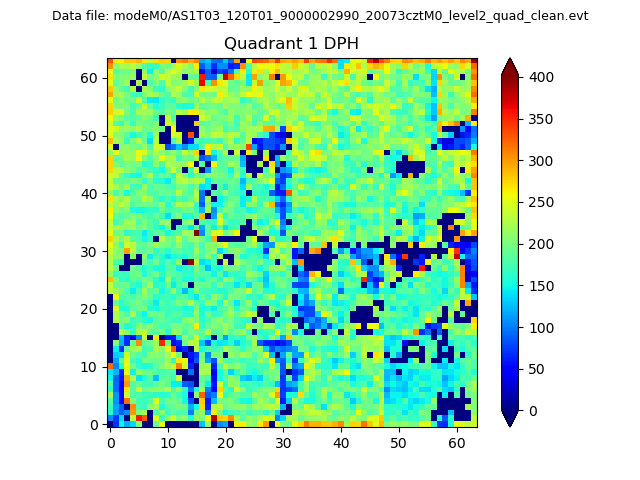
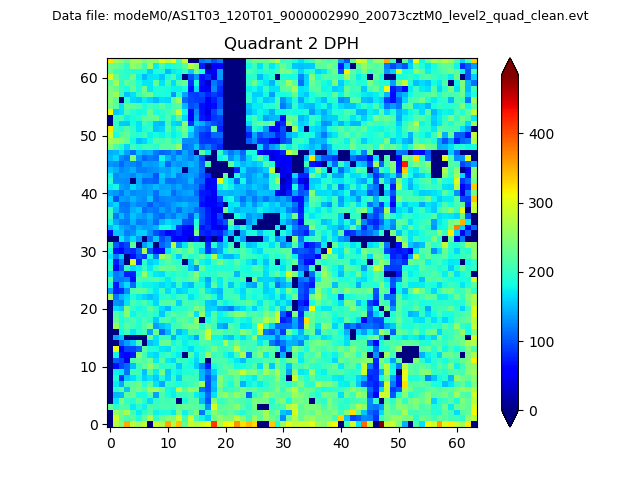
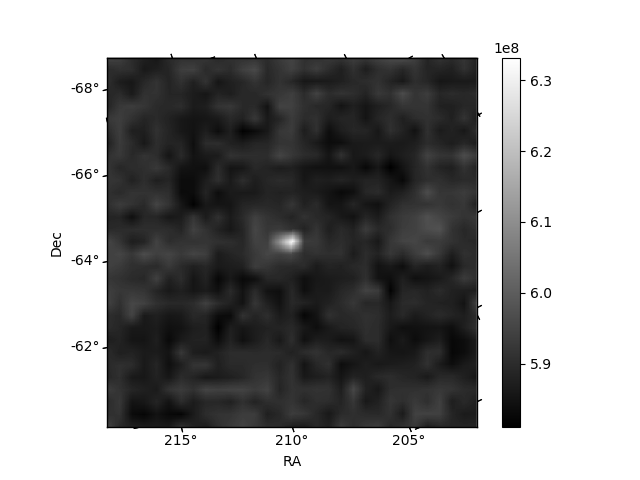
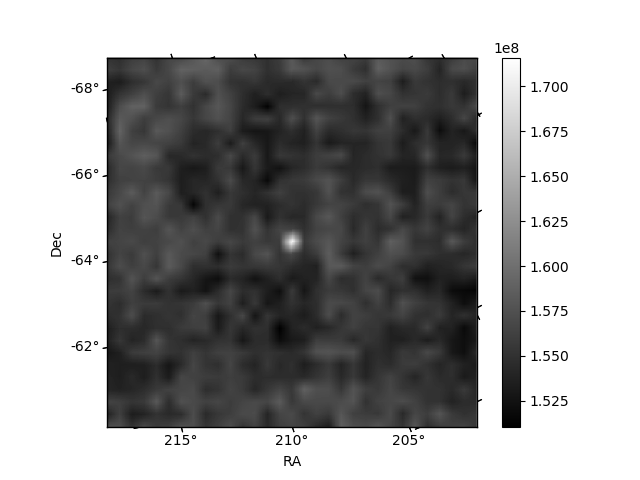
Histogram calculated using DETX and DETY for each event in the final _common_clean file
| Quadrant A | 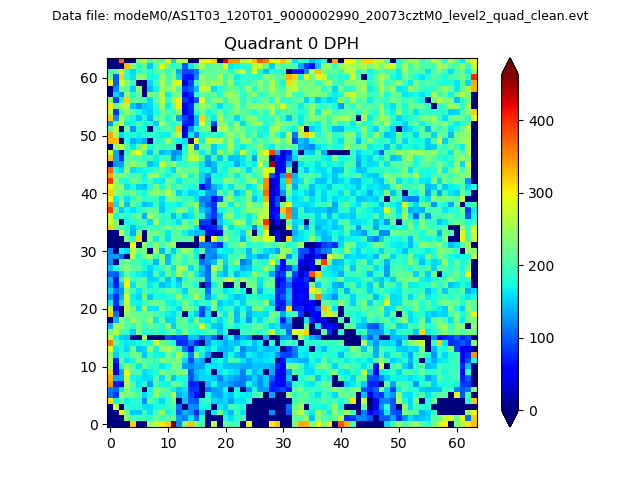 |
 |
Quadrant B |
|---|---|---|---|
| Quadrant D | 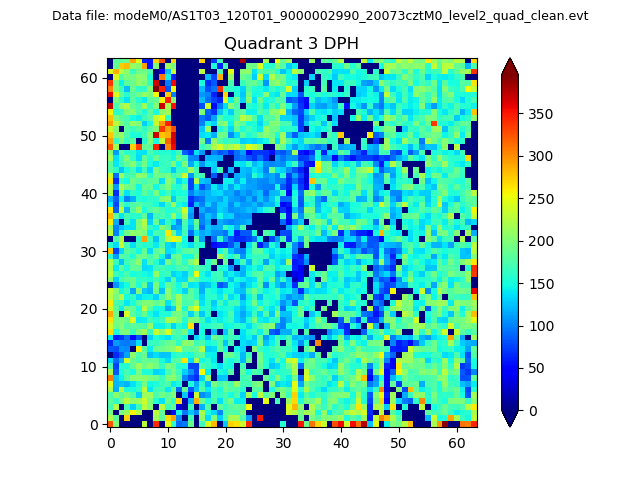 |
 |
Quadrant C |
| Plot type | Count rate plots | Images |
|---|---|---|
| Comparison with Poisson distribution Blue bars denote a histogram of data divided into 1 sec bins. Red curve is a Poisson curve with rate = median count rate of data. |
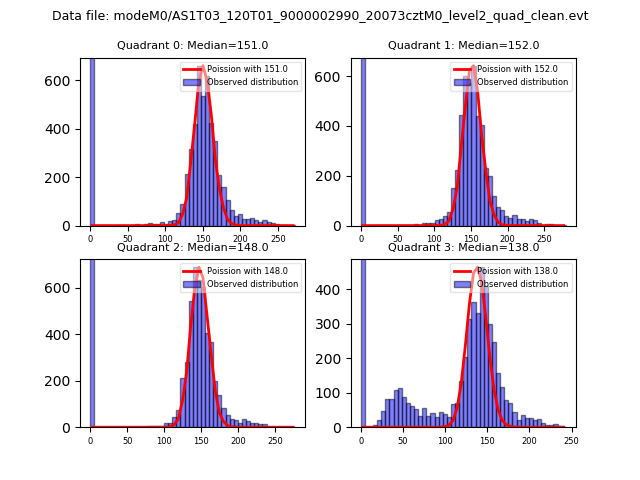 |
 |
| Quadrant-wise count rates Data is divided into 100 sec bins |
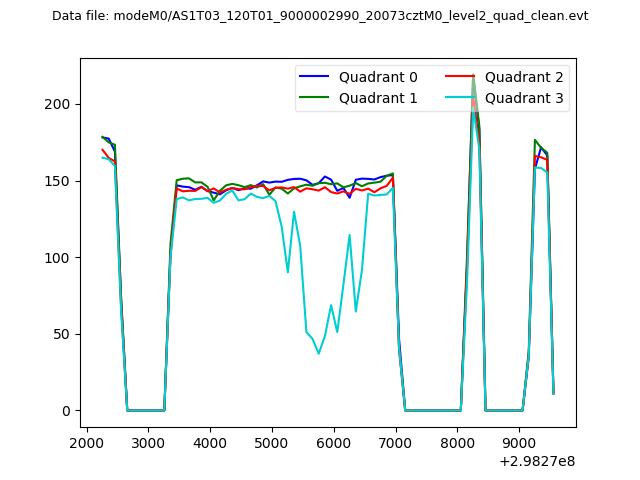 |
|
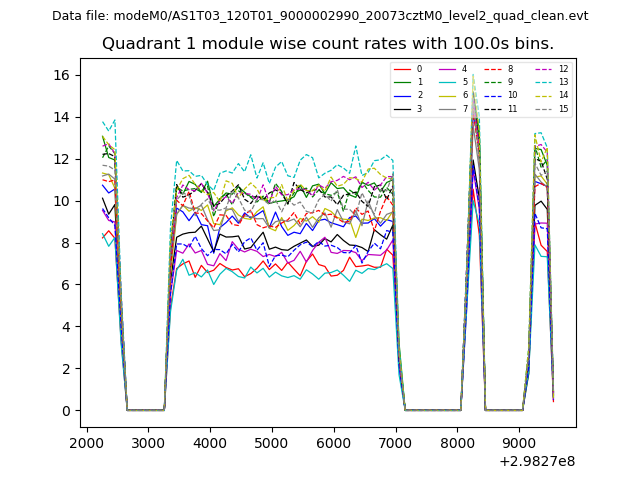
| Module-wise count rates for Quadrant A Data is divided into 100 sec bins |
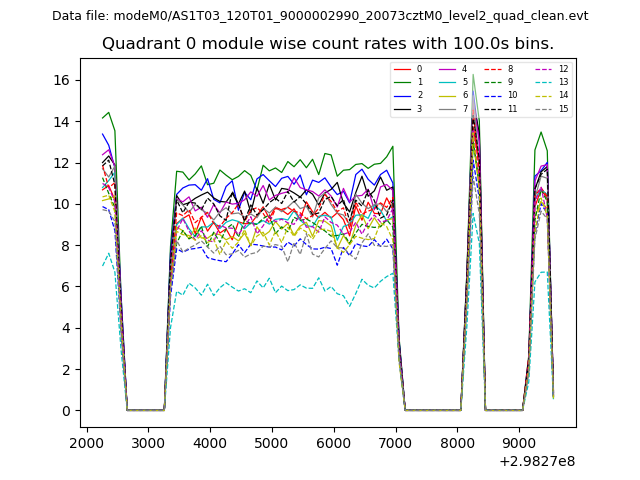 |
 |
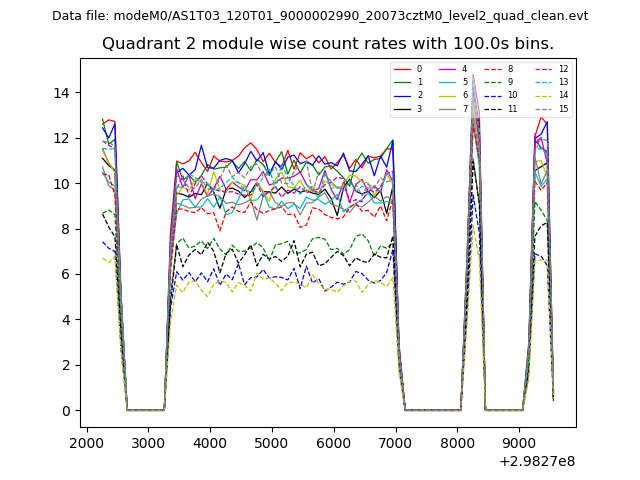
| Module-wise count rates for Quadrant B Data is divided into 100 sec bins |
 |
 |
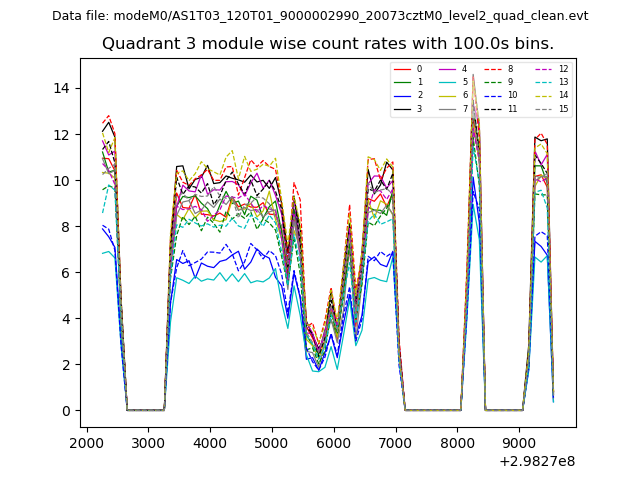
| Module-wise count rates for Quadrant C Data is divided into 100 sec bins |
 |
 |
| Module-wise count rates for Quadrant D Data is divided into 100 sec bins |
 |
 |
| Parameter | Plot |
|---|---|
| CZT HV Monitor | 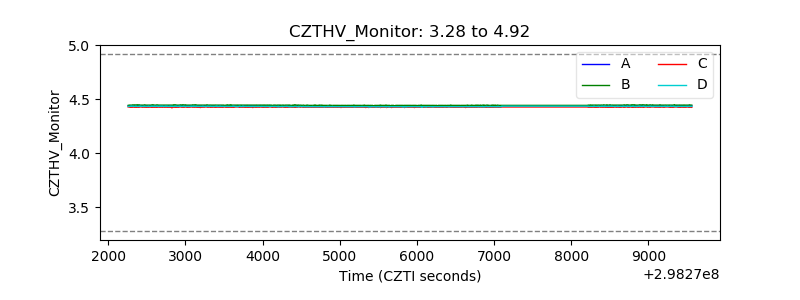 |
| D_VDD |  |
| Temperature 1 | 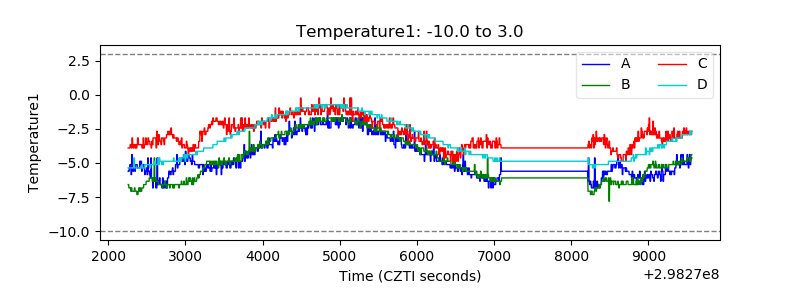 |
| Veto HV Monitor | 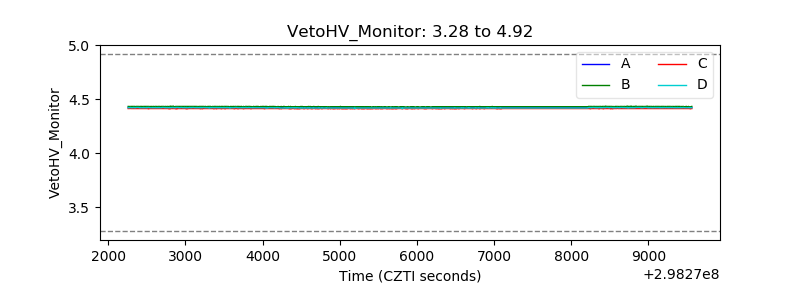 |
| Veto LLD | 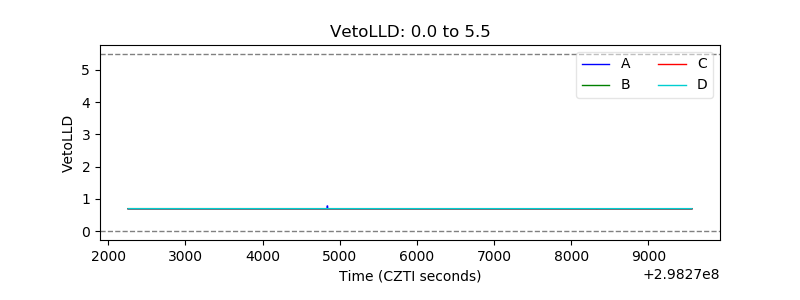 |
| Alpha Counter | 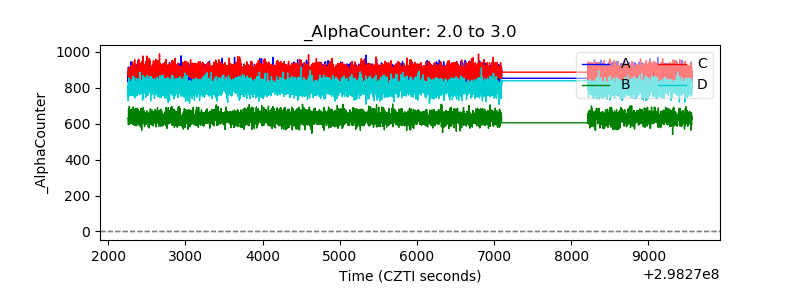 |
| _CPM_Rate | 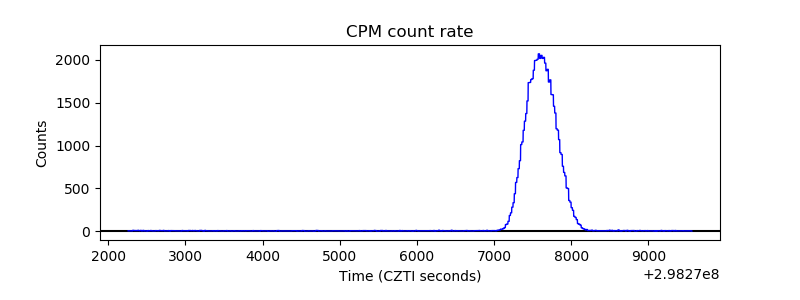 |
| CZT Counter | 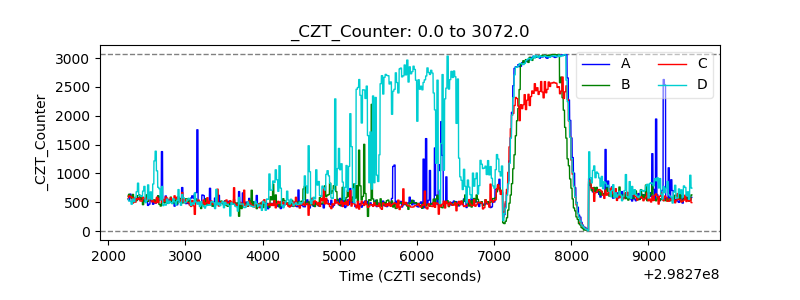 |
| +2.5 Volts monitor | 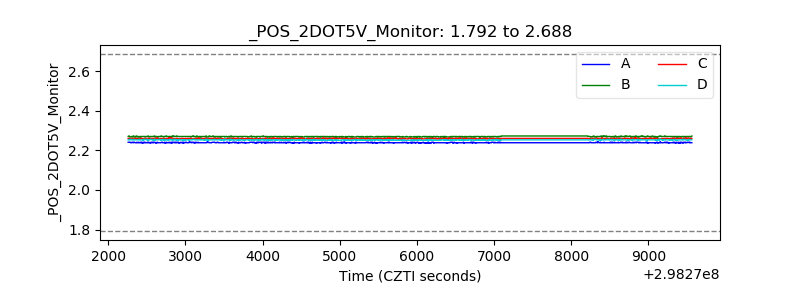 |
| +5 Volts monitor |  |
| _ROLL_ROT | 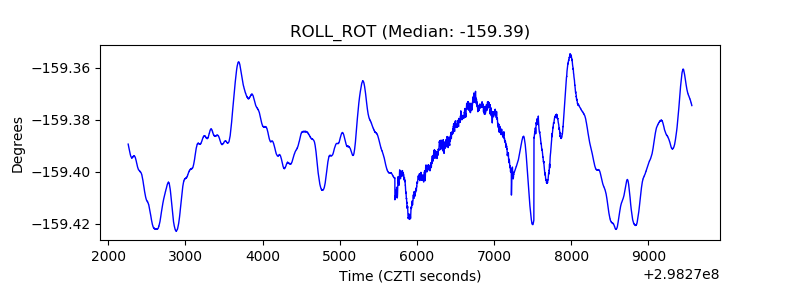 |
| _Roll_DEC | 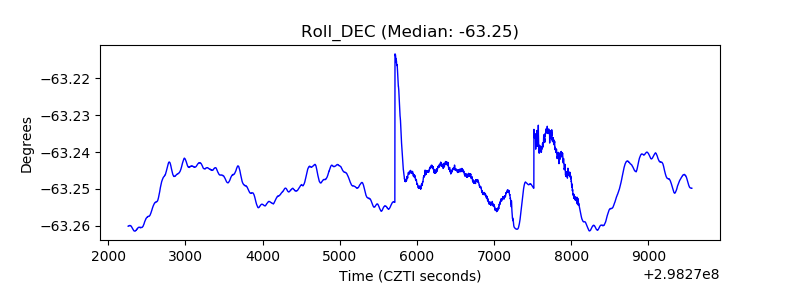 |
| _Roll_RA | 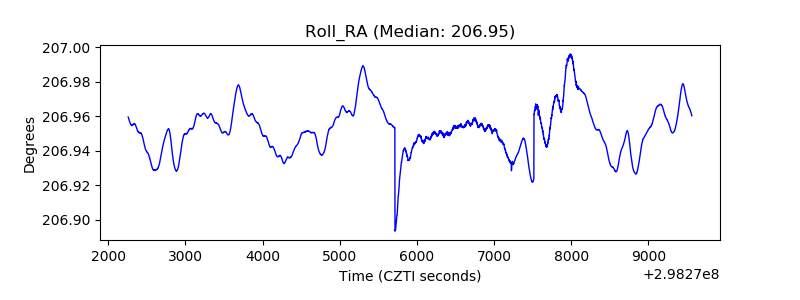 |
| Veto Counter | 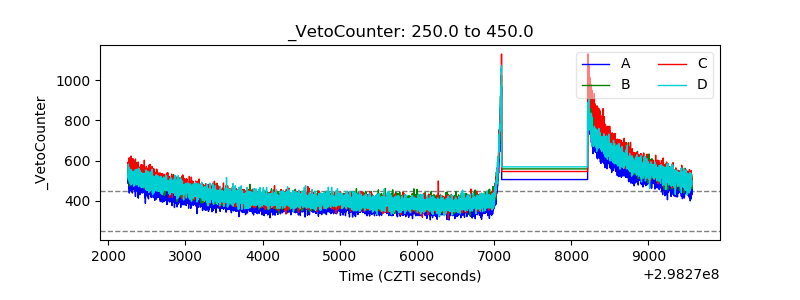 |