| Param | Original file | Final file |
|---|---|---|
| Filename | modeM0/AS1T03_120T01_9000002990_20074cztM0_level2.evt | modeM0/AS1T03_120T01_9000002990_20074cztM0_level2_quad_clean.evt |
| Size (bytes) | 426,510,720 | 78,341,760 |
| Size | 406.8 MB | 74.7 MB |
| Events in quadrant A | 2,551,222 | 549,633 |
| Events in quadrant B | 2,531,050 | 552,433 |
| Events in quadrant C | 2,206,660 | 539,635 |
| Events in quadrant D | 5,339,132 | 430,979 |
| Mode SS | |||
|---|---|---|---|
| Quadrant | BADHDUFLAG | Total packets | Discarded packets |
| A | 0 | 86 | 0 |
| B | 0 | 86 | 0 |
| C | 0 | 86 | 0 |
| D | 0 | 86 | 0 |
| Mode M0 | |||
|---|---|---|---|
| Quadrant | BADHDUFLAG | Total packets | Discarded packets |
| A | 0 | 10192 | 1 |
| B | 0 | 10179 | 1 |
| C | 0 | 9169 | 1 |
| D | 0 | 18791 | 1 |
| Quadrant | Total seconds | Saturated seconds | Saturation percentage |
|---|---|---|---|
| A | 4247 | 115 | 2.707794% |
| B | 4247 | 70 | 1.648222% |
| C | 4248 | 31 | 0.729755% |
| D | 4248 | 1094 | 25.753296% |
Noise dominated data is calculated using 1-second bins in cleaned event files. If a bin has >2000 counts, and if more than 50% of those come from <1% of pixels, then it is considered to be noise-dominated and hence unusable.
| Quadrant | # 1 sec bins | Bins with >0 counts | Bins with >2000 counts | High rate bins dominated by noise | Noise dominated (total time) | Noise dominated (detector-on time) | Marked lightcurve |
|---|---|---|---|---|---|---|---|
| A | 4247 | 4247 | 70 | 70 | 1.65% | 1.65% | 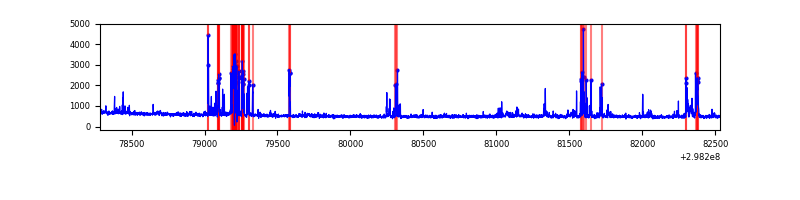 |
| B | 4247 | 4247 | 37 | 37 | 0.87% | 0.87% | 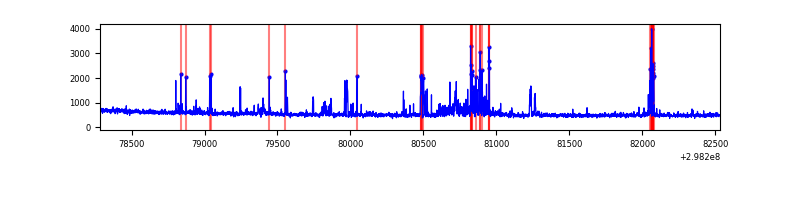 |
| C | 4248 | 4248 | 0 | 0 | 0.00% | 0.00% | 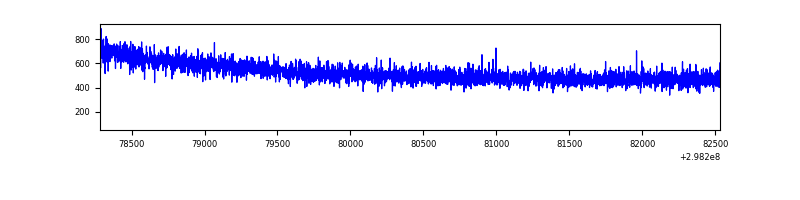 |
| D | 4248 | 4248 | 1107 | 1107 | 26.06% | 26.06% | 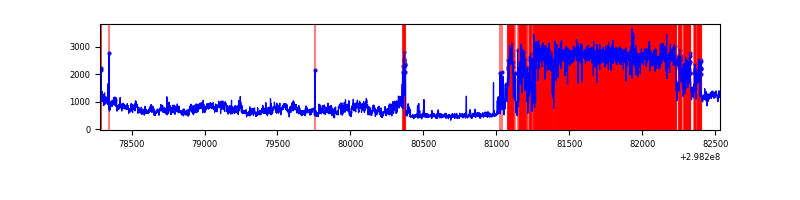 |
Top three noisy pixels from each quadrant. If the there are fewer than three noisy pixels in the level2.evt file, extra rows are filled as -1
| Pixel properties | Quadrant properties | ||||||
|---|---|---|---|---|---|---|---|
| Quadrant | DetID | PixID | Counts | Sigma | Mean | Median | Sigma |
| A | 14 | 238 | 369216 | 3299.6 | 558 | 550 | 111.7 |
| A | 4 | 2 | 18540 | 161.01 | 558 | 550 | 111.7 |
| A | 14 | 254 | 7891 | 65.7 | 558 | 550 | 111.7 |
| B | 7 | 220 | 156179 | 1487.67 | 556 | 546 | 104.6 |
| B | 10 | 245 | 80231 | 761.7 | 556 | 546 | 104.6 |
| B | 4 | 80 | 41541 | 391.87 | 556 | 546 | 104.6 |
| C | 14 | 238 | 87861 | 701.66 | 541 | 547 | 124.4 |
| C | 3 | 233 | 8314 | 62.42 | 541 | 547 | 124.4 |
| C | 13 | 61 | 3756 | 25.79 | 541 | 547 | 124.4 |
| D | 7 | 38 | 2547878 | 21734.12 | 487 | 476 | 117.2 |
| D | 1 | 52 | 826823 | 7050.29 | 487 | 476 | 117.2 |
| D | 12 | 218 | 82792 | 702.31 | 487 | 476 | 117.2 |
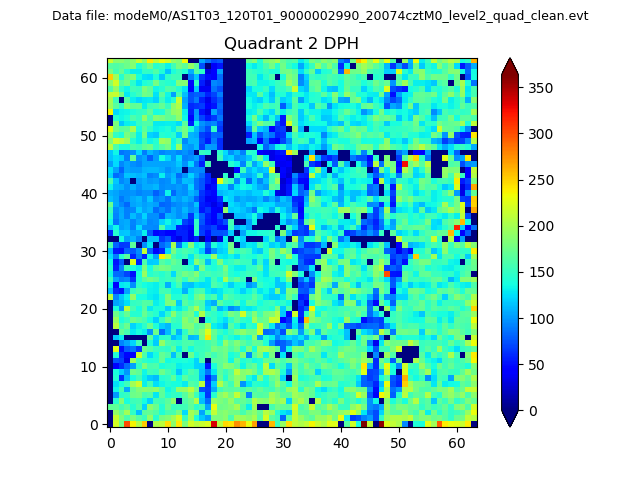
Histogram calculated using DETX and DETY for each event in the final _common_clean file
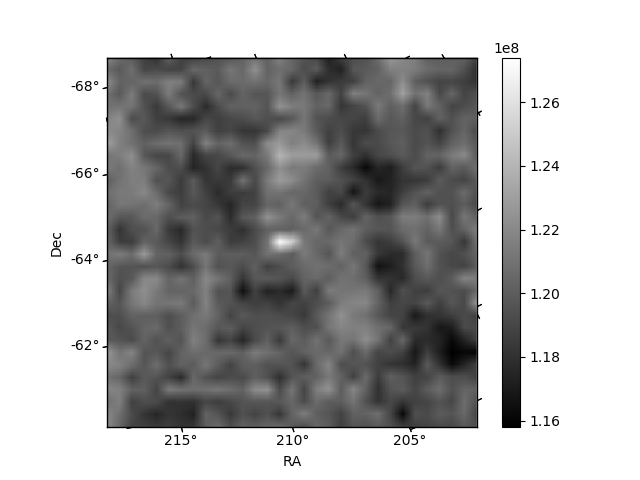
| Quadrant A | 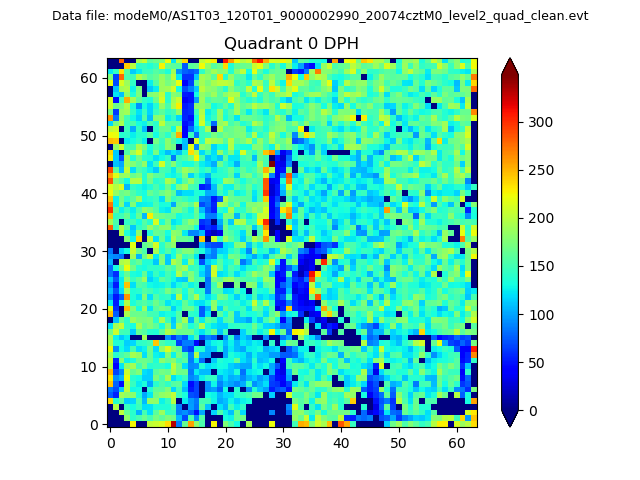 |
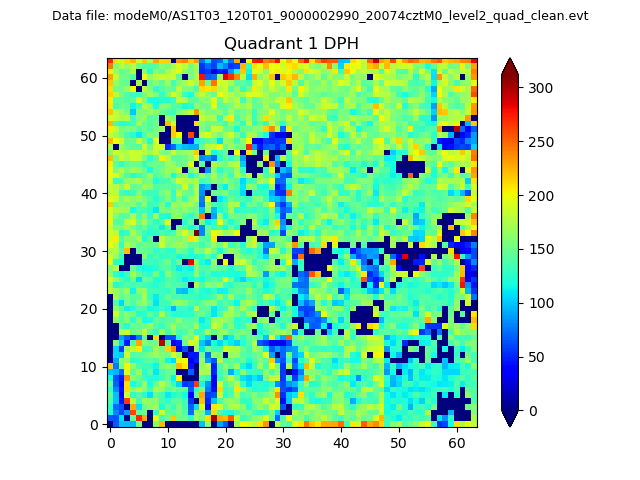 |
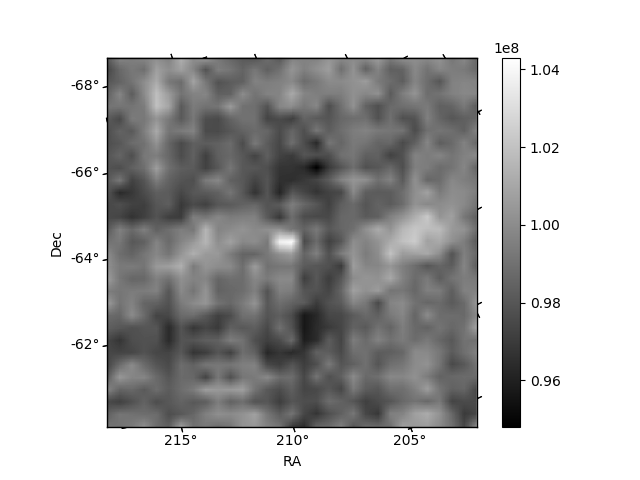
Quadrant B |
|---|---|---|---|
| Quadrant D | 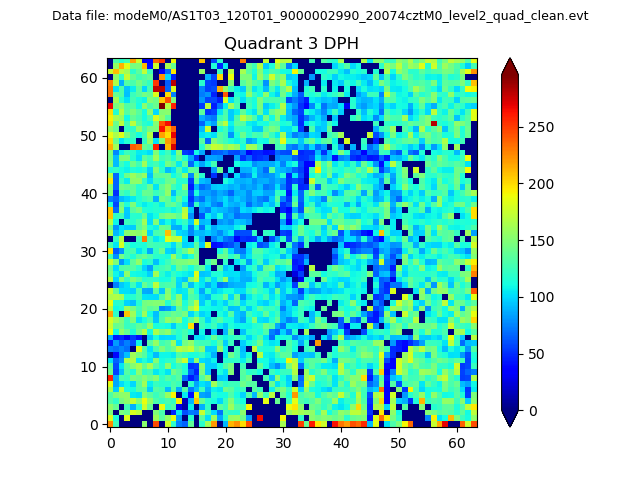 |
 |
Quadrant C |
| Plot type | Count rate plots | Images |
|---|---|---|
| Comparison with Poisson distribution Blue bars denote a histogram of data divided into 1 sec bins. Red curve is a Poisson curve with rate = median count rate of data. |
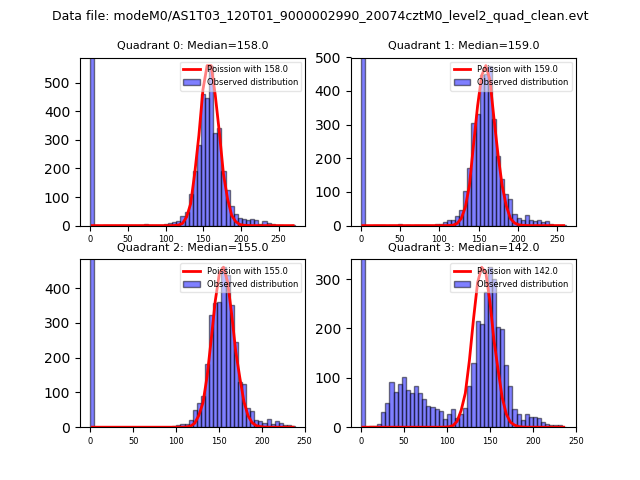 |
 |
| Quadrant-wise count rates Data is divided into 100 sec bins |
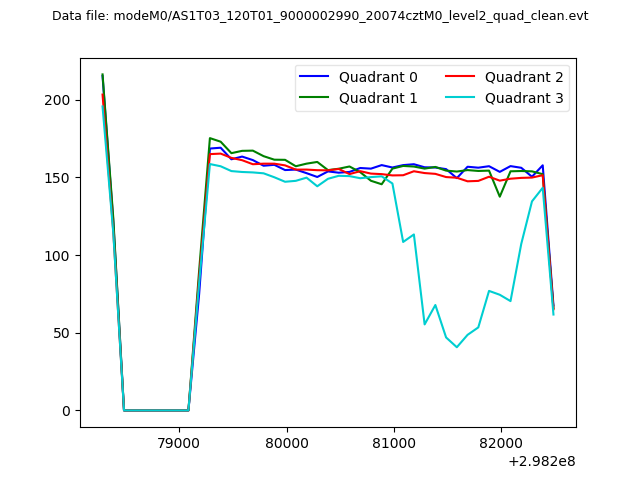 |
|
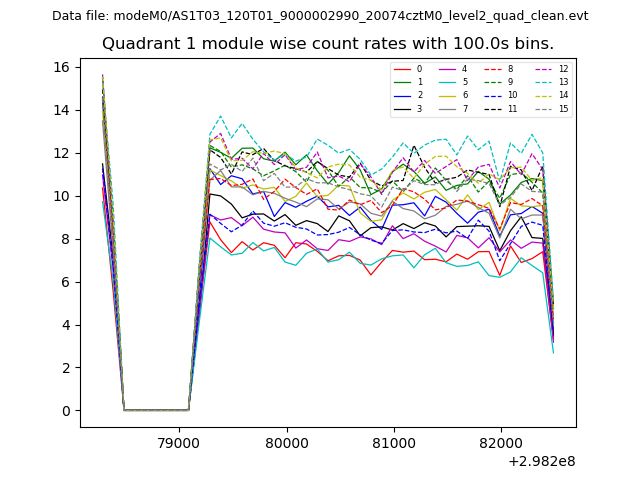
| Module-wise count rates for Quadrant A Data is divided into 100 sec bins |
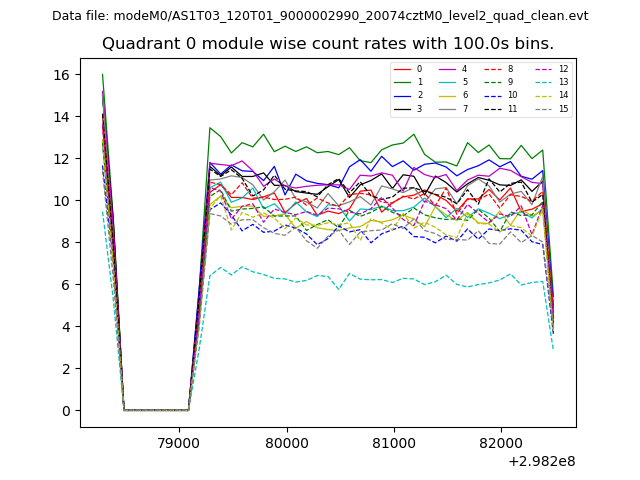 |
 |
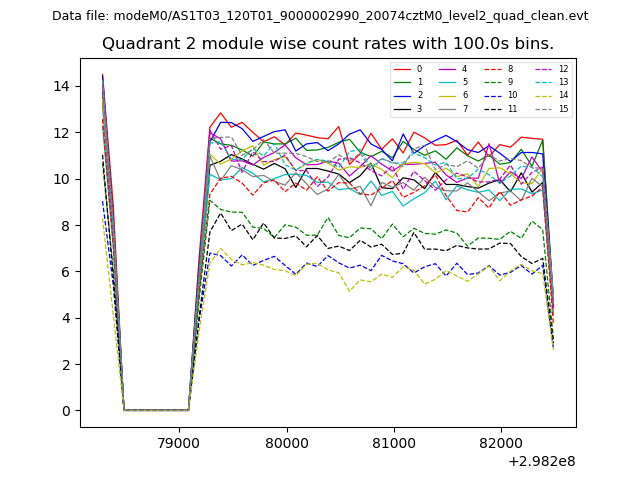
| Module-wise count rates for Quadrant B Data is divided into 100 sec bins |
 |
 |
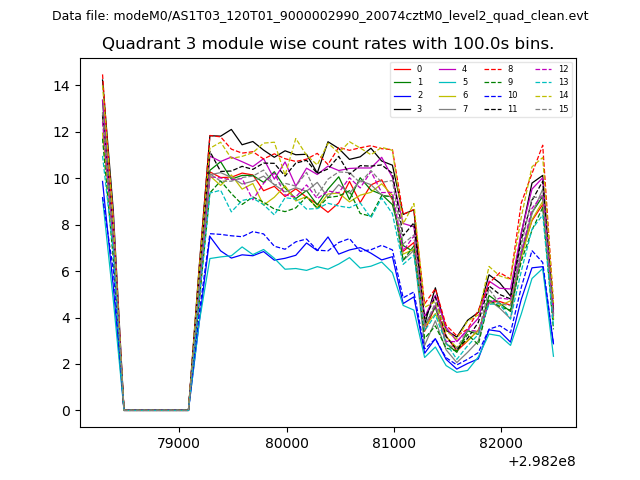
| Module-wise count rates for Quadrant C Data is divided into 100 sec bins |
 |
 |
| Module-wise count rates for Quadrant D Data is divided into 100 sec bins |
 |
 |
| Parameter | Plot |
|---|---|
| CZT HV Monitor | 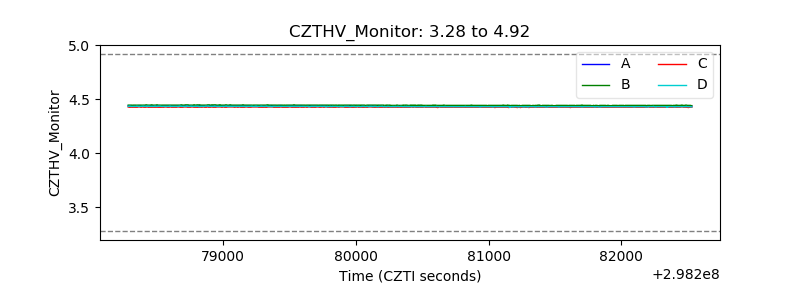 |
| D_VDD |  |
| Temperature 1 | 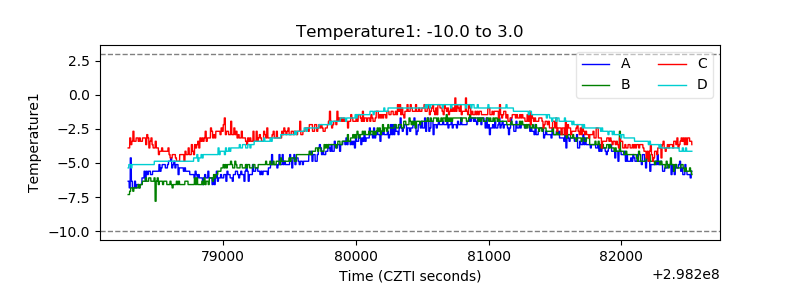 |
| Veto HV Monitor | 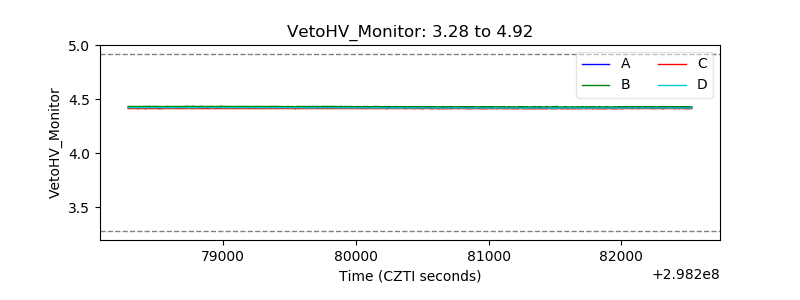 |
| Veto LLD | 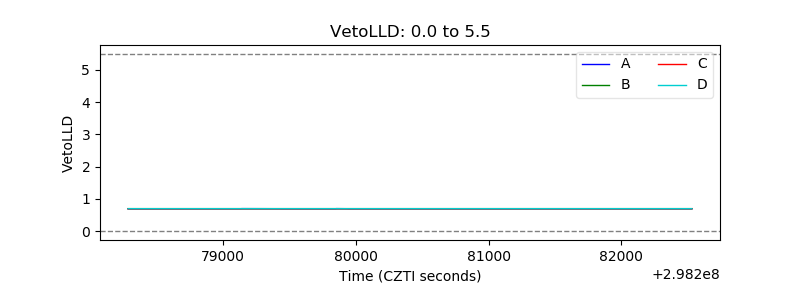 |
| Alpha Counter | 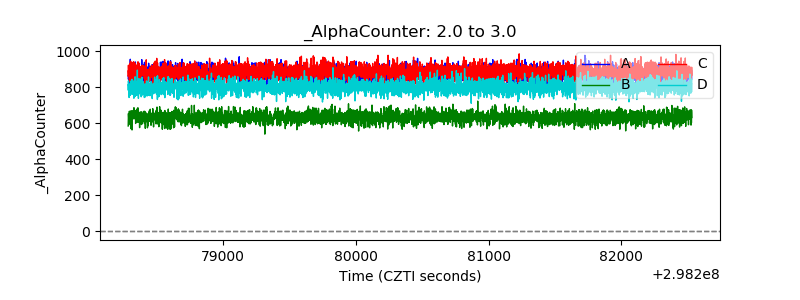 |
| _CPM_Rate | 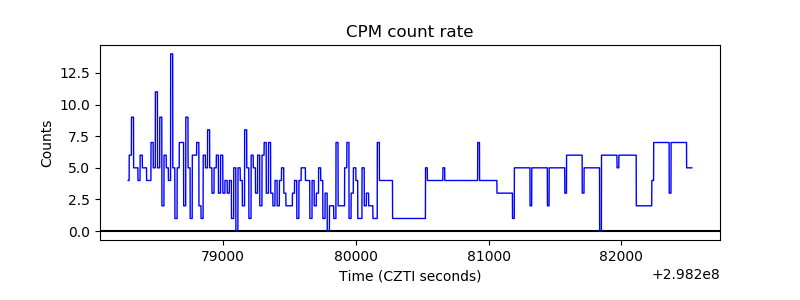 |
| CZT Counter | 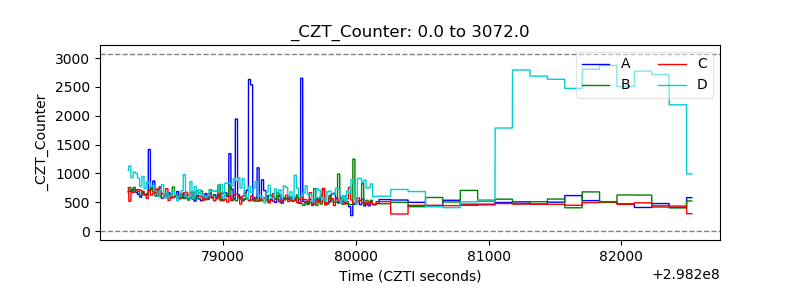 |
| +2.5 Volts monitor |  |
| +5 Volts monitor |  |
| _ROLL_ROT | 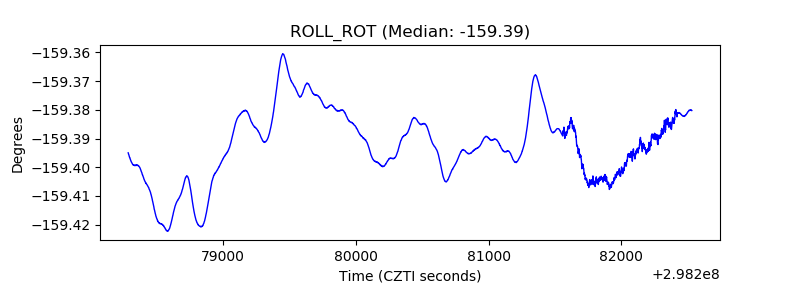 |
| _Roll_DEC | 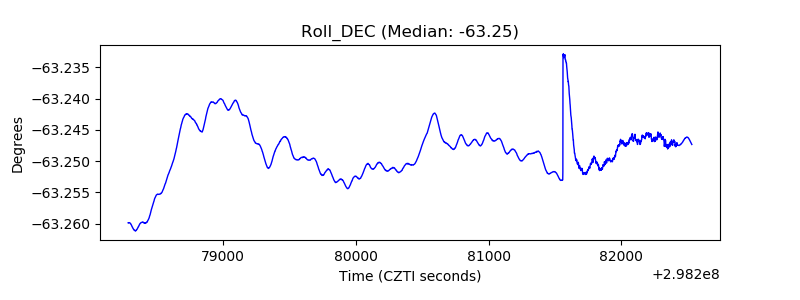 |
| _Roll_RA |  |
| Veto Counter | 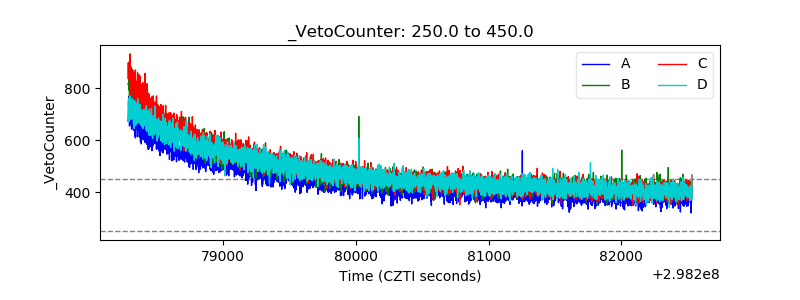 |