| Param | Original file | Final file |
|---|---|---|
| Filename | modeM0/AS1A05_180T01_9000002992_20074cztM0_level2.evt | modeM0/AS1A05_180T01_9000002992_20074cztM0_level2_quad_clean.evt |
| Size (bytes) | 121,057,920 | 16,200,000 |
| Size | 115.4 MB | 15.4 MB |
| Events in quadrant A | 837,226 | 100,470 |
| Events in quadrant B | 819,850 | 102,353 |
| Events in quadrant C | 786,652 | 95,221 |
| Events in quadrant D | 1,129,201 | 91,981 |
| Mode M9 | |||
|---|---|---|---|
| Quadrant | BADHDUFLAG | Total packets | Discarded packets |
| A | 0 | 3 | 0 |
| B | 0 | 3 | 0 |
| C | 0 | 3 | 0 |
| D | 0 | 3 | 0 |
| Mode M0 | |||
|---|---|---|---|
| Quadrant | BADHDUFLAG | Total packets | Discarded packets |
| A | 0 | 3406 | 1 |
| B | 0 | 3345 | 1 |
| C | 0 | 3232 | 1 |
| D | 0 | 4299 | 2 |
| Mode SS | |||
|---|---|---|---|
| Quadrant | BADHDUFLAG | Total packets | Discarded packets |
| A | 0 | 28 | 0 |
| B | 0 | 28 | 0 |
| C | 0 | 28 | 0 |
| D | 0 | 28 | 0 |
| Quadrant | Total seconds | Saturated seconds | Saturation percentage |
|---|---|---|---|
| A | 1331 | 6 | 0.450789% |
| B | 1331 | 12 | 0.901578% |
| C | 1331 | 9 | 0.676183% |
| D | 1330 | 49 | 3.684211% |
Noise dominated data is calculated using 1-second bins in cleaned event files. If a bin has >2000 counts, and if more than 50% of those come from <1% of pixels, then it is considered to be noise-dominated and hence unusable.
| Quadrant | # 1 sec bins | Bins with >0 counts | Bins with >2000 counts | High rate bins dominated by noise | Noise dominated (total time) | Noise dominated (detector-on time) | Marked lightcurve |
|---|---|---|---|---|---|---|---|
| A | 1331 | 1331 | 3 | 3 | 0.23% | 0.23% | 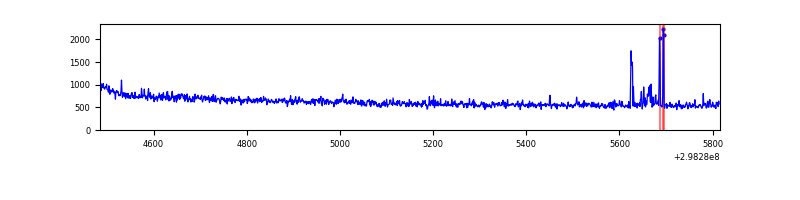 |
| B | 1331 | 1331 | 2 | 2 | 0.15% | 0.15% | 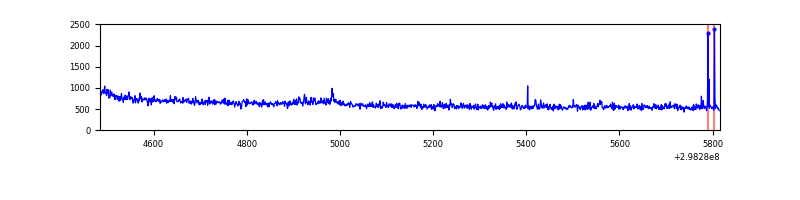 |
| C | 1331 | 1331 | 0 | 0 | 0.00% | 0.00% | 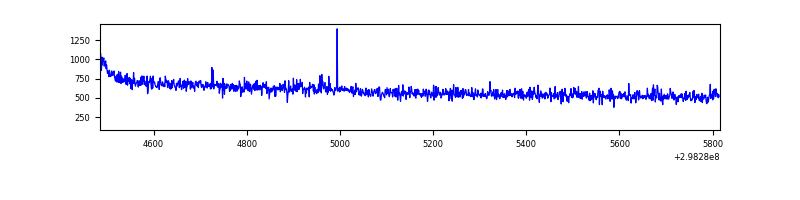 |
| D | 1330 | 1330 | 44 | 44 | 3.31% | 3.31% | 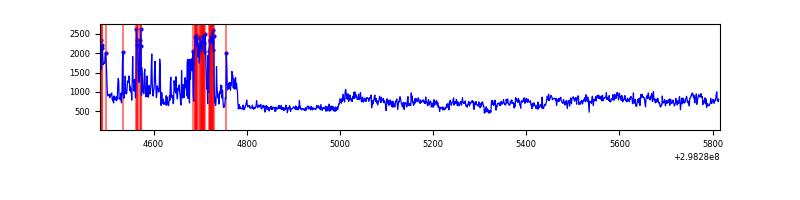 |
Top three noisy pixels from each quadrant. If the there are fewer than three noisy pixels in the level2.evt file, extra rows are filled as -1
| Pixel properties | Quadrant properties | ||||||
|---|---|---|---|---|---|---|---|
| Quadrant | DetID | PixID | Counts | Sigma | Mean | Median | Sigma |
| A | 4 | 2 | 18942 | 434.76 | 210 | 207 | 43.1 |
| A | 11 | 29 | 7649 | 172.7 | 210 | 207 | 43.1 |
| A | 0 | 226 | 1868 | 38.55 | 210 | 207 | 43.1 |
| B | 4 | 80 | 7205 | 174.5 | 204 | 200 | 40.1 |
| B | 15 | 201 | 7144 | 172.98 | 204 | 200 | 40.1 |
| B | 12 | 111 | 4333 | 102.95 | 204 | 200 | 40.1 |
| C | 14 | 238 | 32415 | 707.98 | 192 | 194 | 45.5 |
| C | 4 | 254 | 2690 | 54.84 | 192 | 194 | 45.5 |
| C | 3 | 233 | 2087 | 41.59 | 192 | 194 | 45.5 |
| D | 1 | 52 | 203757 | 4148.17 | 196 | 191 | 49.1 |
| D | 7 | 223 | 153032 | 3114.52 | 196 | 191 | 49.1 |
| D | 12 | 218 | 25053 | 506.63 | 196 | 191 | 49.1 |
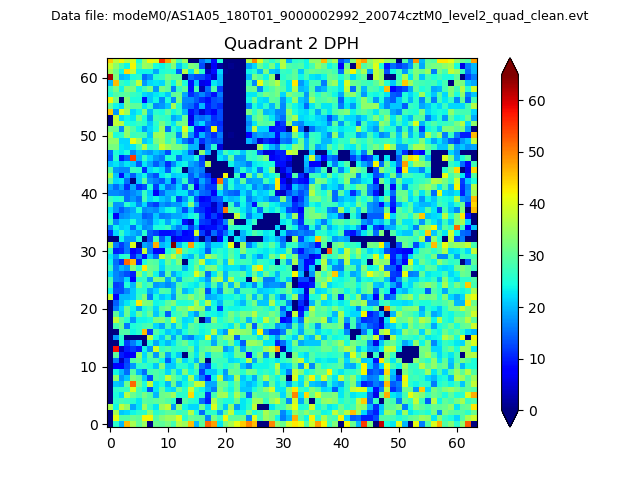
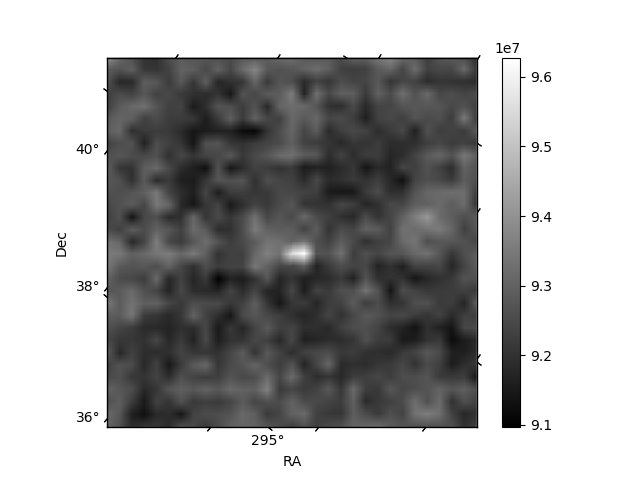
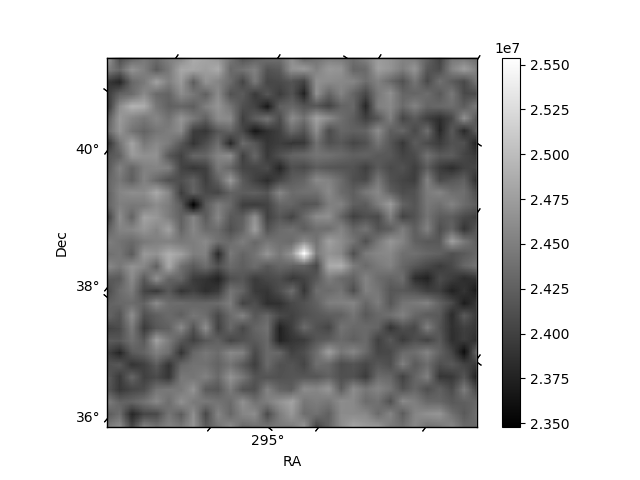
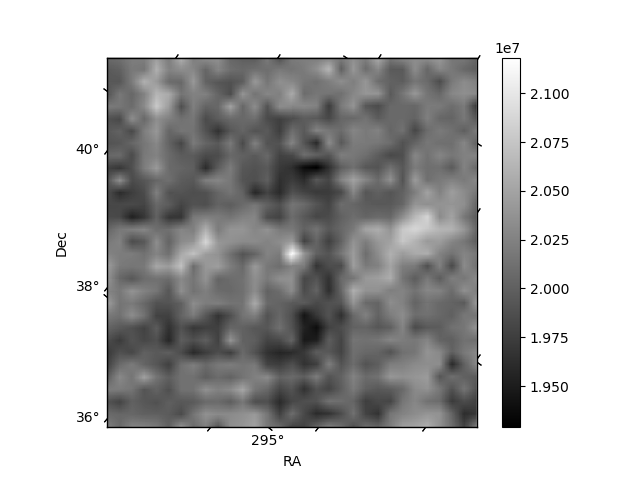
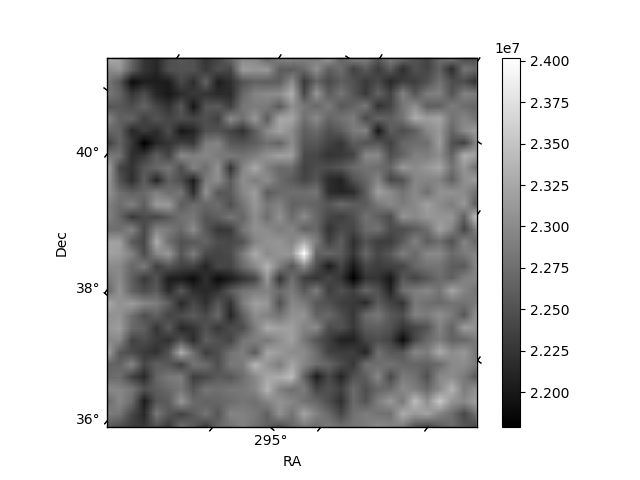
Histogram calculated using DETX and DETY for each event in the final _common_clean file
| Quadrant A | 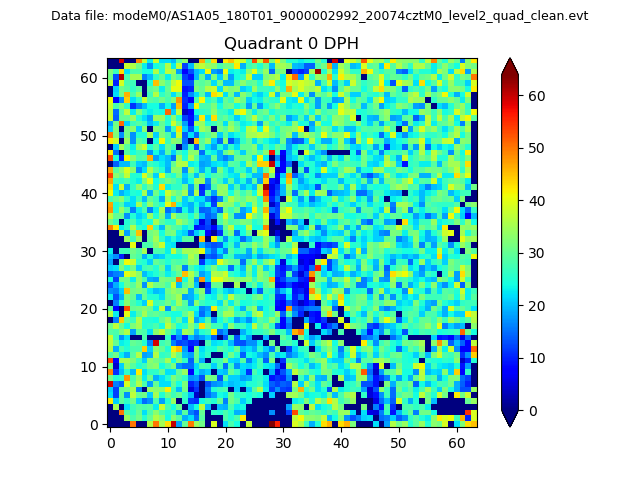 |
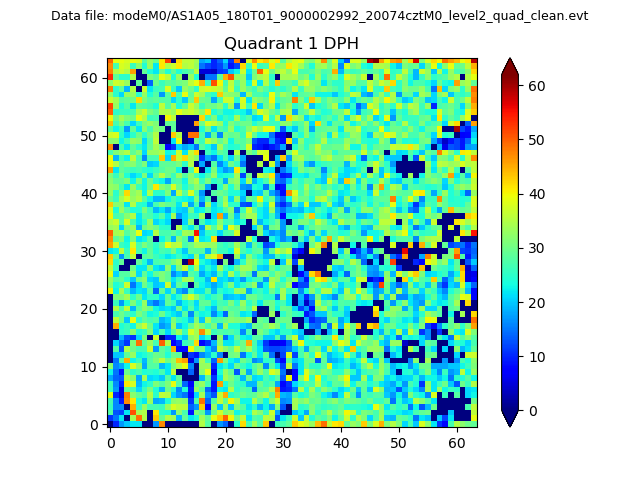 |
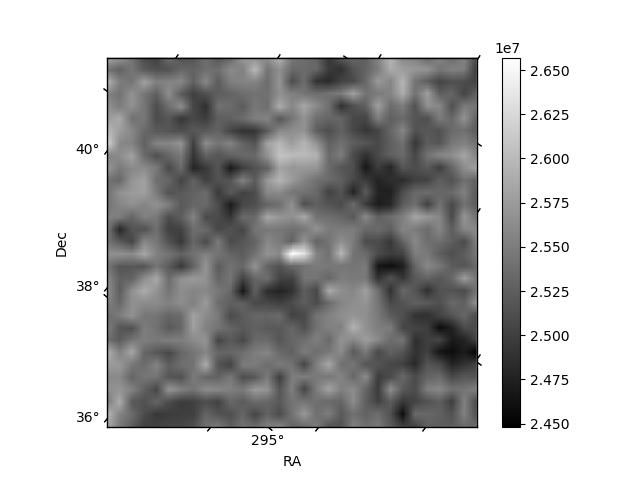
Quadrant B |
|---|---|---|---|
| Quadrant D | 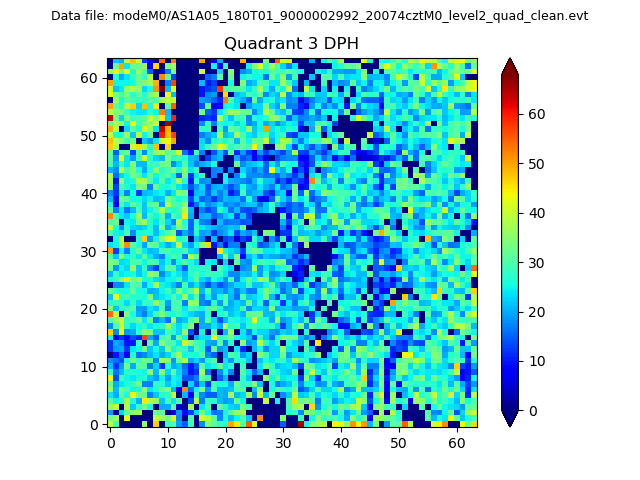 |
 |
Quadrant C |
| Plot type | Count rate plots | Images |
|---|---|---|
| Comparison with Poisson distribution Blue bars denote a histogram of data divided into 1 sec bins. Red curve is a Poisson curve with rate = median count rate of data. |
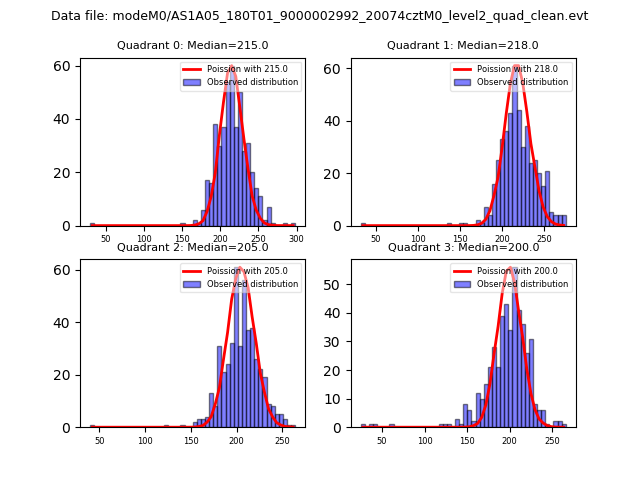 |
 |
| Quadrant-wise count rates Data is divided into 100 sec bins |
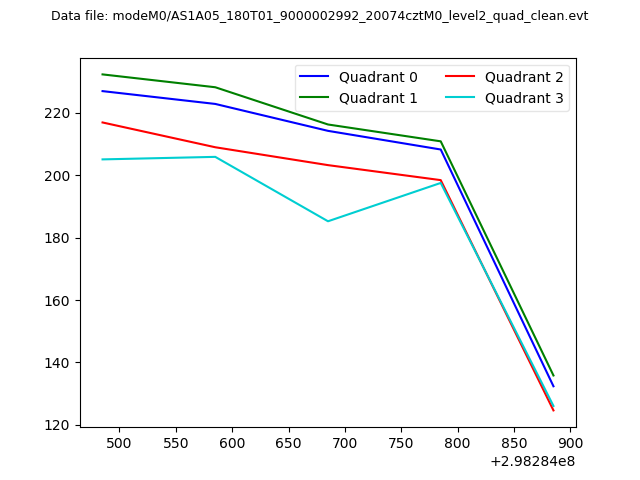 |
|
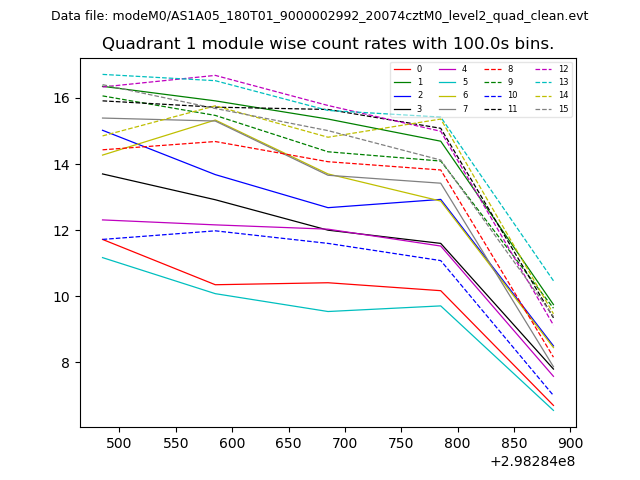
| Module-wise count rates for Quadrant A Data is divided into 100 sec bins |
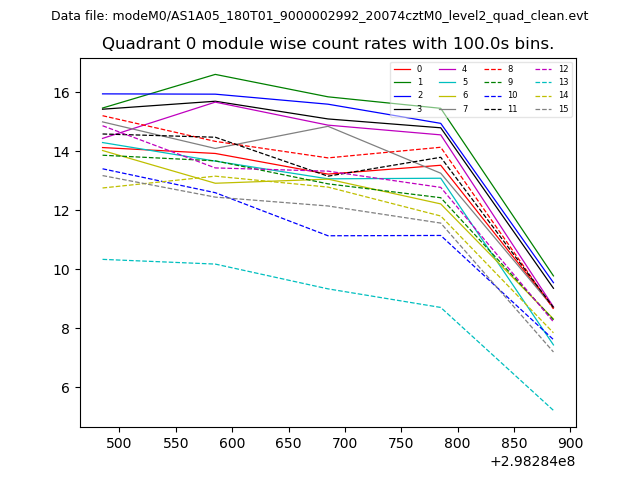 |
 |
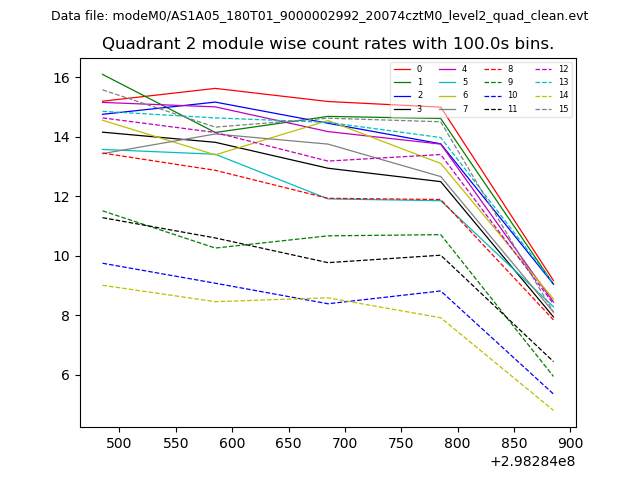
| Module-wise count rates for Quadrant B Data is divided into 100 sec bins |
 |
 |
| Module-wise count rates for Quadrant C Data is divided into 100 sec bins |
 |
 |
| Module-wise count rates for Quadrant D Data is divided into 100 sec bins |
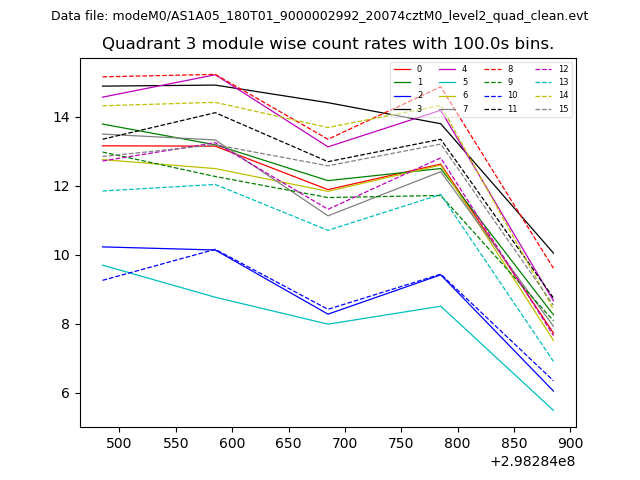 |
 |
| Parameter | Plot |
|---|---|
| CZT HV Monitor | 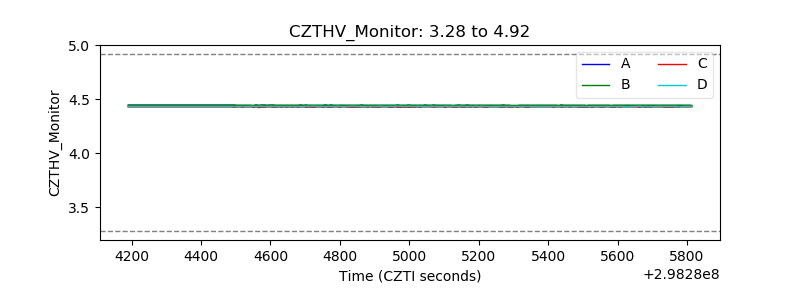 |
| D_VDD | 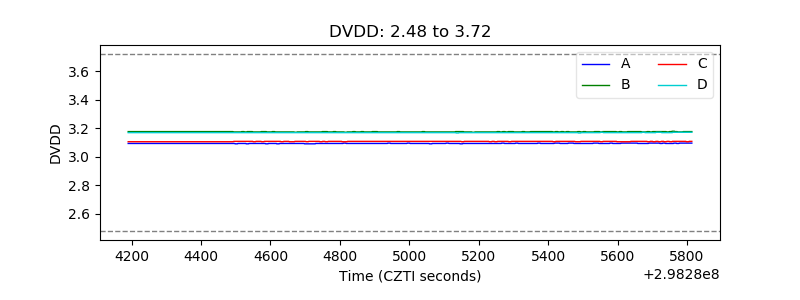 |
| Temperature 1 | 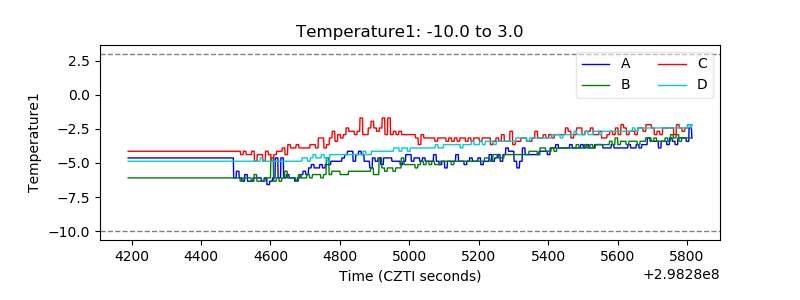 |
| Veto HV Monitor | 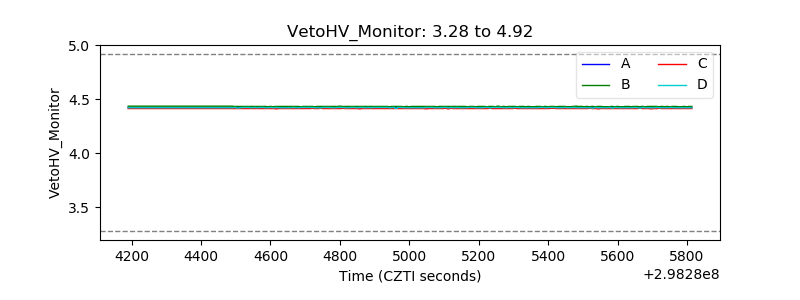 |
| Veto LLD | 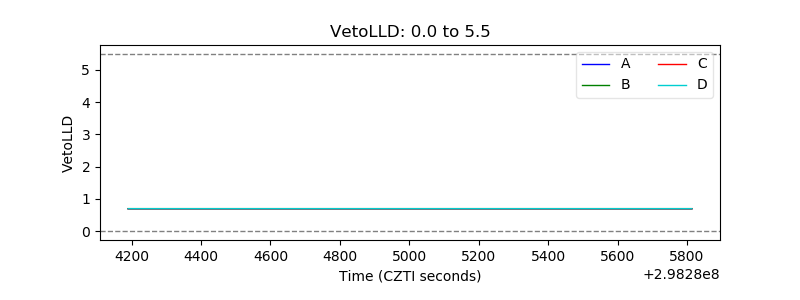 |
| Alpha Counter | 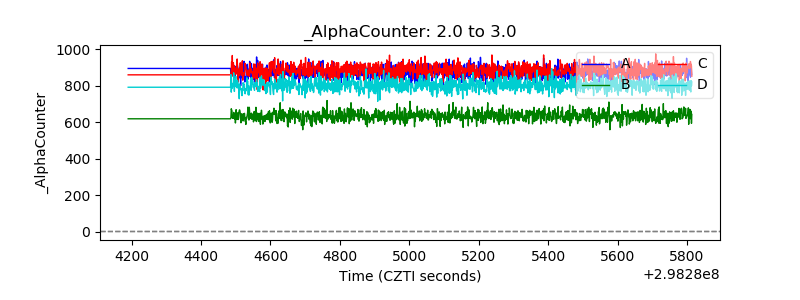 |
| _CPM_Rate | 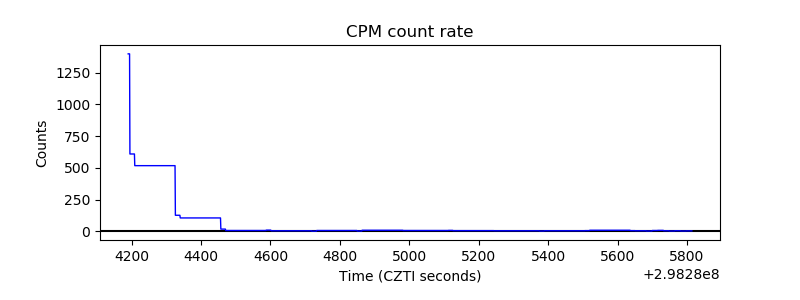 |
| CZT Counter | 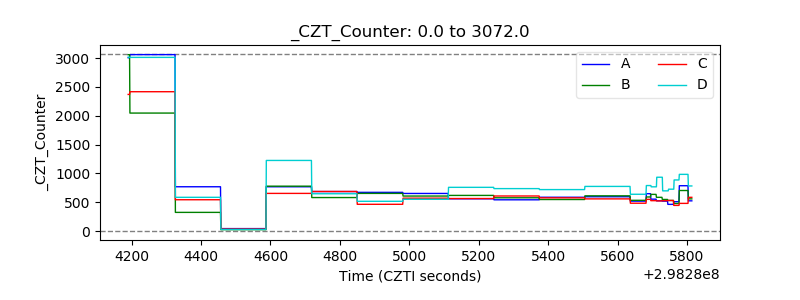 |
| +2.5 Volts monitor | 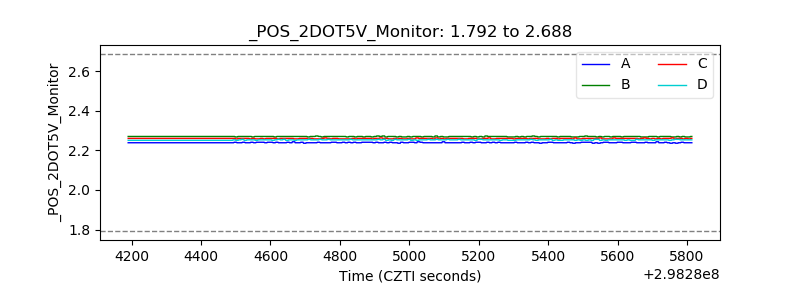 |
| +5 Volts monitor | 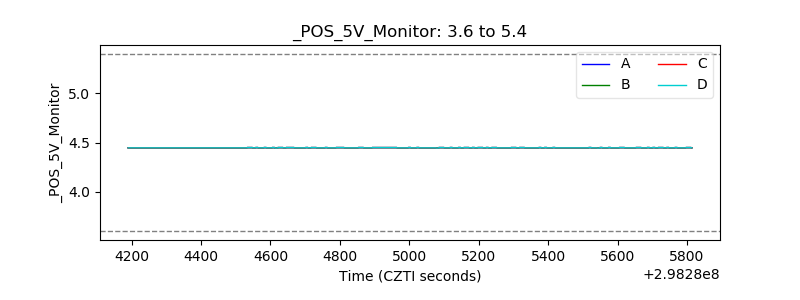 |
| _ROLL_ROT | 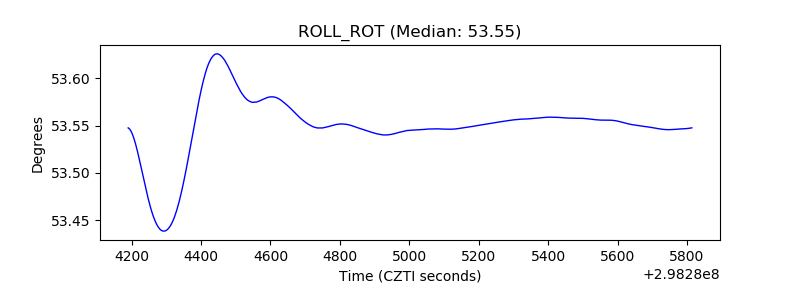 |
| _Roll_DEC | 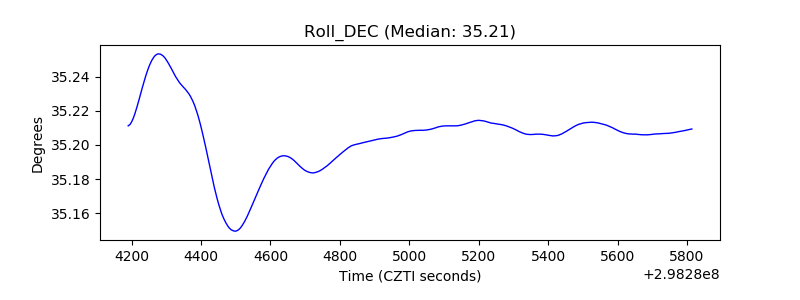 |
| _Roll_RA | 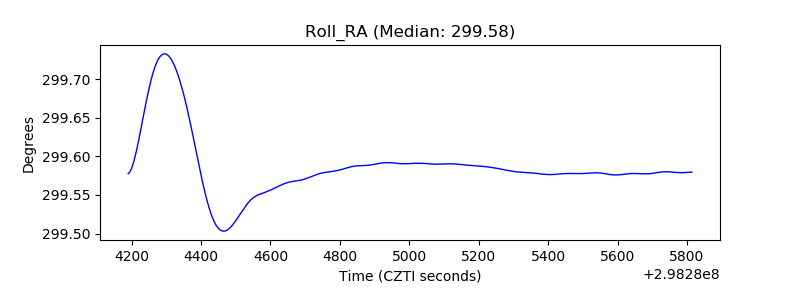 |
| Veto Counter | 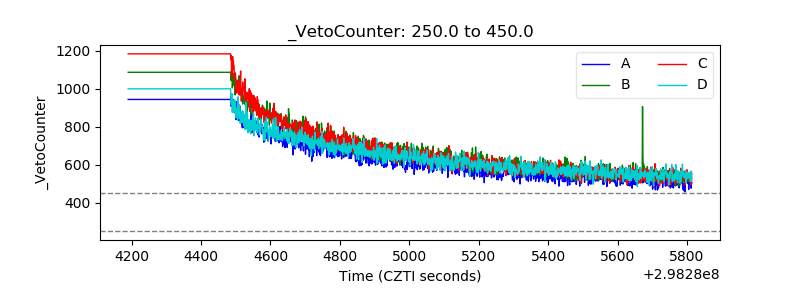 |