| Param | Original file | Final file |
|---|---|---|
| Filename | modeM0/AS1A05_180T01_9000002992_20075cztM0_level2.evt | modeM0/AS1A05_180T01_9000002992_20075cztM0_level2_quad_clean.evt |
| Size (bytes) | 563,538,240 | 78,583,680 |
| Size | 537.4 MB | 74.9 MB |
| Events in quadrant A | 4,145,576 | 492,917 |
| Events in quadrant B | 3,692,648 | 502,143 |
| Events in quadrant C | 3,509,127 | 478,064 |
| Events in quadrant D | 5,292,652 | 466,074 |
| Mode M9 | |||
|---|---|---|---|
| Quadrant | BADHDUFLAG | Total packets | Discarded packets |
| A | 0 | 13 | 0 |
| B | 0 | 14 | 0 |
| C | 0 | 14 | 0 |
| D | 0 | 14 | 0 |
| Mode M0 | |||
|---|---|---|---|
| Quadrant | BADHDUFLAG | Total packets | Discarded packets |
| A | 0 | 16367 | 2 |
| B | 0 | 14903 | 2 |
| C | 0 | 14127 | 2 |
| D | 0 | 20138 | 3 |
| Mode SS | |||
|---|---|---|---|
| Quadrant | BADHDUFLAG | Total packets | Discarded packets |
| A | 0 | 130 | 0 |
| B | 0 | 130 | 0 |
| C | 0 | 130 | 0 |
| D | 0 | 130 | 0 |
| Quadrant | Total seconds | Saturated seconds | Saturation percentage |
|---|---|---|---|
| A | 6302 | 234 | 3.713107% |
| B | 6302 | 105 | 1.666138% |
| C | 6302 | 96 | 1.523326% |
| D | 6301 | 143 | 2.269481% |
Noise dominated data is calculated using 1-second bins in cleaned event files. If a bin has >2000 counts, and if more than 50% of those come from <1% of pixels, then it is considered to be noise-dominated and hence unusable.
| Quadrant | # 1 sec bins | Bins with >0 counts | Bins with >2000 counts | High rate bins dominated by noise | Noise dominated (total time) | Noise dominated (detector-on time) | Marked lightcurve |
|---|---|---|---|---|---|---|---|
| A | 7617 | 6303 | 117 | 117 | 1.54% | 1.86% | 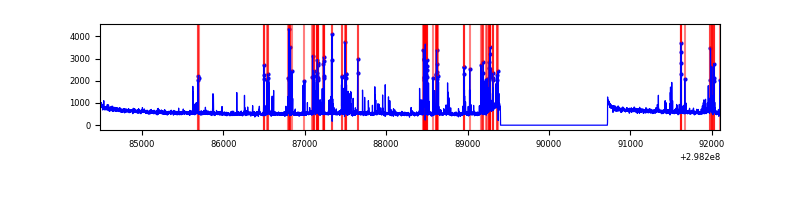 |
| B | 7617 | 6303 | 9 | 9 | 0.12% | 0.14% | 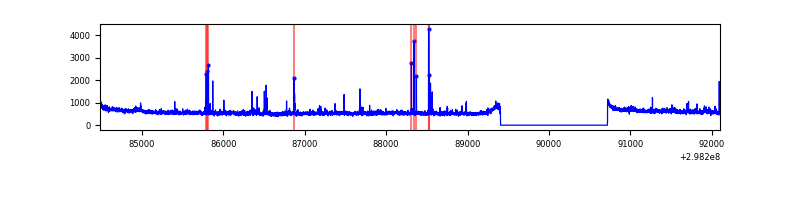 |
| C | 7617 | 6303 | 0 | 0 | 0.00% | 0.00% | 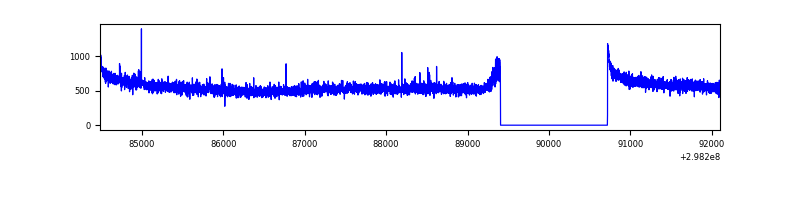 |
| D | 7616 | 6302 | 53 | 53 | 0.70% | 0.84% | 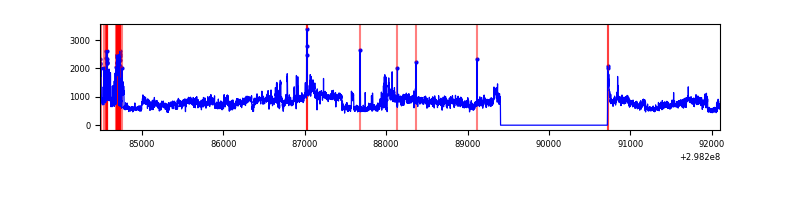 |
Top three noisy pixels from each quadrant. If the there are fewer than three noisy pixels in the level2.evt file, extra rows are filled as -1
| Pixel properties | Quadrant properties | ||||||
|---|---|---|---|---|---|---|---|
| Quadrant | DetID | PixID | Counts | Sigma | Mean | Median | Sigma |
| A | 14 | 238 | 491502 | 2728.64 | 907 | 896 | 179.8 |
| A | 14 | 254 | 90954 | 500.88 | 907 | 896 | 179.8 |
| A | 4 | 2 | 57462 | 314.61 | 907 | 896 | 179.8 |
| B | 4 | 80 | 43431 | 255.88 | 898 | 882 | 166.3 |
| B | 0 | 189 | 28675 | 167.14 | 898 | 882 | 166.3 |
| B | 0 | 198 | 23864 | 138.21 | 898 | 882 | 166.3 |
| C | 14 | 238 | 139718 | 709.62 | 860 | 873 | 195.7 |
| C | 3 | 233 | 8353 | 38.23 | 860 | 873 | 195.7 |
| C | 13 | 61 | 6056 | 26.49 | 860 | 873 | 195.7 |
| D | 1 | 52 | 1584890 | 7574.67 | 881 | 859 | 209.1 |
| D | 7 | 223 | 185440 | 882.65 | 881 | 859 | 209.1 |
| D | 12 | 218 | 170151 | 809.54 | 881 | 859 | 209.1 |
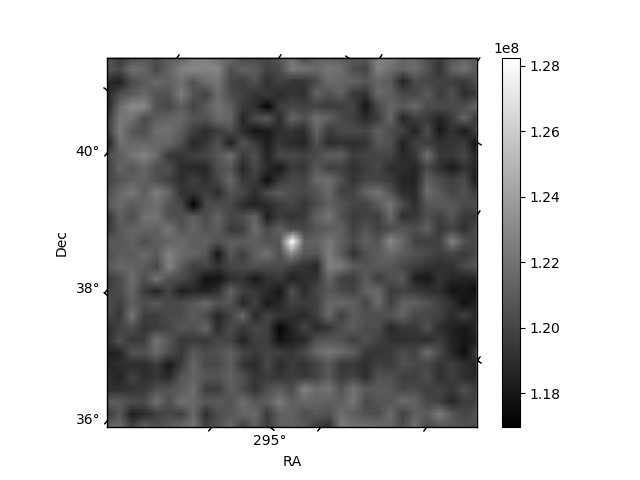
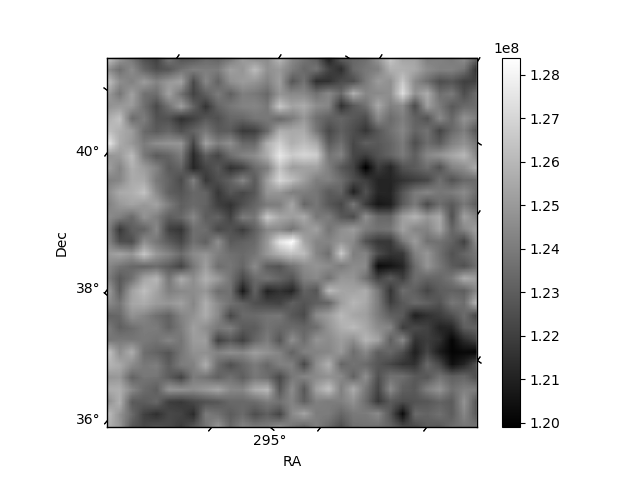
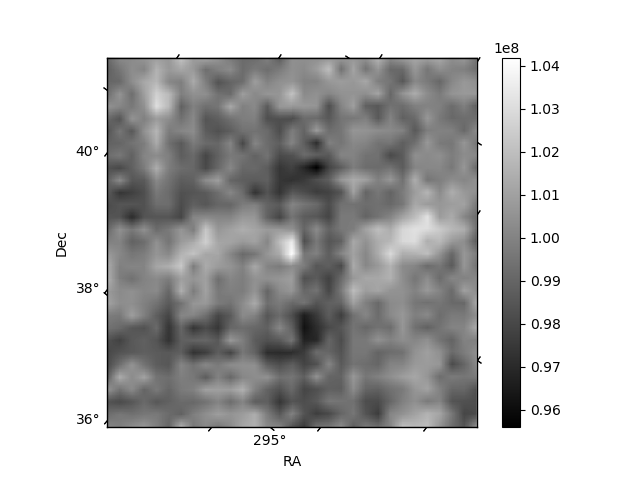
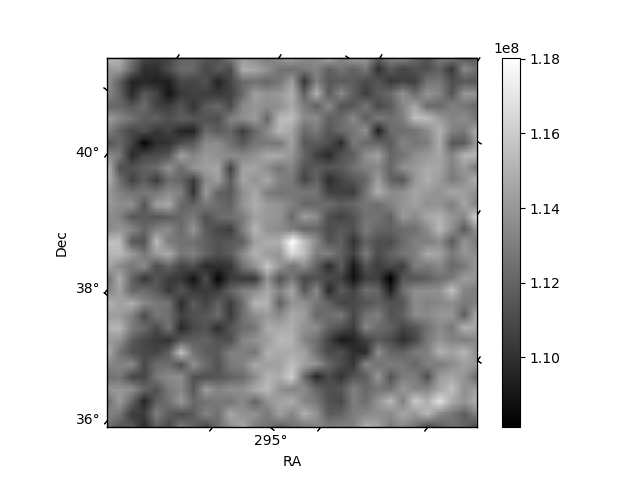
Histogram calculated using DETX and DETY for each event in the final _common_clean file
| Quadrant A | 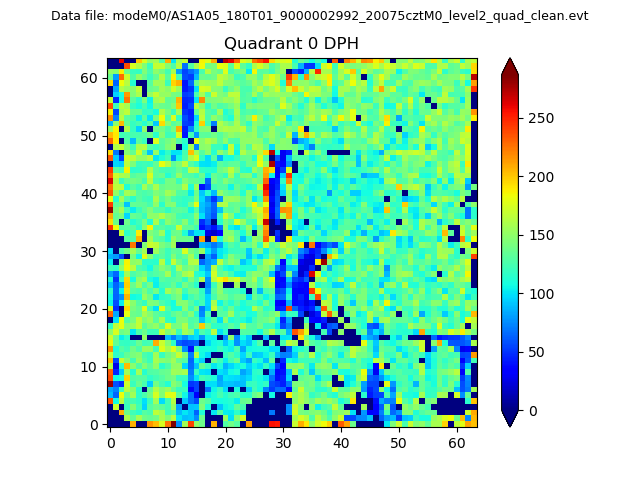 |
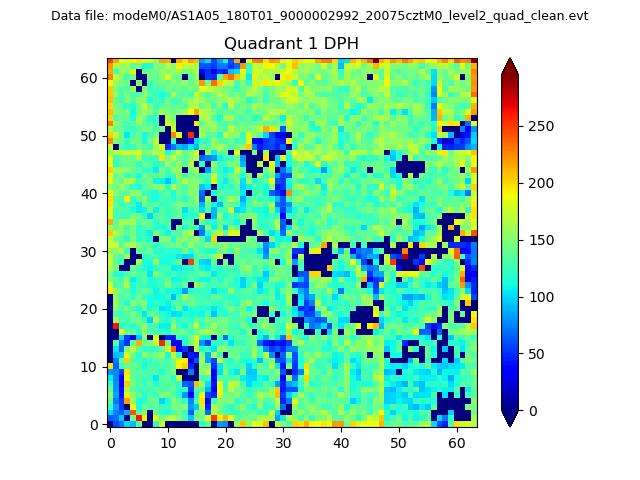 |
Quadrant B |
|---|---|---|---|
| Quadrant D |  |
 |
Quadrant C |
| Plot type | Count rate plots | Images |
|---|---|---|
| Comparison with Poisson distribution Blue bars denote a histogram of data divided into 1 sec bins. Red curve is a Poisson curve with rate = median count rate of data. |
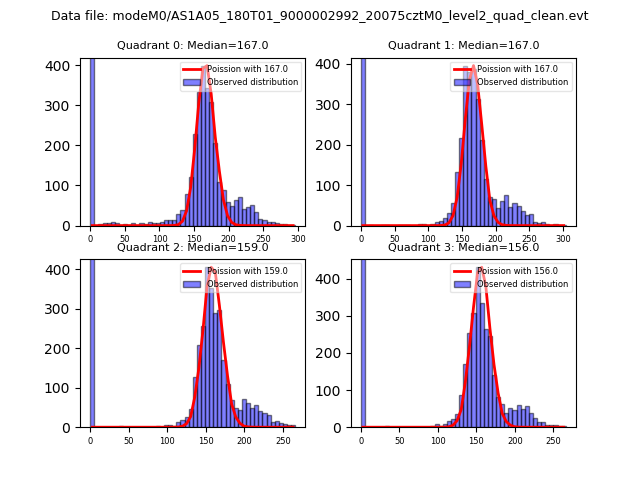 |
 |
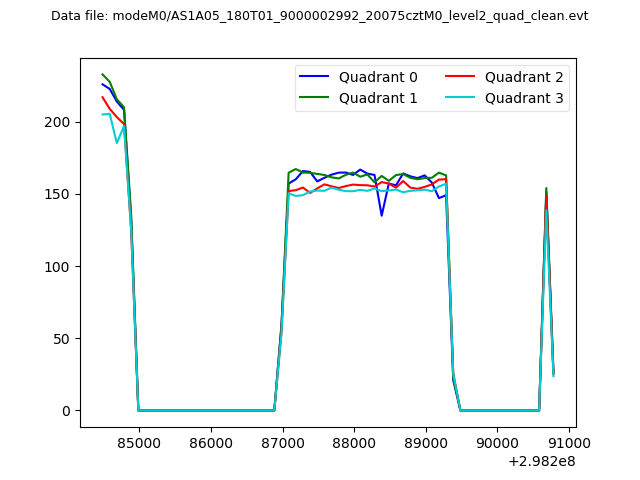
| Quadrant-wise count rates Data is divided into 100 sec bins |
 |
|
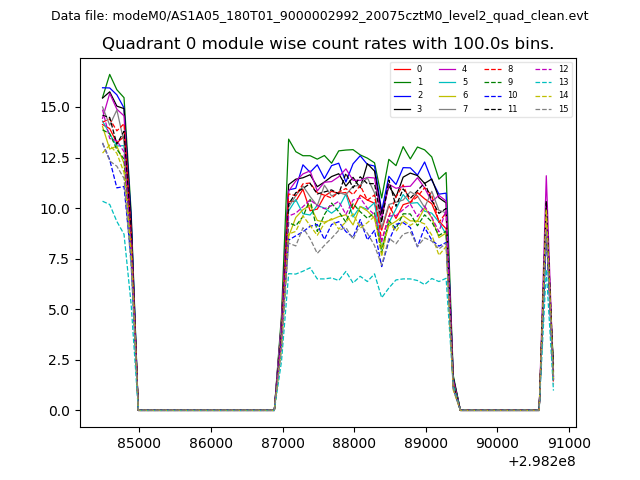
| Module-wise count rates for Quadrant A Data is divided into 100 sec bins |
 |
 |
| Module-wise count rates for Quadrant B Data is divided into 100 sec bins |
 |
 |
| Module-wise count rates for Quadrant C Data is divided into 100 sec bins |
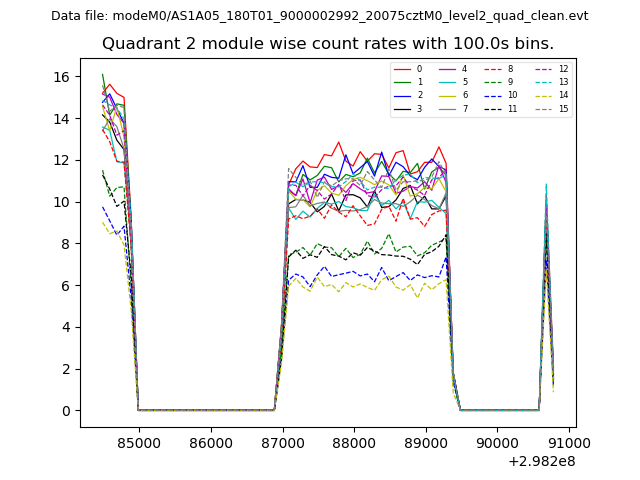 |
 |
| Module-wise count rates for Quadrant D Data is divided into 100 sec bins |
 |
 |
| Parameter | Plot |
|---|---|
| CZT HV Monitor | 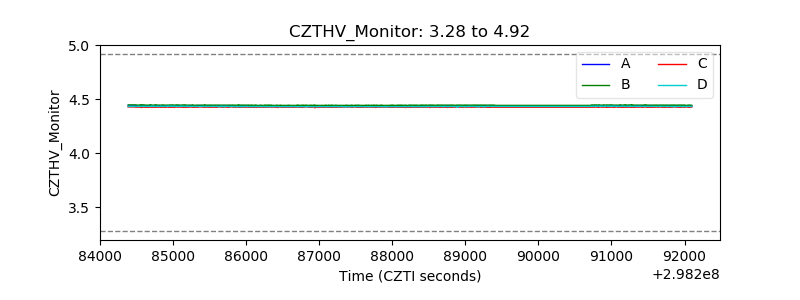 |
| D_VDD | 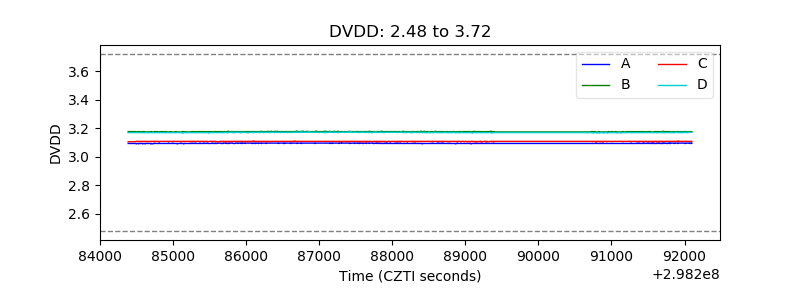 |
| Temperature 1 | 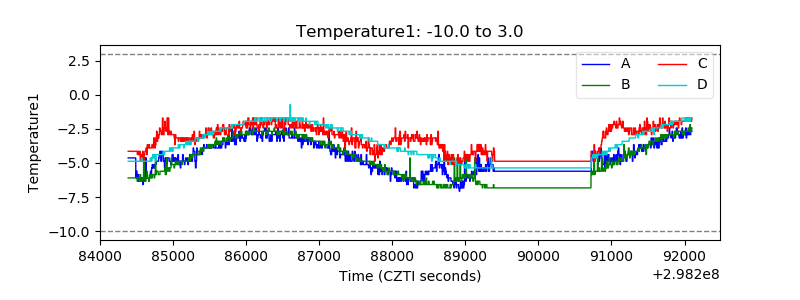 |
| Veto HV Monitor | 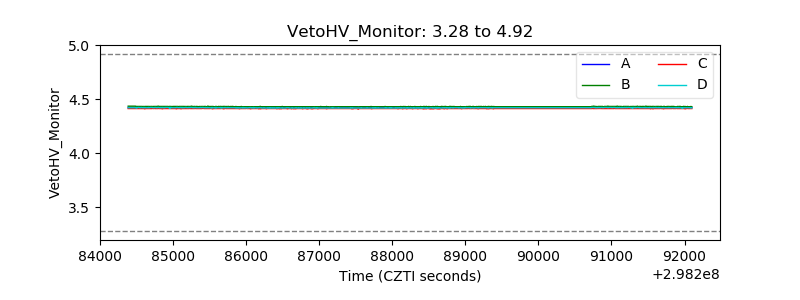 |
| Veto LLD | 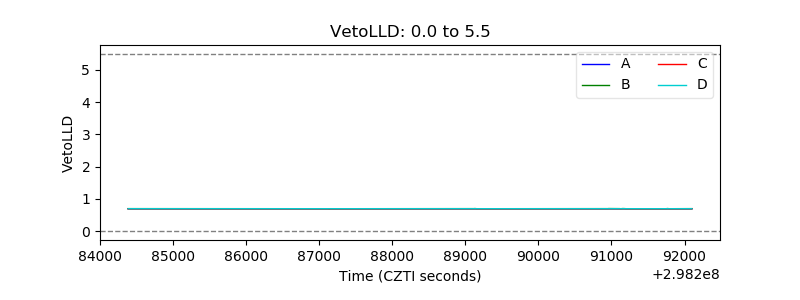 |
| Alpha Counter | 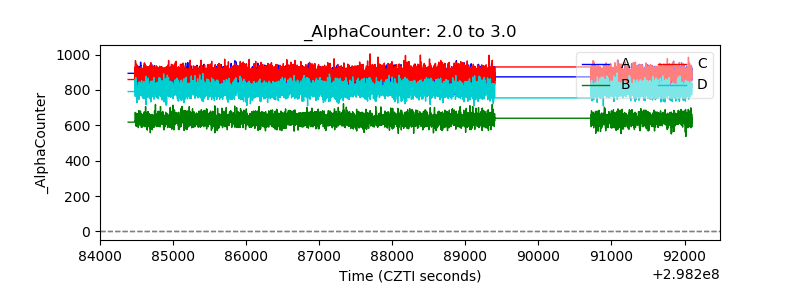 |
| _CPM_Rate |  |
| CZT Counter | 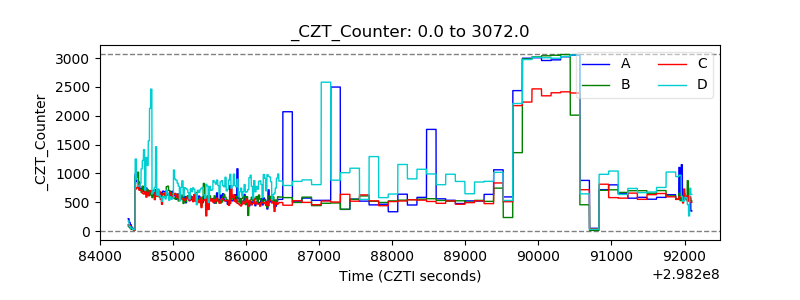 |
| +2.5 Volts monitor |  |
| +5 Volts monitor |  |
| _ROLL_ROT |  |
| _Roll_DEC | 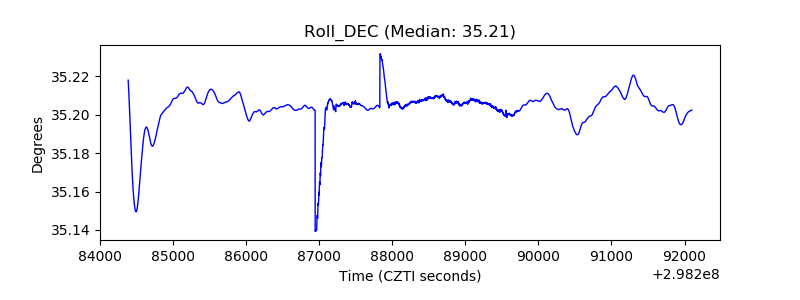 |
| _Roll_RA | 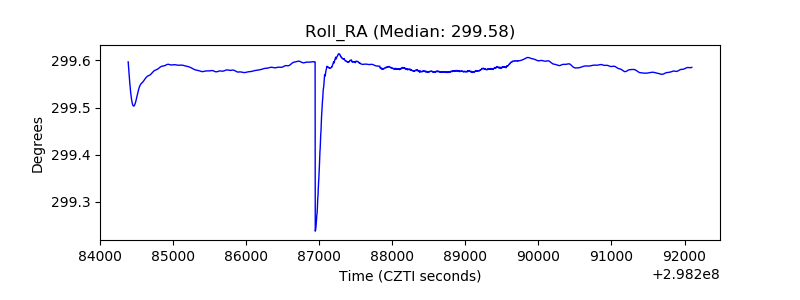 |
| Veto Counter |  |