| Param | Original file | Final file |
|---|---|---|
| Filename | modeM0/AS1A05_180T01_9000002992_20076cztM0_level2.evt | modeM0/AS1A05_180T01_9000002992_20076cztM0_level2_quad_clean.evt |
| Size (bytes) | 548,049,600 | 75,303,360 |
| Size | 522.7 MB | 71.8 MB |
| Events in quadrant A | 4,022,245 | 474,268 |
| Events in quadrant B | 3,753,887 | 473,128 |
| Events in quadrant C | 3,550,786 | 452,152 |
| Events in quadrant D | 4,847,673 | 444,623 |
| Mode M9 | |||
|---|---|---|---|
| Quadrant | BADHDUFLAG | Total packets | Discarded packets |
| A | 0 | 17 | 0 |
| B | 0 | 18 | 0 |
| C | 0 | 18 | 0 |
| D | 0 | 18 | 0 |
| Mode M0 | |||
|---|---|---|---|
| Quadrant | BADHDUFLAG | Total packets | Discarded packets |
| A | 0 | 16030 | 2 |
| B | 0 | 15113 | 2 |
| C | 0 | 14185 | 2 |
| D | 0 | 18982 | 2 |
| Mode SS | |||
|---|---|---|---|
| Quadrant | BADHDUFLAG | Total packets | Discarded packets |
| A | 0 | 128 | 0 |
| B | 0 | 128 | 0 |
| C | 0 | 128 | 0 |
| D | 0 | 128 | 0 |
| Quadrant | Total seconds | Saturated seconds | Saturation percentage |
|---|---|---|---|
| A | 6243 | 217 | 3.475893% |
| B | 6243 | 169 | 2.707032% |
| C | 6242 | 133 | 2.130727% |
| D | 6242 | 158 | 2.531240% |
Noise dominated data is calculated using 1-second bins in cleaned event files. If a bin has >2000 counts, and if more than 50% of those come from <1% of pixels, then it is considered to be noise-dominated and hence unusable.
| Quadrant | # 1 sec bins | Bins with >0 counts | Bins with >2000 counts | High rate bins dominated by noise | Noise dominated (total time) | Noise dominated (detector-on time) | Marked lightcurve |
|---|---|---|---|---|---|---|---|
| A | 7573 | 6244 | 62 | 62 | 0.82% | 0.99% | 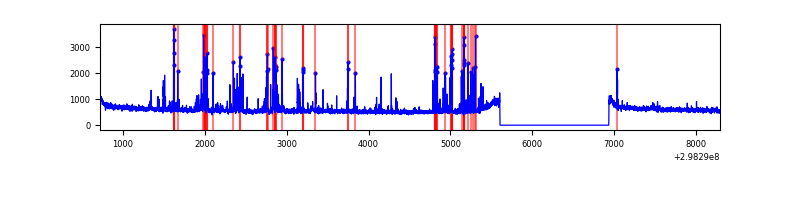 |
| B | 7573 | 6244 | 19 | 19 | 0.25% | 0.30% | 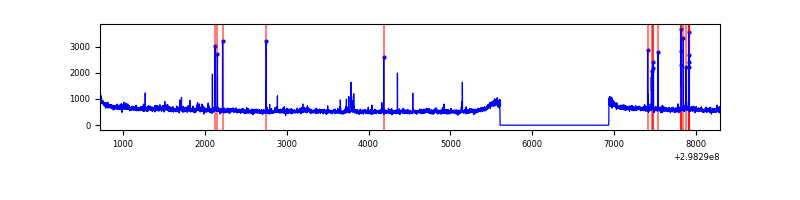 |
| C | 7572 | 6243 | 0 | 0 | 0.00% | 0.00% |  |
| D | 7572 | 6243 | 53 | 53 | 0.70% | 0.85% | 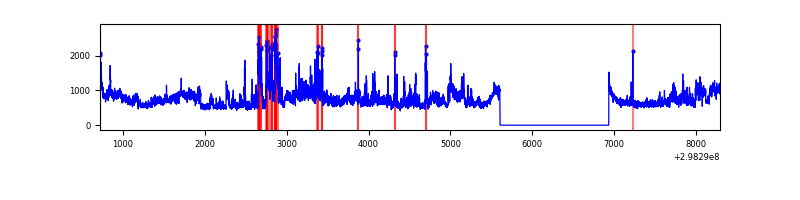 |
Top three noisy pixels from each quadrant. If the there are fewer than three noisy pixels in the level2.evt file, extra rows are filled as -1
| Pixel properties | Quadrant properties | ||||||
|---|---|---|---|---|---|---|---|
| Quadrant | DetID | PixID | Counts | Sigma | Mean | Median | Sigma |
| A | 14 | 238 | 362578 | 1985.05 | 926 | 916 | 182.2 |
| A | 14 | 254 | 56699 | 306.18 | 926 | 916 | 182.2 |
| A | 4 | 2 | 15245 | 78.65 | 926 | 916 | 182.2 |
| B | 4 | 80 | 94970 | 555.58 | 909 | 893 | 169.3 |
| B | 0 | 198 | 34199 | 196.69 | 909 | 893 | 169.3 |
| B | 12 | 111 | 19044 | 107.19 | 909 | 893 | 169.3 |
| C | 14 | 238 | 140732 | 706.26 | 873 | 884 | 198.0 |
| C | 13 | 61 | 6115 | 26.42 | 873 | 884 | 198.0 |
| C | 3 | 233 | 4864 | 20.1 | 873 | 884 | 198.0 |
| D | 1 | 52 | 884988 | 4136.11 | 895 | 871 | 213.8 |
| D | 12 | 218 | 493913 | 2306.57 | 895 | 871 | 213.8 |
| D | 7 | 223 | 26977 | 122.13 | 895 | 871 | 213.8 |
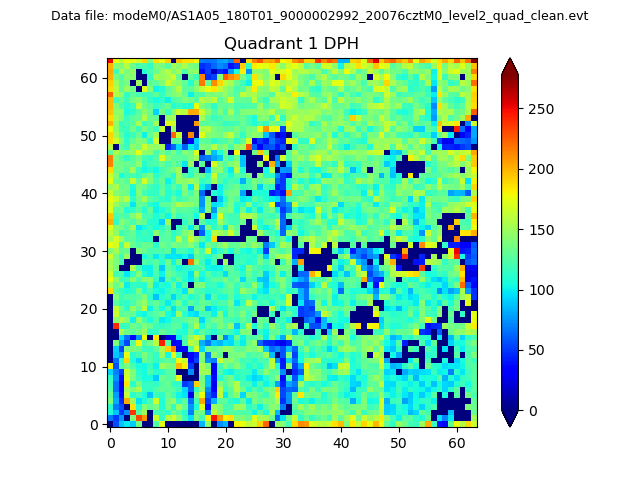
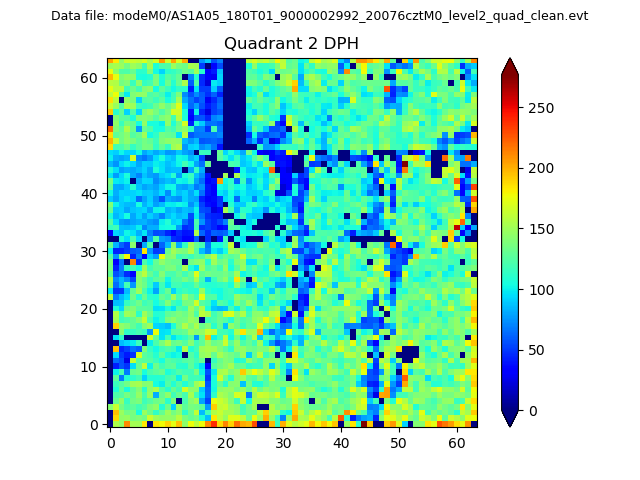
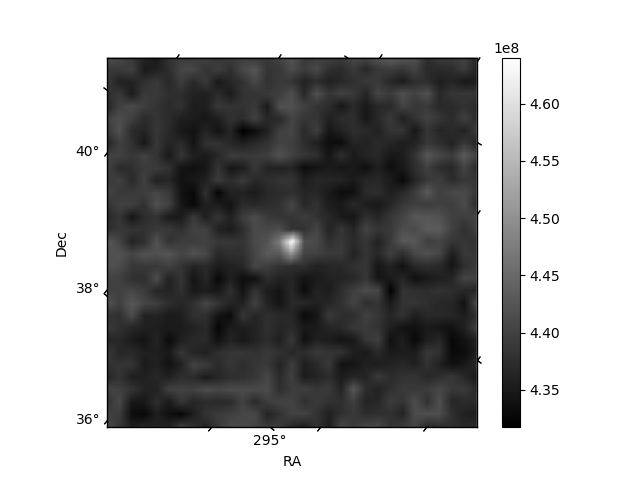
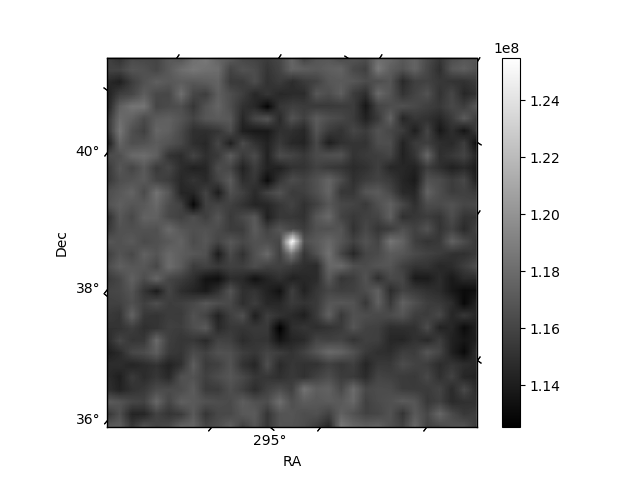
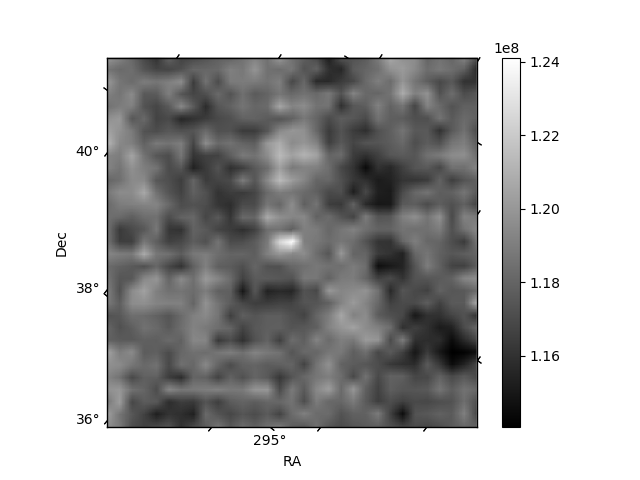
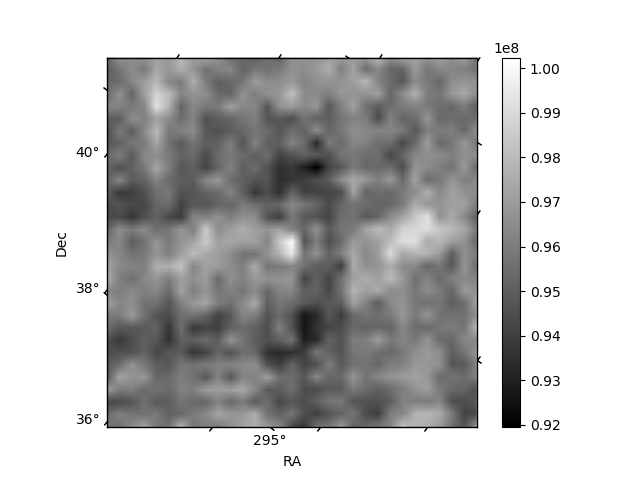
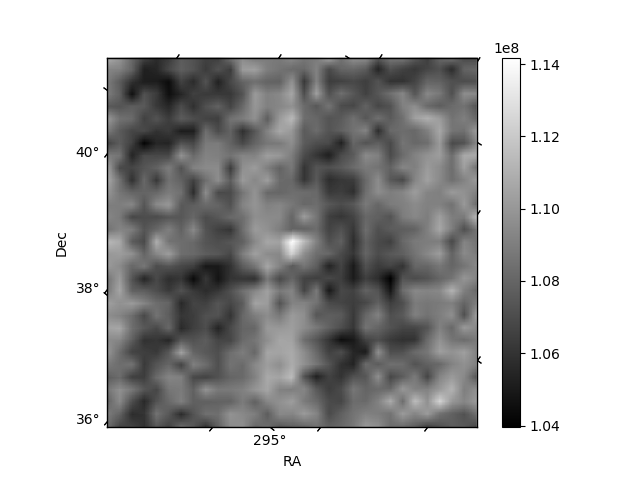
Histogram calculated using DETX and DETY for each event in the final _common_clean file
| Quadrant A | 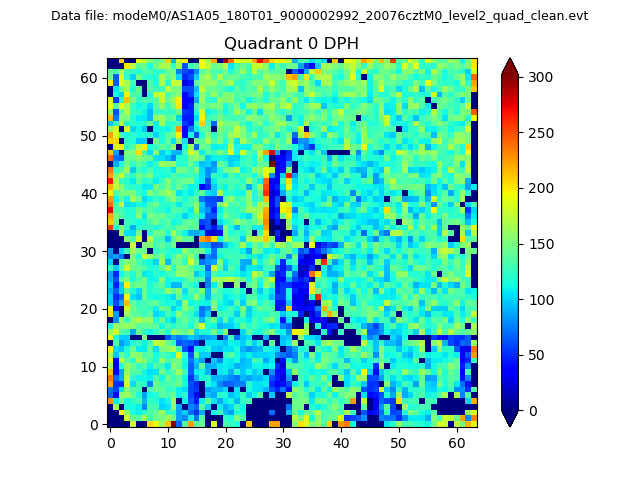 |
 |
Quadrant B |
|---|---|---|---|
| Quadrant D | 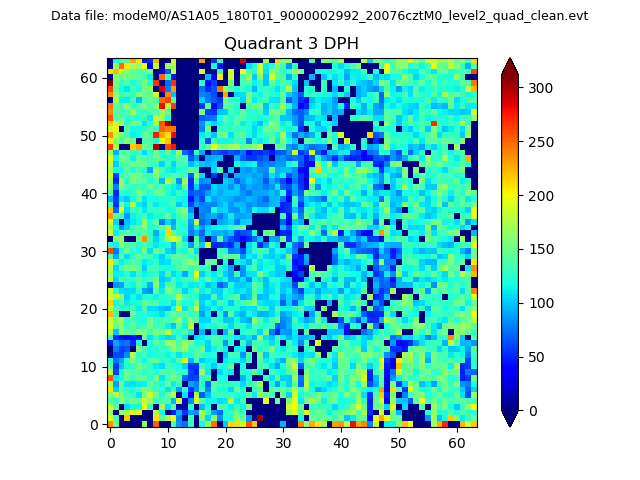 |
 |
Quadrant C |
| Plot type | Count rate plots | Images |
|---|---|---|
| Comparison with Poisson distribution Blue bars denote a histogram of data divided into 1 sec bins. Red curve is a Poisson curve with rate = median count rate of data. |
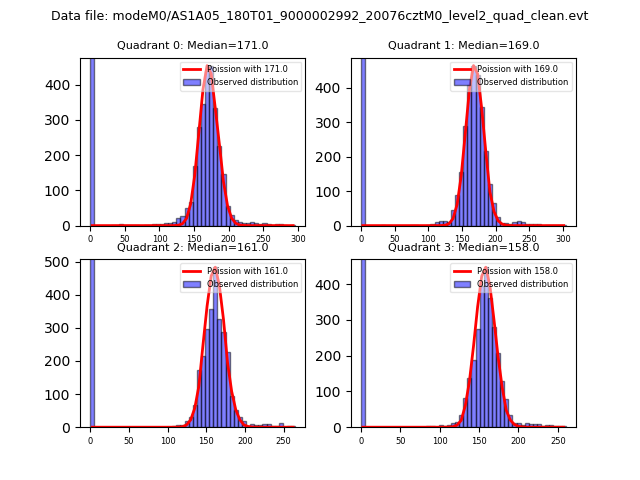 |
 |
| Quadrant-wise count rates Data is divided into 100 sec bins |
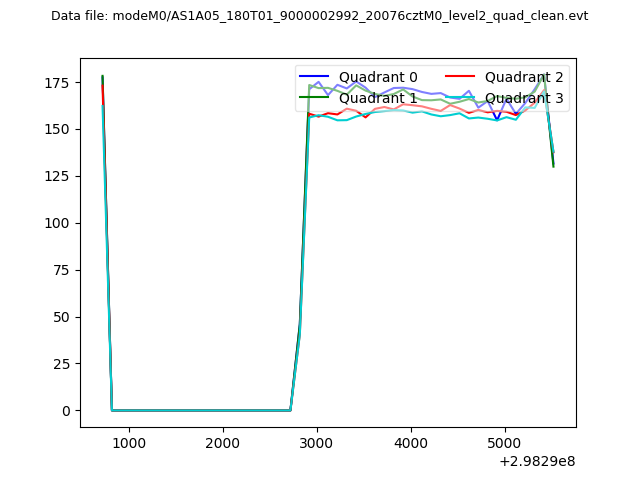 |
|
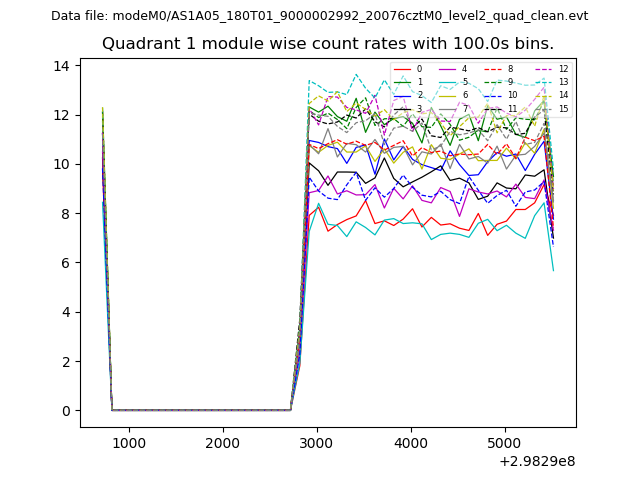
| Module-wise count rates for Quadrant A Data is divided into 100 sec bins |
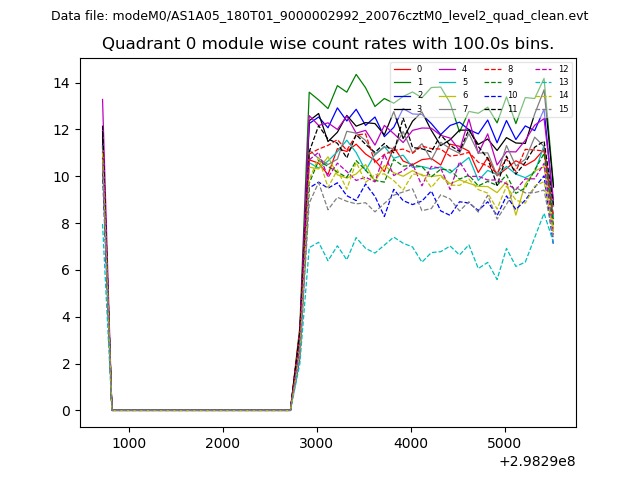 |
 |
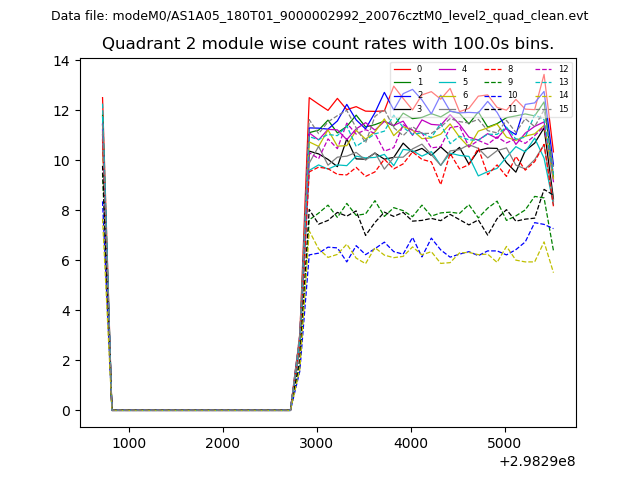
| Module-wise count rates for Quadrant B Data is divided into 100 sec bins |
 |
 |
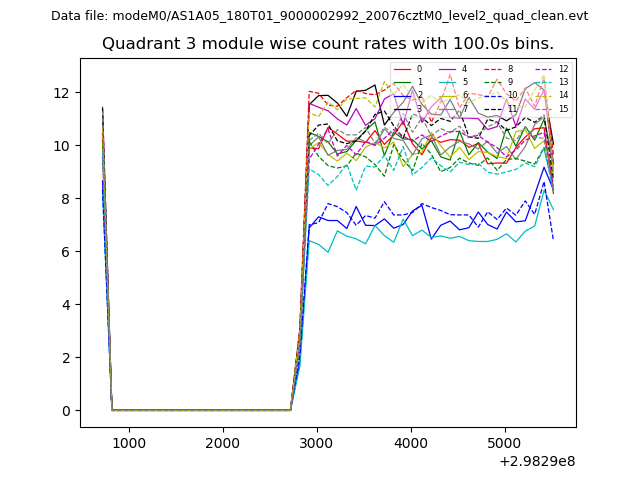
| Module-wise count rates for Quadrant C Data is divided into 100 sec bins |
 |
 |
| Module-wise count rates for Quadrant D Data is divided into 100 sec bins |
 |
 |
| Parameter | Plot |
|---|---|
| CZT HV Monitor | 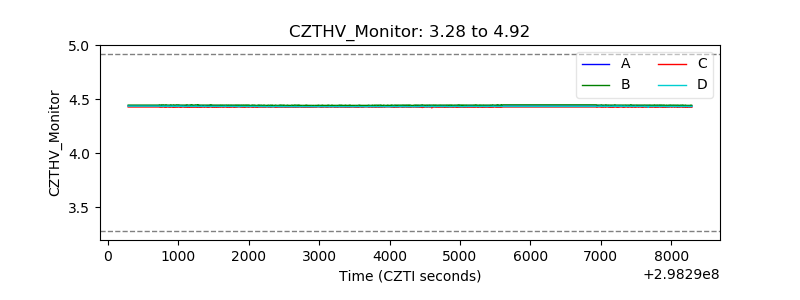 |
| D_VDD | 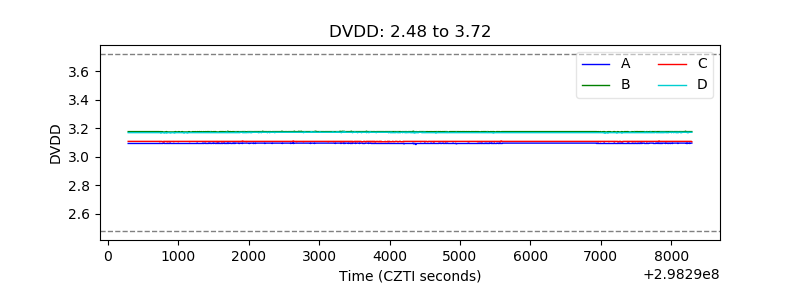 |
| Temperature 1 | 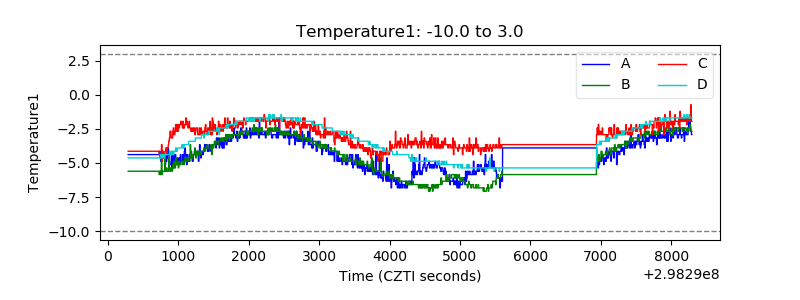 |
| Veto HV Monitor |  |
| Veto LLD | 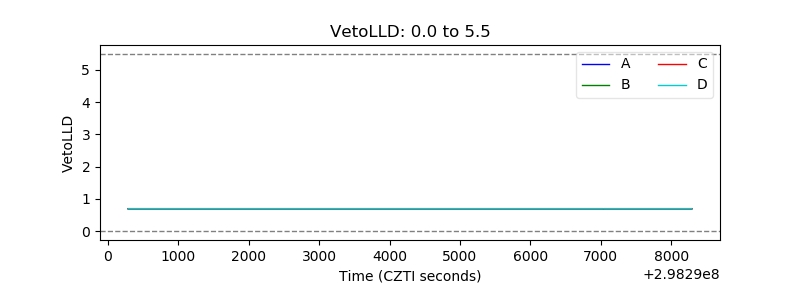 |
| Alpha Counter | 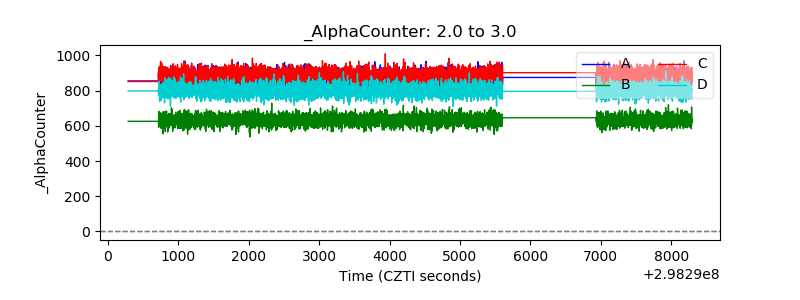 |
| _CPM_Rate | 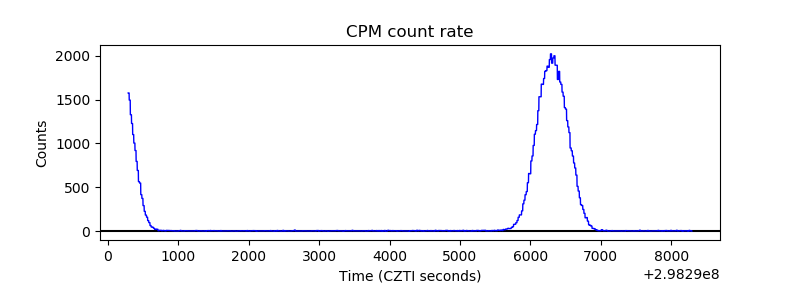 |
| CZT Counter | 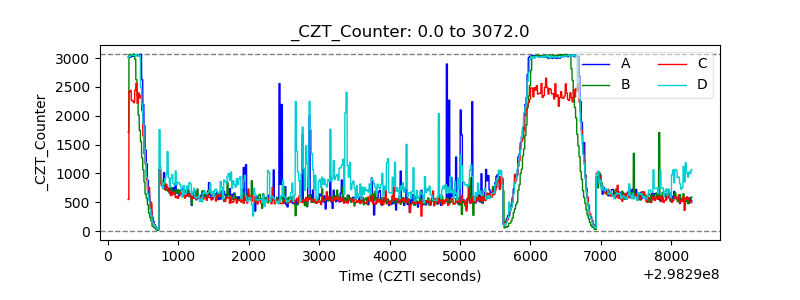 |
| +2.5 Volts monitor |  |
| +5 Volts monitor |  |
| _ROLL_ROT | 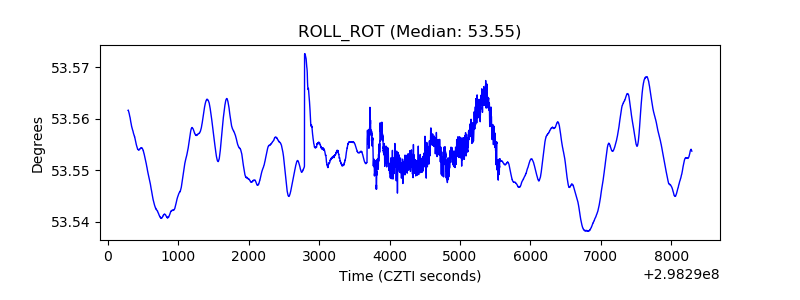 |
| _Roll_DEC | 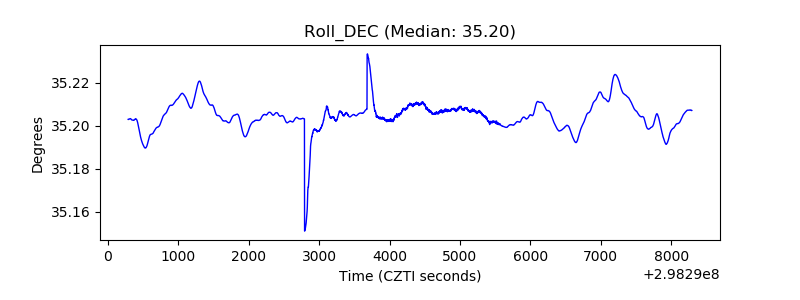 |
| _Roll_RA | 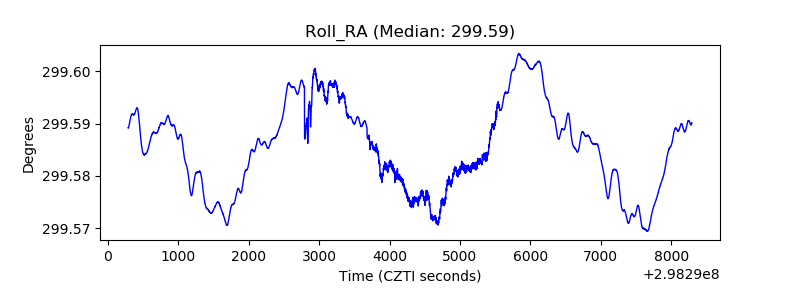 |
| Veto Counter | 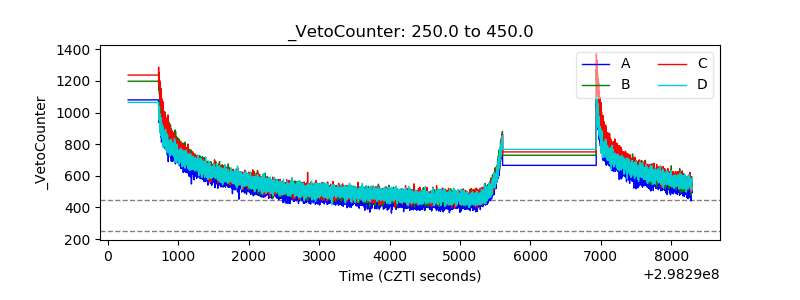 |