| Param | Original file | Final file |
|---|---|---|
| Filename | modeM0/AS1A05_180T01_9000002992_20078cztM0_level2.evt | modeM0/AS1A05_180T01_9000002992_20078cztM0_level2_quad_clean.evt |
| Size (bytes) | 517,199,040 | 97,332,480 |
| Size | 493.2 MB | 92.8 MB |
| Events in quadrant A | 3,725,123 | 637,498 |
| Events in quadrant B | 3,570,670 | 640,568 |
| Events in quadrant C | 3,401,964 | 614,150 |
| Events in quadrant D | 4,533,117 | 610,315 |
| Mode M9 | |||
|---|---|---|---|
| Quadrant | BADHDUFLAG | Total packets | Discarded packets |
| A | 0 | 22 | 0 |
| B | 0 | 22 | 0 |
| C | 0 | 23 | 0 |
| D | 0 | 23 | 0 |
| Mode M0 | |||
|---|---|---|---|
| Quadrant | BADHDUFLAG | Total packets | Discarded packets |
| A | 0 | 14853 | 2 |
| B | 0 | 14449 | 2 |
| C | 0 | 13694 | 2 |
| D | 0 | 17607 | 2 |
| Mode SS | |||
|---|---|---|---|
| Quadrant | BADHDUFLAG | Total packets | Discarded packets |
| A | 0 | 130 | 0 |
| B | 0 | 130 | 0 |
| C | 0 | 130 | 0 |
| D | 0 | 130 | 0 |
| Quadrant | Total seconds | Saturated seconds | Saturation percentage |
|---|---|---|---|
| A | 6378 | 193 | 3.026027% |
| B | 6378 | 132 | 2.069614% |
| C | 6377 | 118 | 1.850400% |
| D | 6377 | 220 | 3.449898% |
Noise dominated data is calculated using 1-second bins in cleaned event files. If a bin has >2000 counts, and if more than 50% of those come from <1% of pixels, then it is considered to be noise-dominated and hence unusable.
| Quadrant | # 1 sec bins | Bins with >0 counts | Bins with >2000 counts | High rate bins dominated by noise | Noise dominated (total time) | Noise dominated (detector-on time) | Marked lightcurve |
|---|---|---|---|---|---|---|---|
| A | 7493 | 6379 | 59 | 59 | 0.79% | 0.92% | 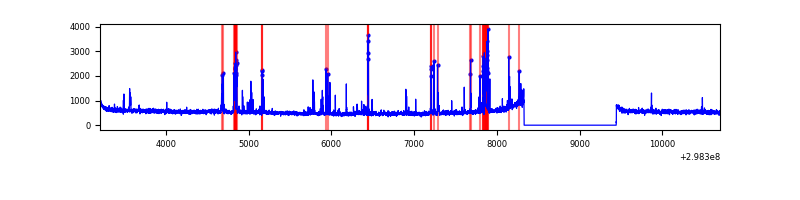 |
| B | 7493 | 6379 | 6 | 6 | 0.08% | 0.09% | 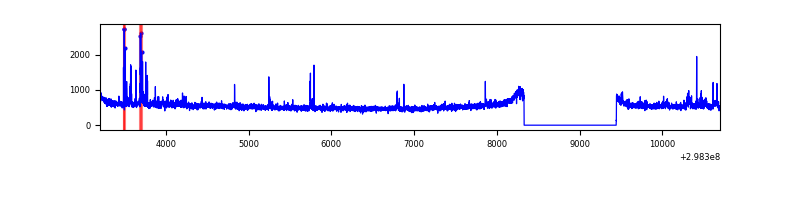 |
| C | 7492 | 6378 | 0 | 0 | 0.00% | 0.00% | 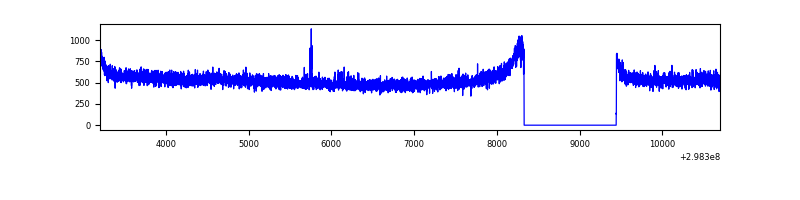 |
| D | 7492 | 6378 | 104 | 104 | 1.39% | 1.63% | 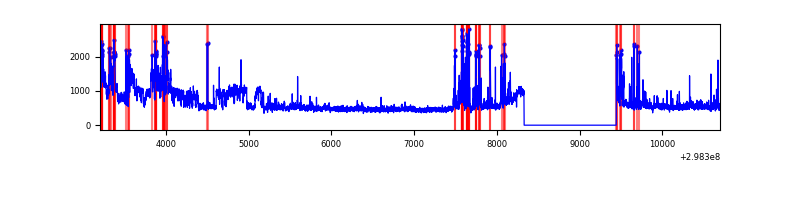 |
Top three noisy pixels from each quadrant. If the there are fewer than three noisy pixels in the level2.evt file, extra rows are filled as -1
| Pixel properties | Quadrant properties | ||||||
|---|---|---|---|---|---|---|---|
| Quadrant | DetID | PixID | Counts | Sigma | Mean | Median | Sigma |
| A | 14 | 238 | 260185 | 1493.35 | 870 | 856 | 173.7 |
| A | 14 | 254 | 71384 | 406.14 | 870 | 856 | 173.7 |
| A | 4 | 2 | 25724 | 143.2 | 870 | 856 | 173.7 |
| B | 10 | 245 | 96824 | 587.16 | 865 | 847 | 163.5 |
| B | 0 | 198 | 21550 | 126.66 | 865 | 847 | 163.5 |
| B | 12 | 111 | 19053 | 111.38 | 865 | 847 | 163.5 |
| C | 14 | 238 | 131645 | 674.37 | 836 | 847 | 194.0 |
| C | 13 | 61 | 5947 | 26.29 | 836 | 847 | 194.0 |
| C | 7 | 220 | 5399 | 23.47 | 836 | 847 | 194.0 |
| D | 1 | 52 | 581585 | 2830.15 | 851 | 830 | 205.2 |
| D | 12 | 218 | 400953 | 1949.89 | 851 | 830 | 205.2 |
| D | 7 | 238 | 277062 | 1346.14 | 851 | 830 | 205.2 |
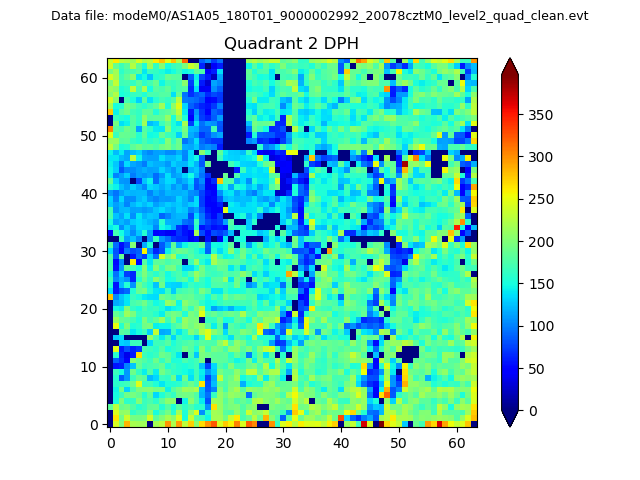
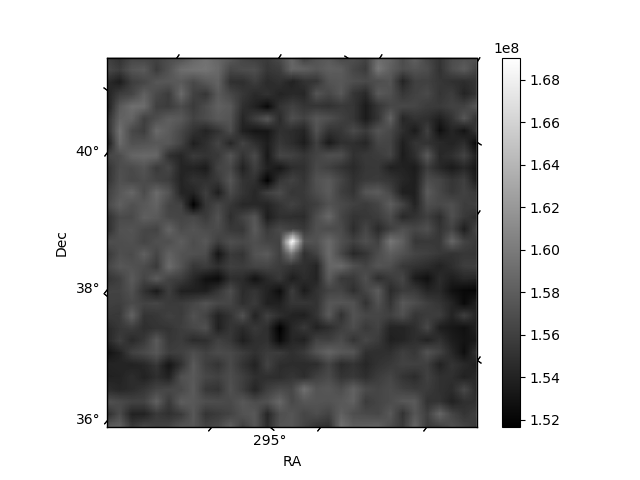
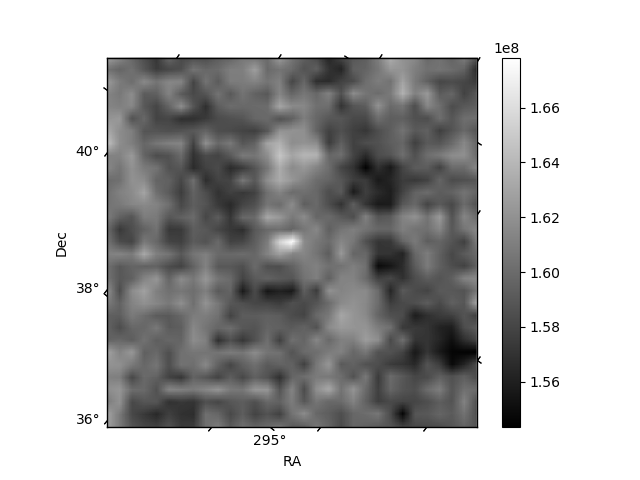
Histogram calculated using DETX and DETY for each event in the final _common_clean file
| Quadrant A | 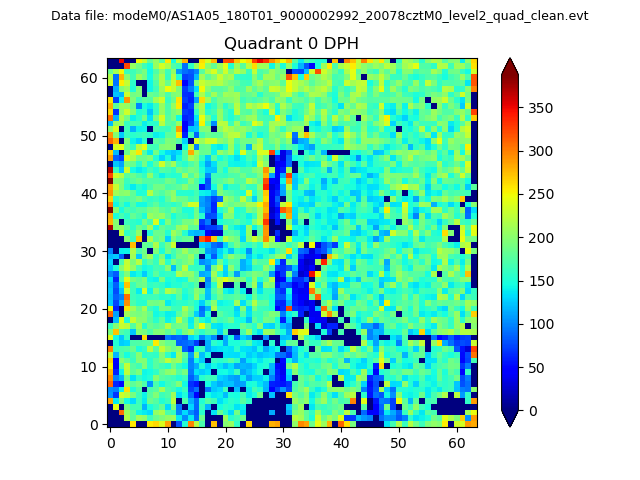 |
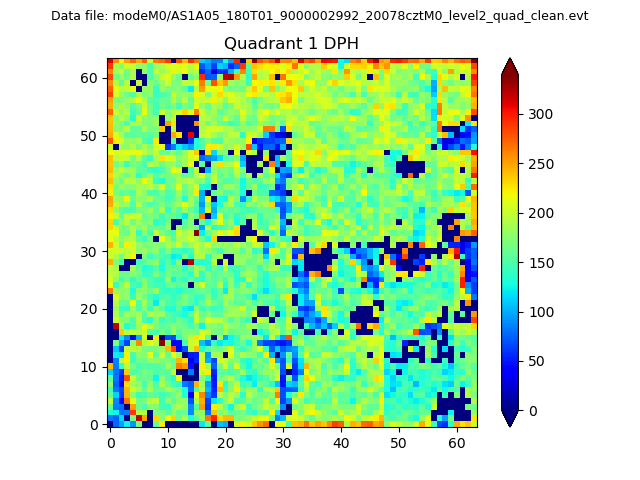 |
Quadrant B |
|---|---|---|---|
| Quadrant D | 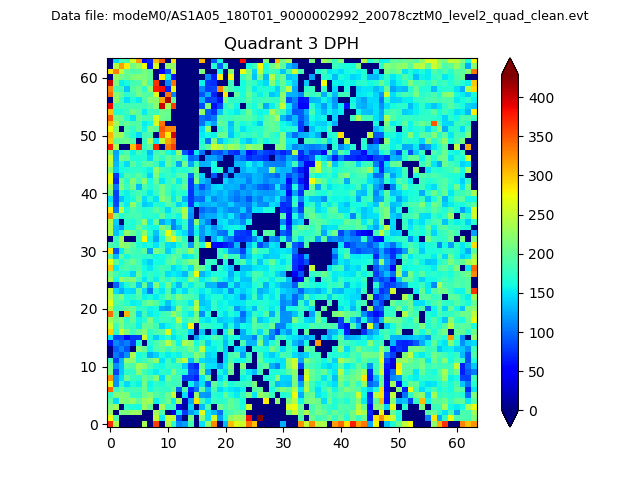 |
 |
Quadrant C |
| Plot type | Count rate plots | Images |
|---|---|---|
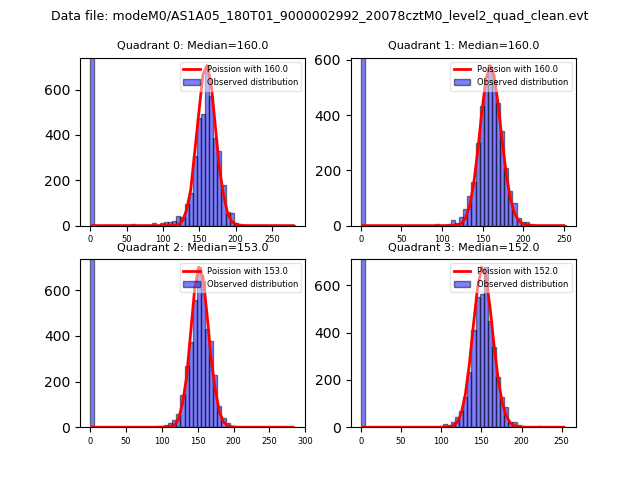
| Comparison with Poisson distribution Blue bars denote a histogram of data divided into 1 sec bins. Red curve is a Poisson curve with rate = median count rate of data. |
 |
 |
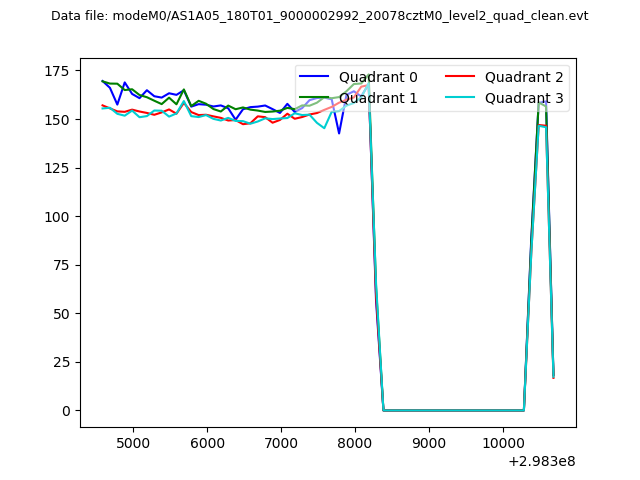
| Quadrant-wise count rates Data is divided into 100 sec bins |
 |
|
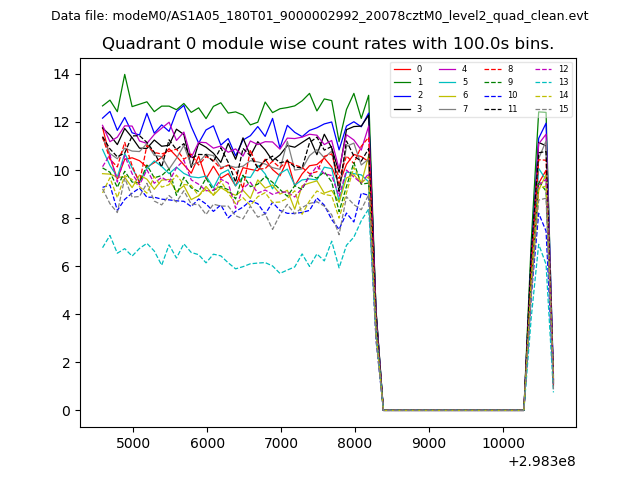
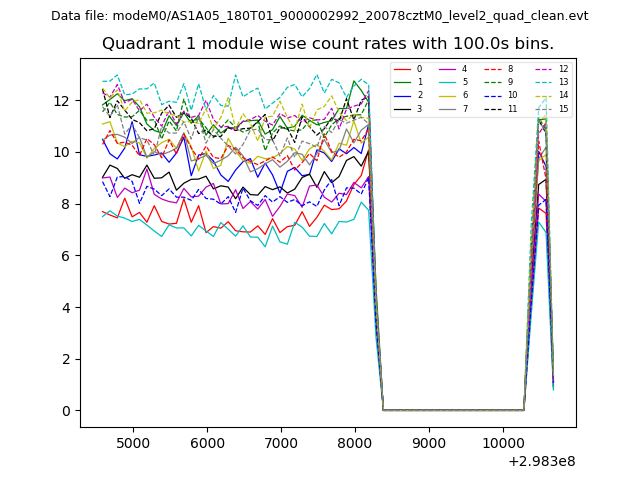
| Module-wise count rates for Quadrant A Data is divided into 100 sec bins |
 |
 |
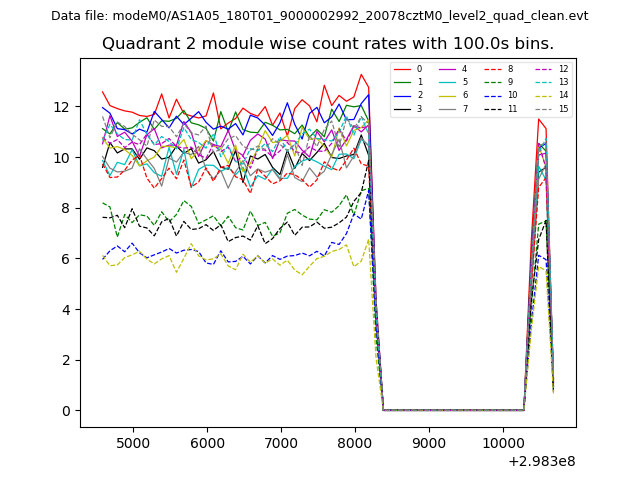
| Module-wise count rates for Quadrant B Data is divided into 100 sec bins |
 |
 |
| Module-wise count rates for Quadrant C Data is divided into 100 sec bins |
 |
 |
| Module-wise count rates for Quadrant D Data is divided into 100 sec bins |
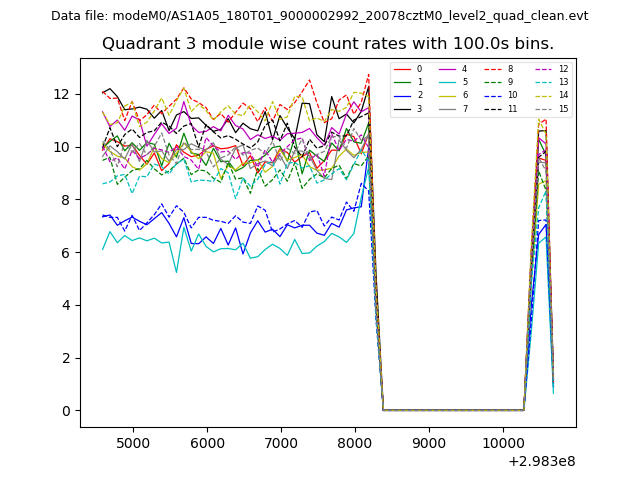 |
 |
| Parameter | Plot |
|---|---|
| CZT HV Monitor | 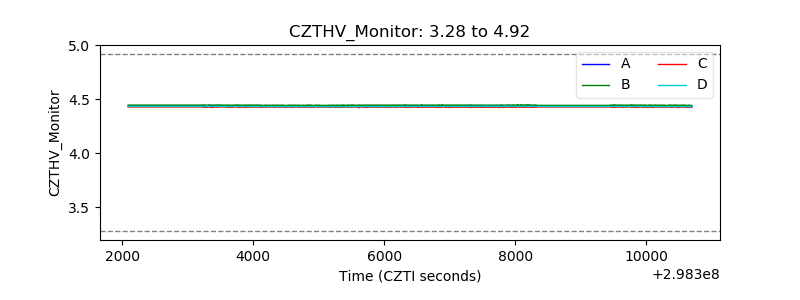 |
| D_VDD | 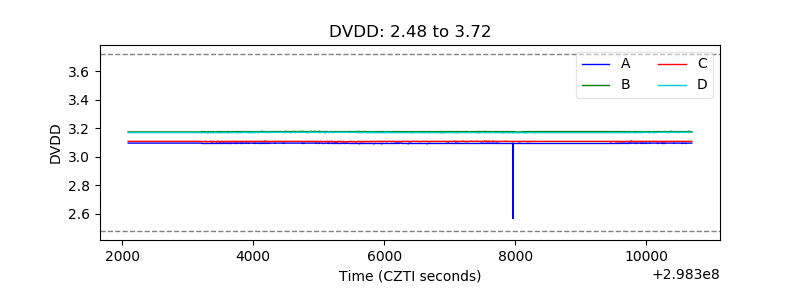 |
| Temperature 1 | 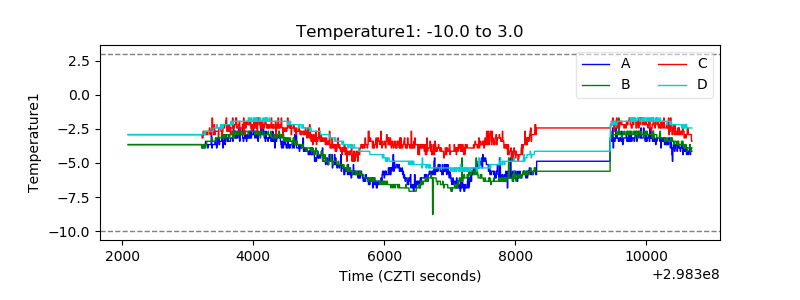 |
| Veto HV Monitor | 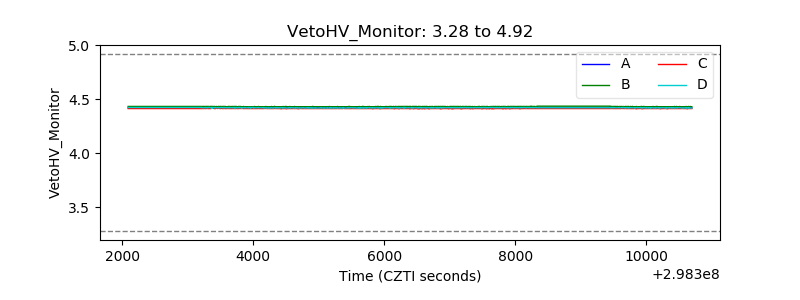 |
| Veto LLD | 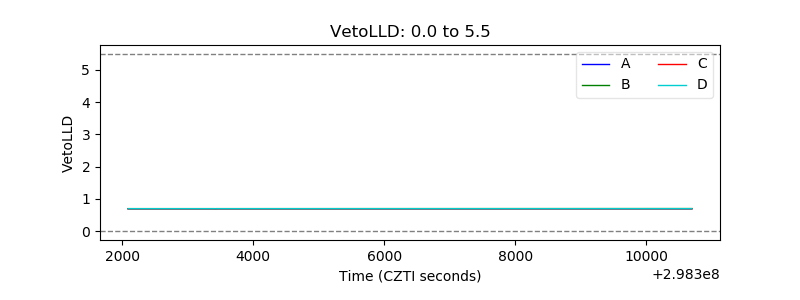 |
| Alpha Counter | 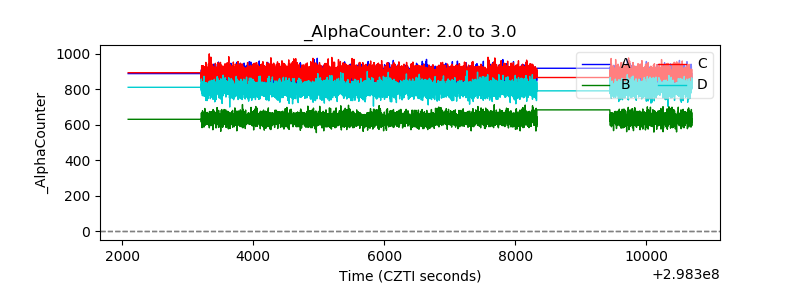 |
| _CPM_Rate | 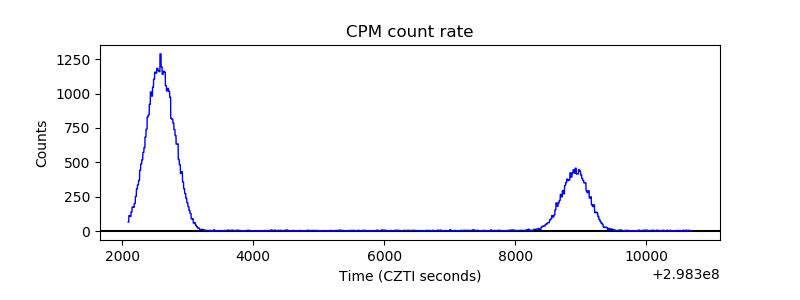 |
| CZT Counter | 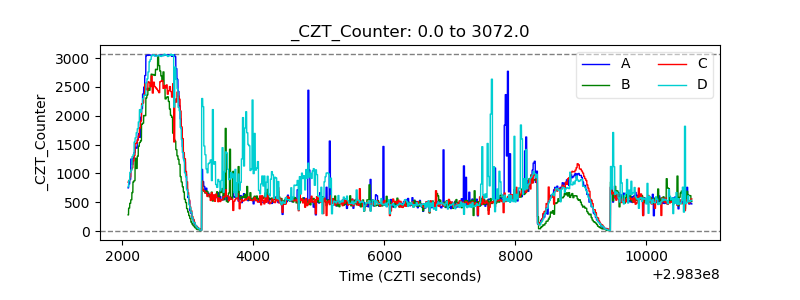 |
| +2.5 Volts monitor |  |
| +5 Volts monitor |  |
| _ROLL_ROT | 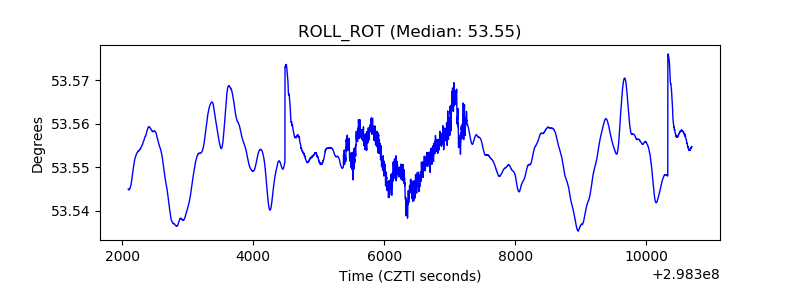 |
| _Roll_DEC | 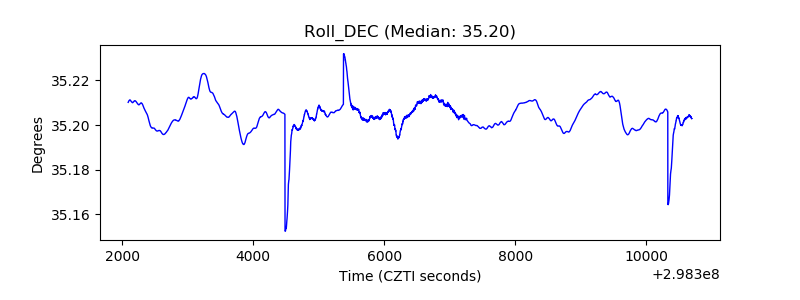 |
| _Roll_RA | 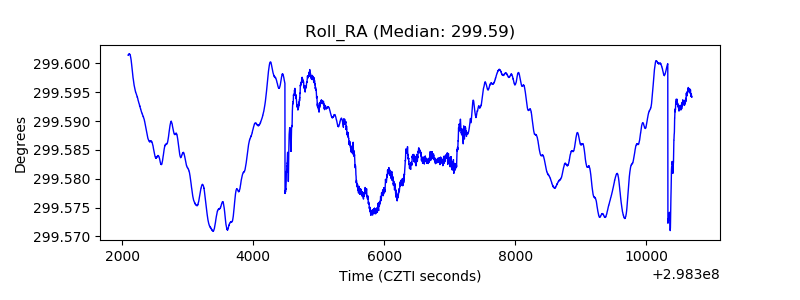 |
| Veto Counter | 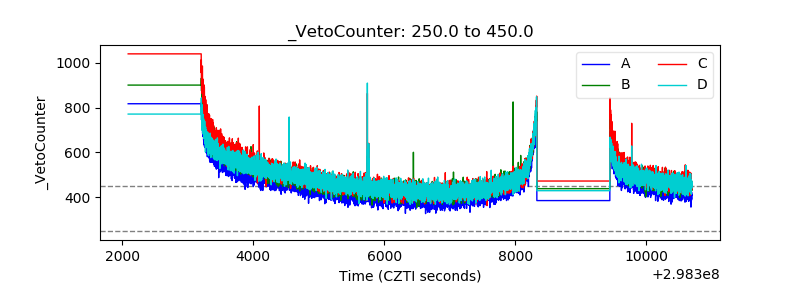 |