| Param | Original file | Final file |
|---|---|---|
| Filename | modeM0/AS1A05_180T01_9000002992_20079cztM0_level2.evt | modeM0/AS1A05_180T01_9000002992_20079cztM0_level2_quad_clean.evt |
| Size (bytes) | 522,740,160 | 112,104,000 |
| Size | 498.5 MB | 106.9 MB |
| Events in quadrant A | 3,942,845 | 737,103 |
| Events in quadrant B | 3,864,003 | 739,304 |
| Events in quadrant C | 3,700,021 | 708,190 |
| Events in quadrant D | 3,834,178 | 708,083 |
| Mode M9 | |||
|---|---|---|---|
| Quadrant | BADHDUFLAG | Total packets | Discarded packets |
| A | 0 | 18 | 0 |
| B | 0 | 18 | 0 |
| C | 0 | 18 | 0 |
| D | 0 | 18 | 0 |
| Mode M0 | |||
|---|---|---|---|
| Quadrant | BADHDUFLAG | Total packets | Discarded packets |
| A | 0 | 16058 | 2 |
| B | 0 | 15734 | 2 |
| C | 0 | 15171 | 2 |
| D | 0 | 15978 | 2 |
| Mode SS | |||
|---|---|---|---|
| Quadrant | BADHDUFLAG | Total packets | Discarded packets |
| A | 0 | 150 | 0 |
| B | 0 | 150 | 0 |
| C | 0 | 150 | 0 |
| D | 0 | 150 | 0 |
| Quadrant | Total seconds | Saturated seconds | Saturation percentage |
|---|---|---|---|
| A | 7211 | 233 | 3.231175% |
| B | 7211 | 173 | 2.399112% |
| C | 7211 | 188 | 2.607128% |
| D | 7212 | 160 | 2.218525% |
Noise dominated data is calculated using 1-second bins in cleaned event files. If a bin has >2000 counts, and if more than 50% of those come from <1% of pixels, then it is considered to be noise-dominated and hence unusable.
| Quadrant | # 1 sec bins | Bins with >0 counts | Bins with >2000 counts | High rate bins dominated by noise | Noise dominated (total time) | Noise dominated (detector-on time) | Marked lightcurve |
|---|---|---|---|---|---|---|---|
| A | 9086 | 7213 | 45 | 45 | 0.50% | 0.62% | 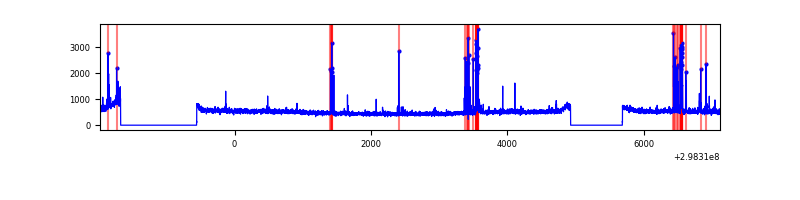 |
| B | 9086 | 7213 | 0 | 0 | 0.00% | 0.00% | 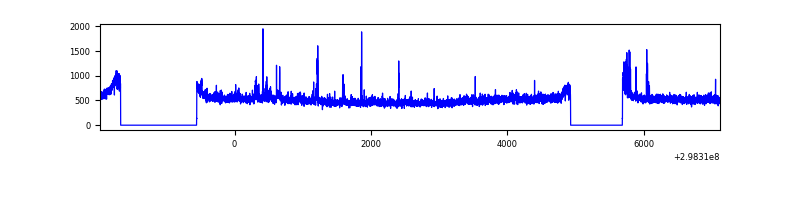 |
| C | 9086 | 7213 | 0 | 0 | 0.00% | 0.00% | 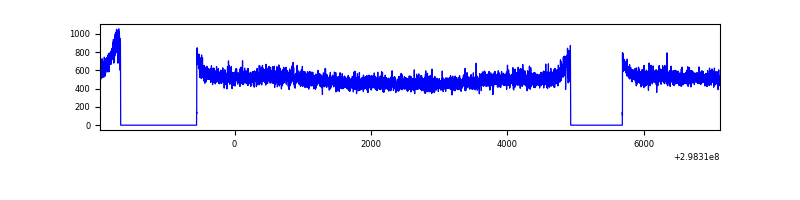 |
| D | 9087 | 7214 | 23 | 23 | 0.25% | 0.32% | 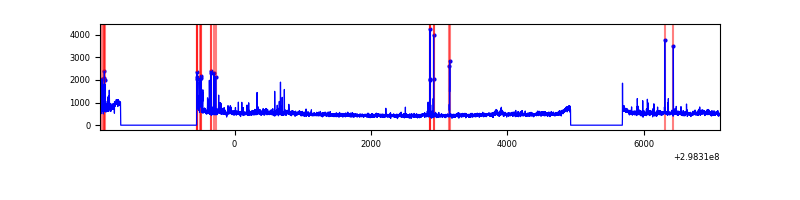 |
Top three noisy pixels from each quadrant. If the there are fewer than three noisy pixels in the level2.evt file, extra rows are filled as -1
| Pixel properties | Quadrant properties | ||||||
|---|---|---|---|---|---|---|---|
| Quadrant | DetID | PixID | Counts | Sigma | Mean | Median | Sigma |
| A | 14 | 238 | 239657 | 1253.0 | 947 | 931 | 190.5 |
| A | 11 | 29 | 18195 | 90.61 | 947 | 931 | 190.5 |
| A | 4 | 2 | 12730 | 61.93 | 947 | 931 | 190.5 |
| B | 0 | 183 | 47341 | 261.0 | 942 | 921 | 177.9 |
| B | 10 | 245 | 34003 | 186.01 | 942 | 921 | 177.9 |
| B | 0 | 189 | 24028 | 129.92 | 942 | 921 | 177.9 |
| C | 14 | 238 | 142273 | 663.71 | 910 | 920 | 213.0 |
| C | 13 | 61 | 6208 | 24.83 | 910 | 920 | 213.0 |
| C | 3 | 233 | 4514 | 16.88 | 910 | 920 | 213.0 |
| D | 7 | 238 | 93268 | 405.11 | 931 | 906 | 228.0 |
| D | 1 | 52 | 91372 | 396.79 | 931 | 906 | 228.0 |
| D | 12 | 218 | 83237 | 361.11 | 931 | 906 | 228.0 |
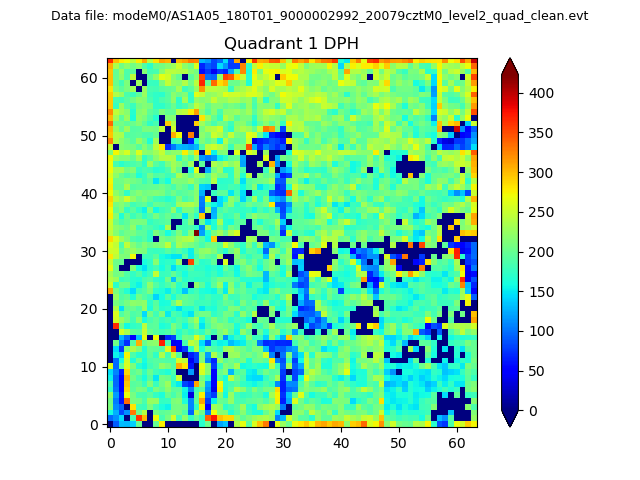
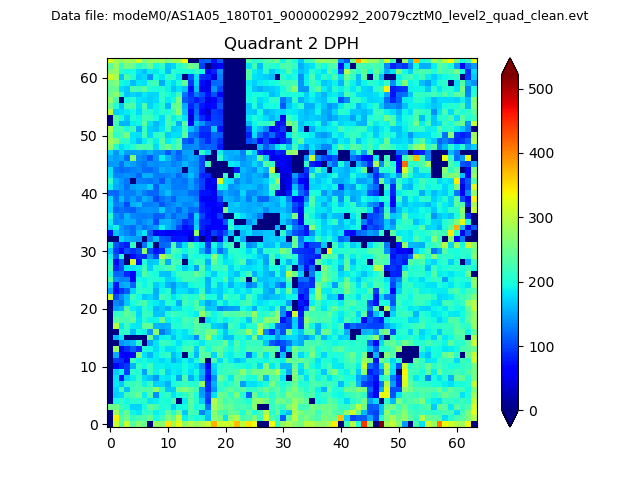
Histogram calculated using DETX and DETY for each event in the final _common_clean file
| Quadrant A |  |
 |
Quadrant B |
|---|---|---|---|
| Quadrant D | 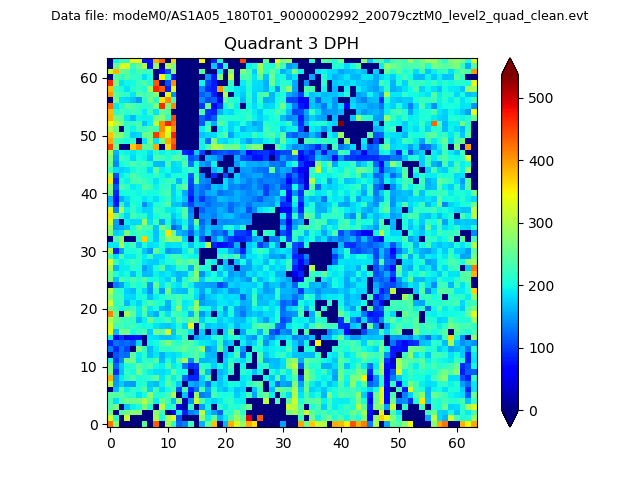 |
 |
Quadrant C |
| Plot type | Count rate plots | Images |
|---|---|---|
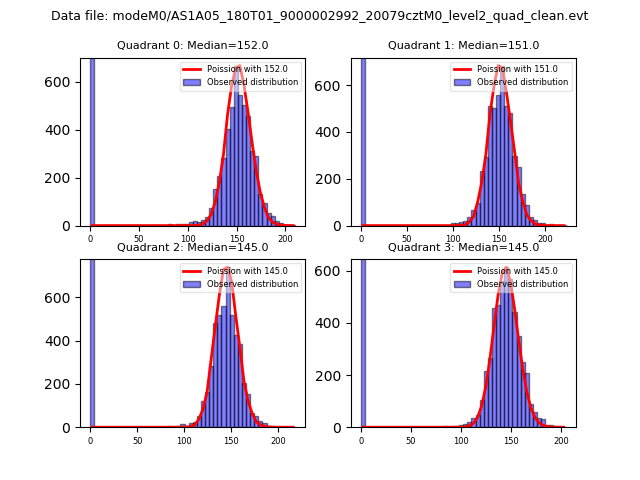
| Comparison with Poisson distribution Blue bars denote a histogram of data divided into 1 sec bins. Red curve is a Poisson curve with rate = median count rate of data. |
 |
 |
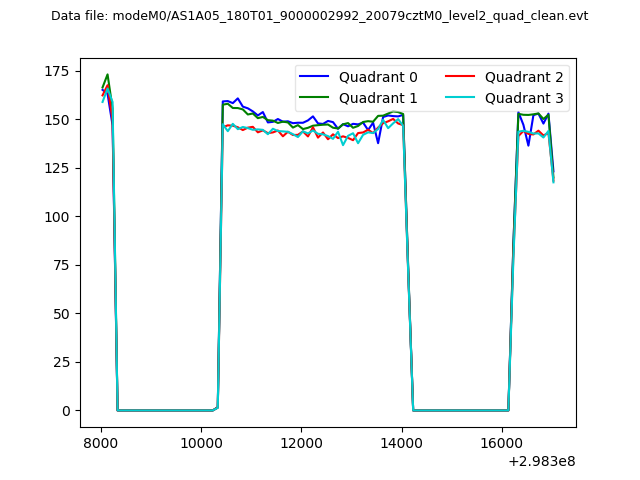
| Quadrant-wise count rates Data is divided into 100 sec bins |
 |
|
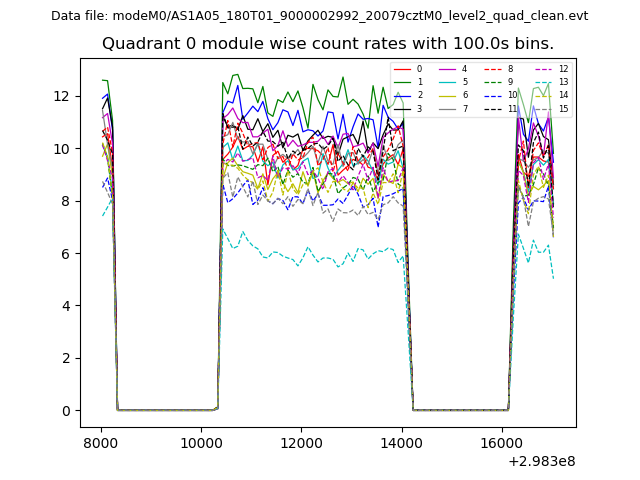
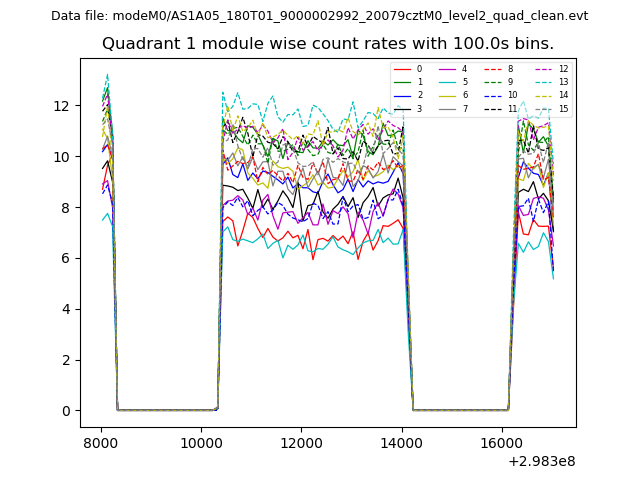
| Module-wise count rates for Quadrant A Data is divided into 100 sec bins |
 |
 |
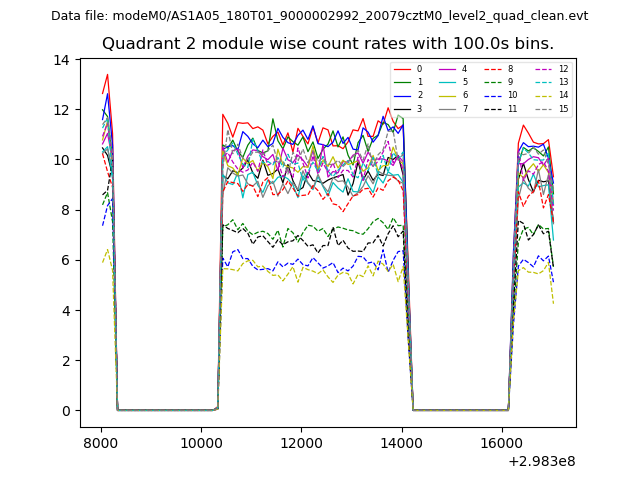
| Module-wise count rates for Quadrant B Data is divided into 100 sec bins |
 |
 |
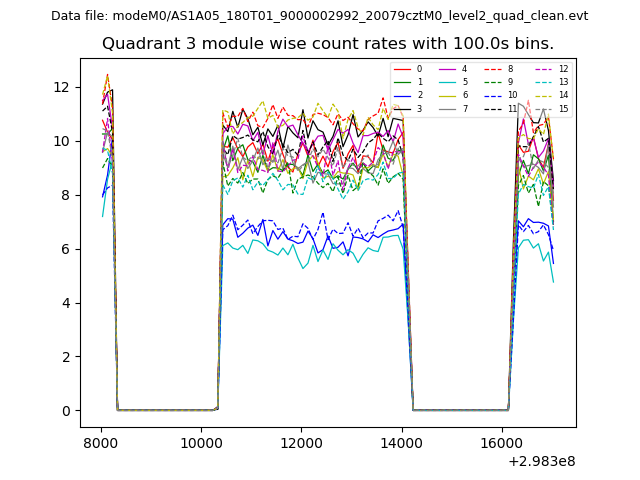
| Module-wise count rates for Quadrant C Data is divided into 100 sec bins |
 |
 |
| Module-wise count rates for Quadrant D Data is divided into 100 sec bins |
 |
 |
| Parameter | Plot |
|---|---|
| CZT HV Monitor | 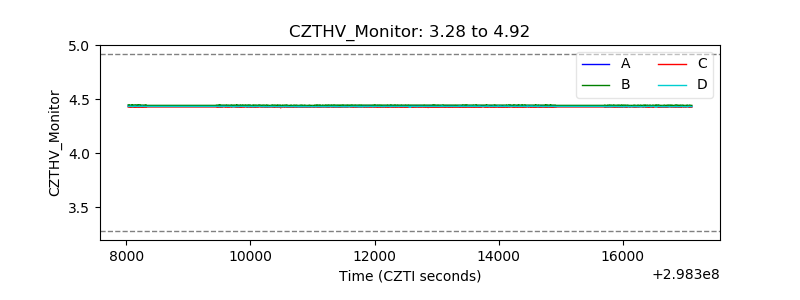 |
| D_VDD | 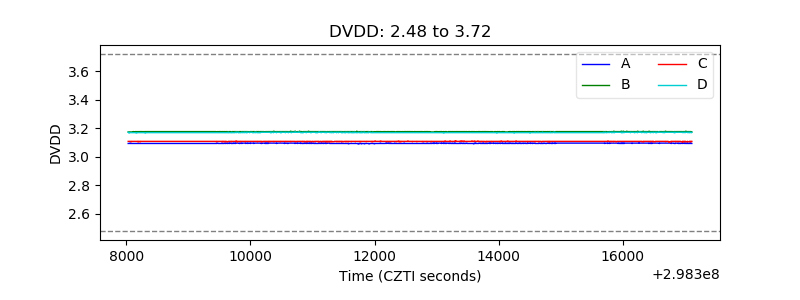 |
| Temperature 1 | 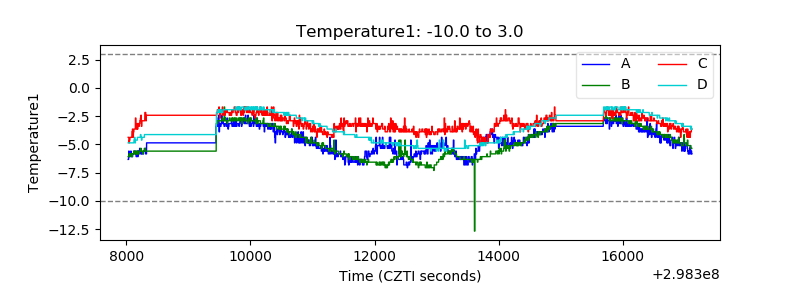 |
| Veto HV Monitor | 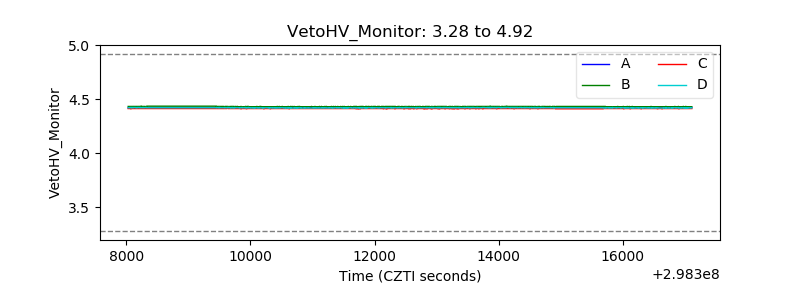 |
| Veto LLD | 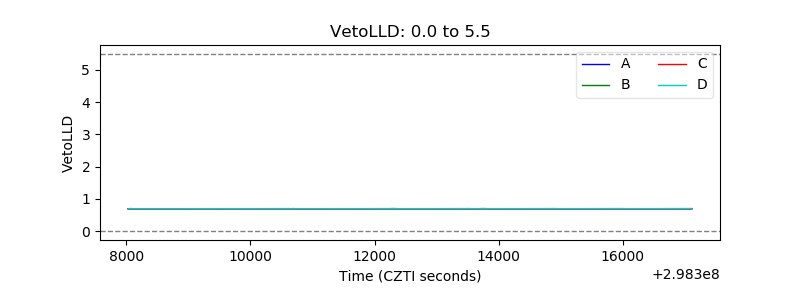 |
| Alpha Counter | 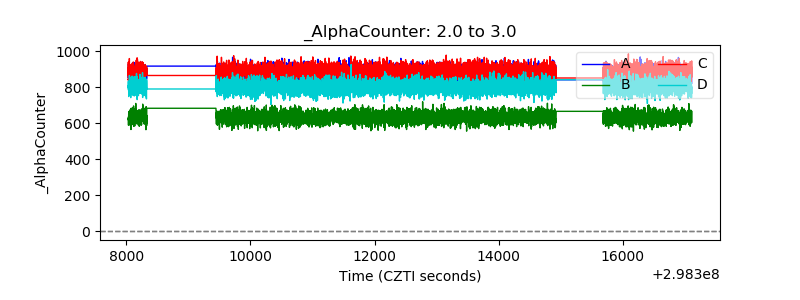 |
| _CPM_Rate | 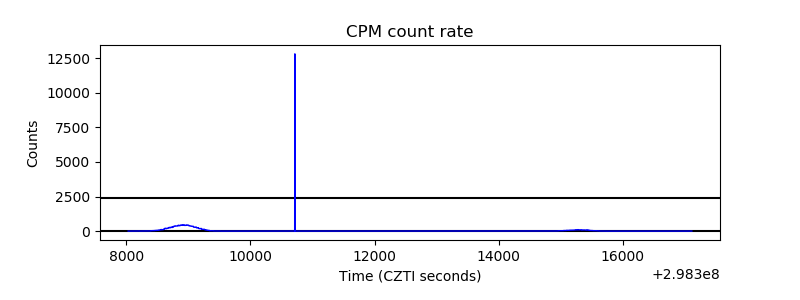 |
| CZT Counter | 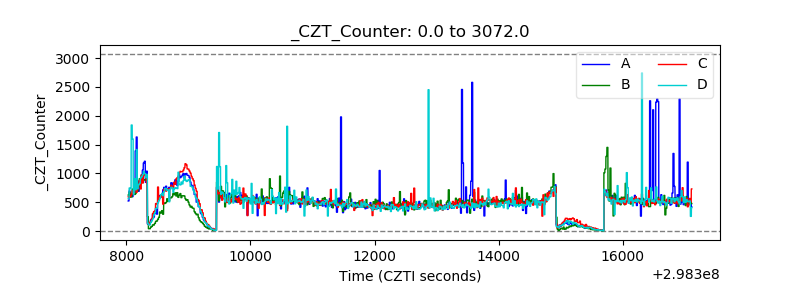 |
| +2.5 Volts monitor |  |
| +5 Volts monitor | 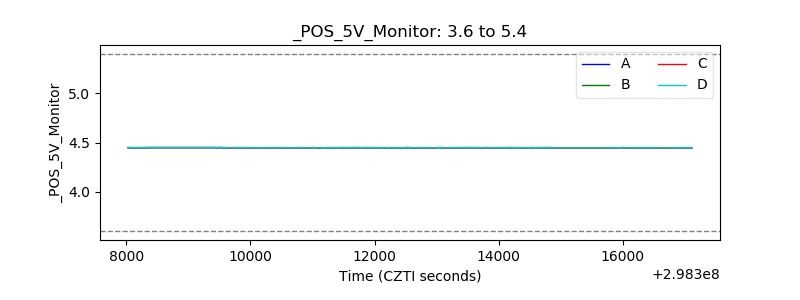 |
| _ROLL_ROT | 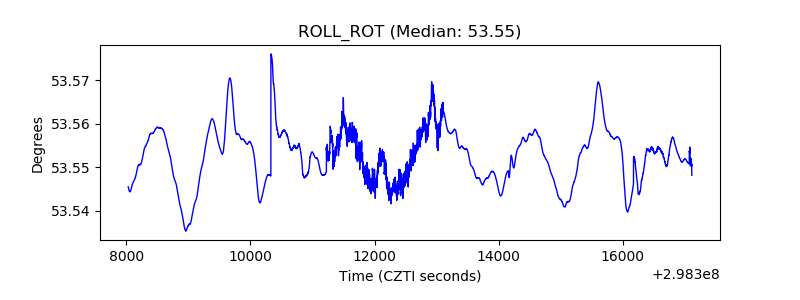 |
| _Roll_DEC | 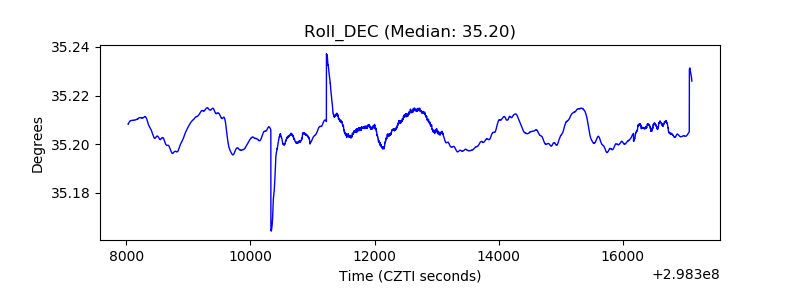 |
| _Roll_RA | 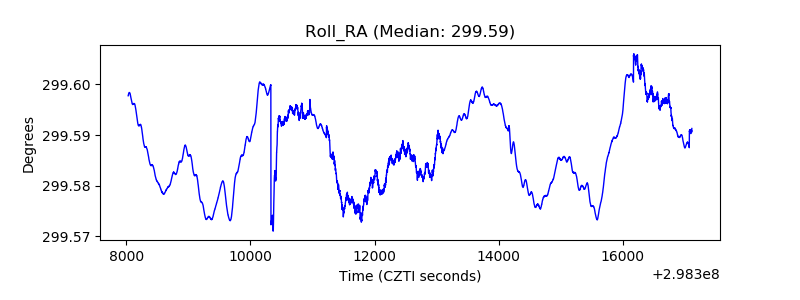 |
| Veto Counter | 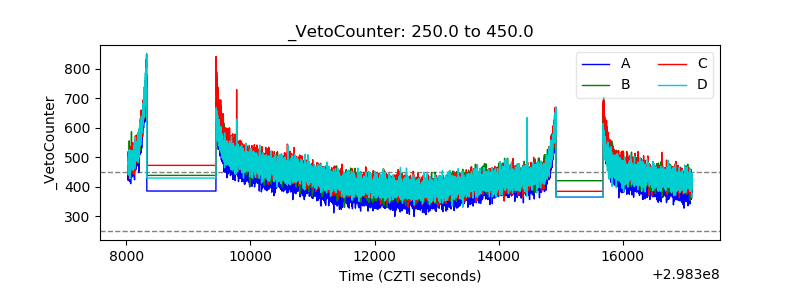 |