| Param | Original file | Final file |
|---|---|---|
| Filename | modeM0/AS1A05_180T01_9000002992_20081cztM0_level2.evt | modeM0/AS1A05_180T01_9000002992_20081cztM0_level2_quad_clean.evt |
| Size (bytes) | 511,536,960 | 108,267,840 |
| Size | 487.8 MB | 103.3 MB |
| Events in quadrant A | 3,559,901 | 721,832 |
| Events in quadrant B | 3,681,911 | 711,690 |
| Events in quadrant C | 3,536,976 | 689,371 |
| Events in quadrant D | 4,236,965 | 668,516 |
| Mode M9 | |||
|---|---|---|---|
| Quadrant | BADHDUFLAG | Total packets | Discarded packets |
| A | 0 | 4 | 2 |
| B | 0 | 4 | 2 |
| C | 0 | 3 | 1 |
| D | 0 | 3 | 1 |
| Mode M0 | |||
|---|---|---|---|
| Quadrant | BADHDUFLAG | Total packets | Discarded packets |
| A | 0 | 16410 | 1380 |
| B | 0 | 16749 | 1492 |
| C | 0 | 16232 | 1396 |
| D | 0 | 19474 | 2190 |
| Mode SS | |||
|---|---|---|---|
| Quadrant | BADHDUFLAG | Total packets | Discarded packets |
| A | 0 | 158 | 12 |
| B | 0 | 158 | 8 |
| C | 0 | 159 | 23 |
| D | 0 | 157 | 15 |
| Quadrant | Total seconds | Saturated seconds | Saturation percentage |
|---|---|---|---|
| A | 7023 | 98 | 1.395415% |
| B | 7004 | 158 | 2.255854% |
| C | 7026 | 160 | 2.277256% |
| D | 6915 | 176 | 2.545192% |
Noise dominated data is calculated using 1-second bins in cleaned event files. If a bin has >2000 counts, and if more than 50% of those come from <1% of pixels, then it is considered to be noise-dominated and hence unusable.
| Quadrant | # 1 sec bins | Bins with >0 counts | Bins with >2000 counts | High rate bins dominated by noise | Noise dominated (total time) | Noise dominated (detector-on time) | Marked lightcurve |
|---|---|---|---|---|---|---|---|
| A | 7869 | 7617 | 11 | 11 | 0.14% | 0.14% |  |
| B | 7869 | 7621 | 11 | 11 | 0.14% | 0.14% |  |
| C | 7869 | 7640 | 0 | 0 | 0.00% | 0.00% |  |
| D | 7869 | 7616 | 44 | 44 | 0.56% | 0.58% |  |
Top three noisy pixels from each quadrant. If the there are fewer than three noisy pixels in the level2.evt file, extra rows are filled as -1
| Pixel properties | Quadrant properties | ||||||
|---|---|---|---|---|---|---|---|
| Quadrant | DetID | PixID | Counts | Sigma | Mean | Median | Sigma |
| A | 14 | 238 | 72799 | 392.35 | 898 | 882 | 183.3 |
| A | 11 | 29 | 17426 | 90.26 | 898 | 882 | 183.3 |
| A | 3 | 1 | 11127 | 55.89 | 898 | 882 | 183.3 |
| B | 4 | 80 | 39800 | 227.32 | 887 | 865 | 171.3 |
| B | 7 | 220 | 28527 | 161.5 | 887 | 865 | 171.3 |
| B | 0 | 183 | 28086 | 158.93 | 887 | 865 | 171.3 |
| C | 14 | 238 | 133958 | 649.66 | 862 | 869 | 204.9 |
| C | 4 | 254 | 37188 | 177.29 | 862 | 869 | 204.9 |
| C | 3 | 233 | 9193 | 40.63 | 862 | 869 | 204.9 |
| D | 1 | 52 | 691442 | 3289.16 | 856 | 835 | 210.0 |
| D | 12 | 218 | 212655 | 1008.84 | 856 | 835 | 210.0 |
| D | 7 | 238 | 62131 | 291.93 | 856 | 835 | 210.0 |
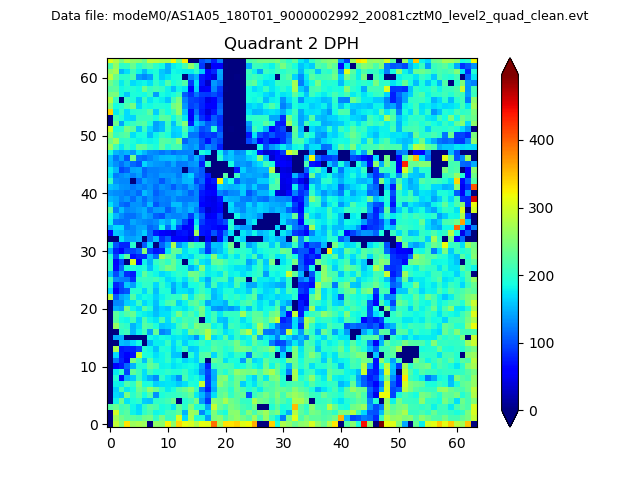
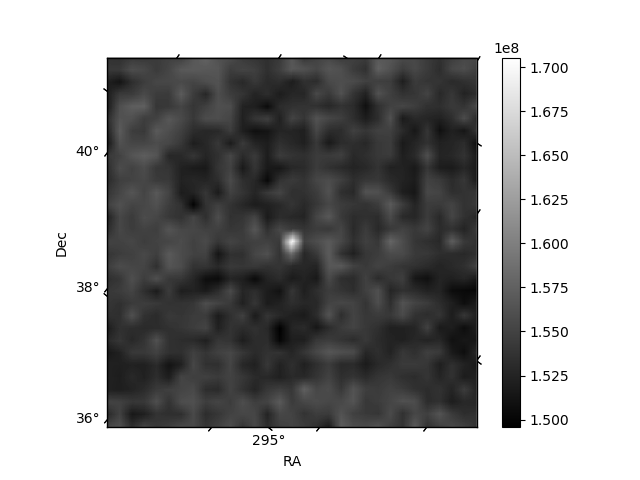
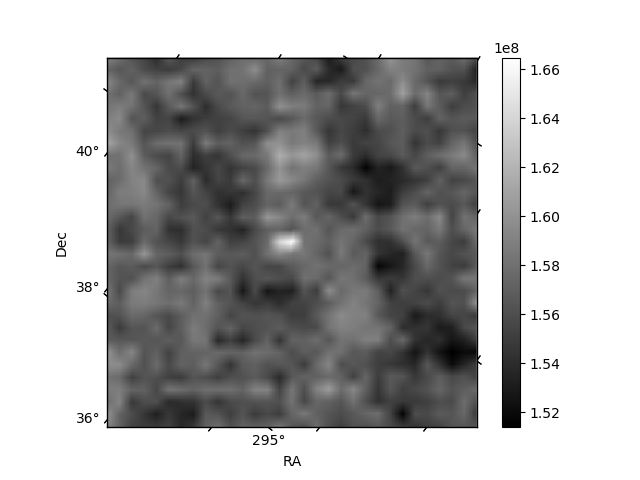
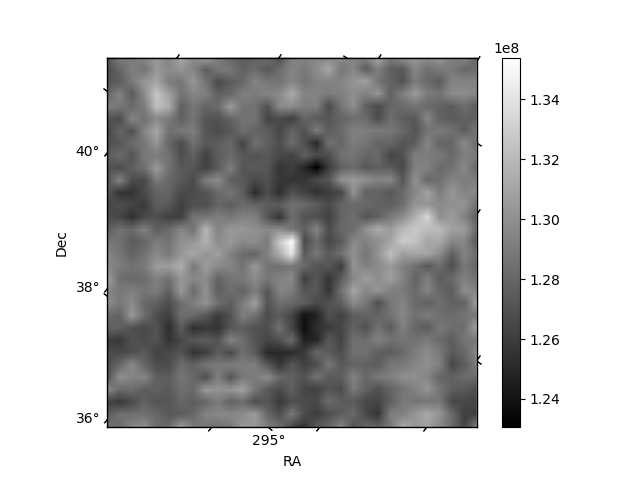
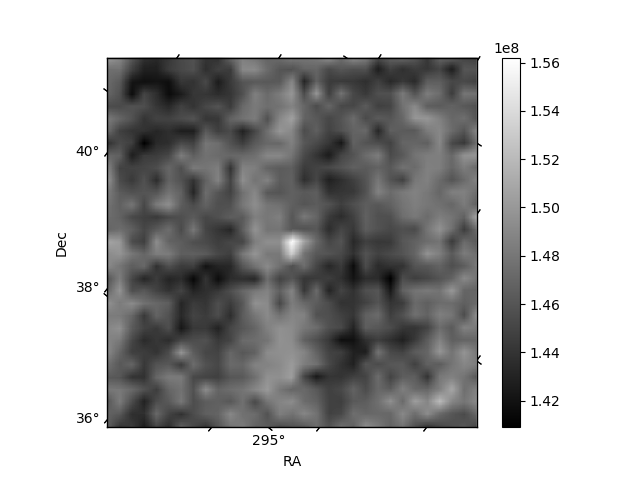
Histogram calculated using DETX and DETY for each event in the final _common_clean file
| Quadrant A | 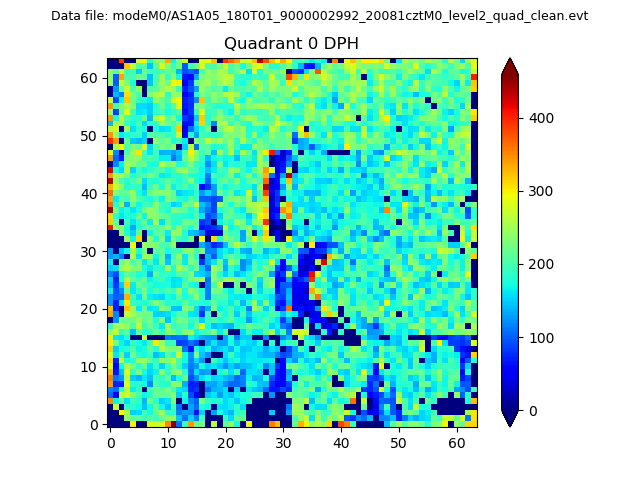 |
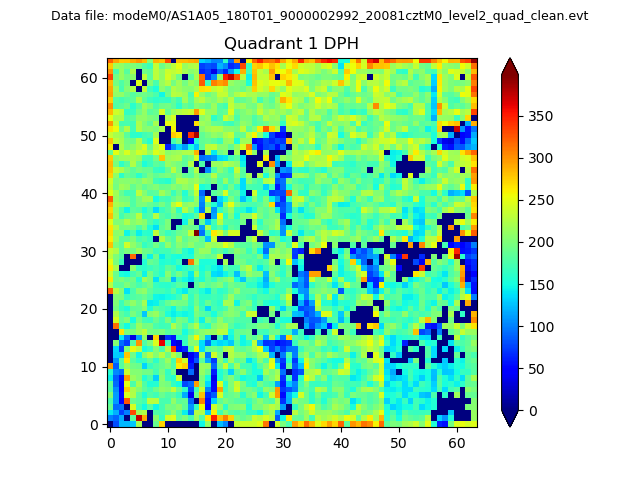 |
Quadrant B |
|---|---|---|---|
| Quadrant D | 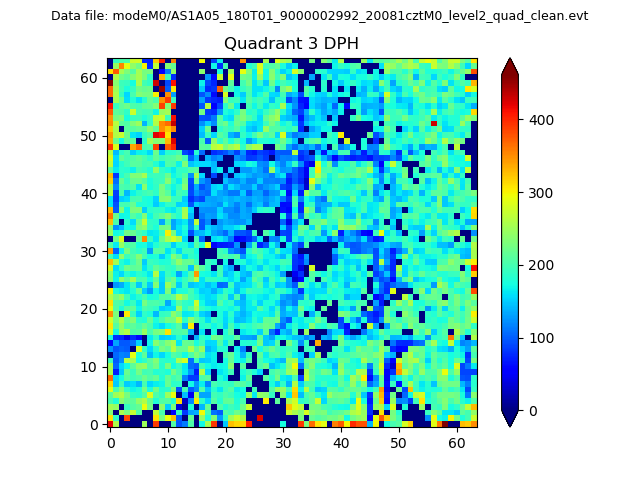 |
 |
Quadrant C |
| Plot type | Count rate plots | Images |
|---|---|---|
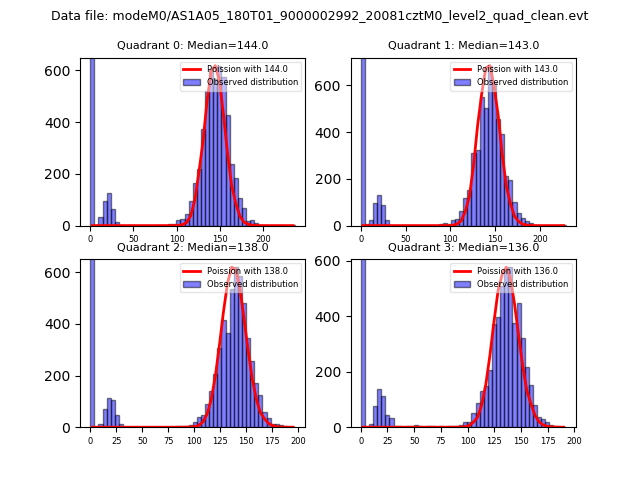
| Comparison with Poisson distribution Blue bars denote a histogram of data divided into 1 sec bins. Red curve is a Poisson curve with rate = median count rate of data. |
 |
 |
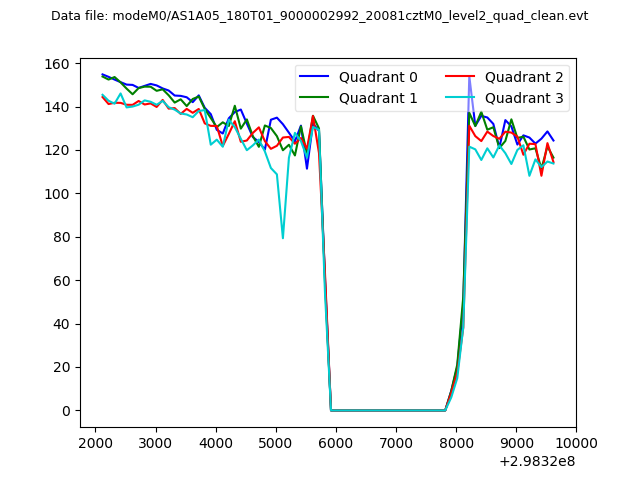
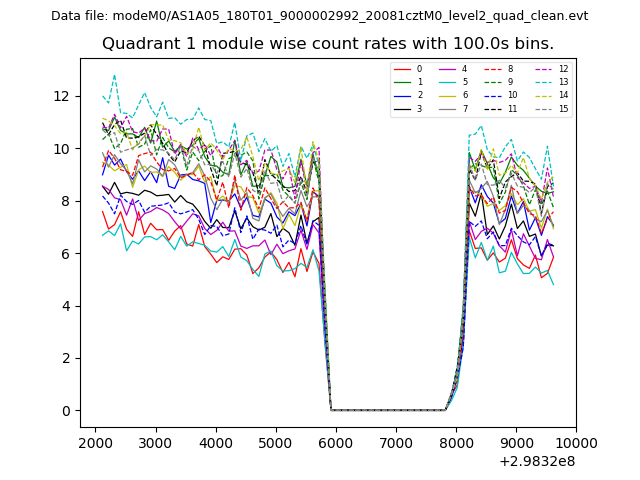
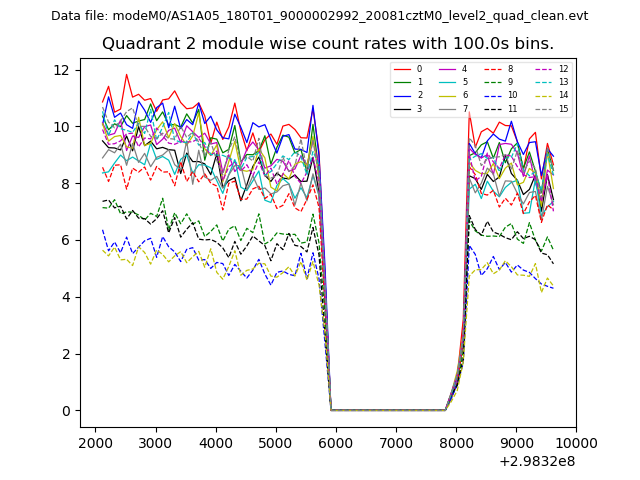
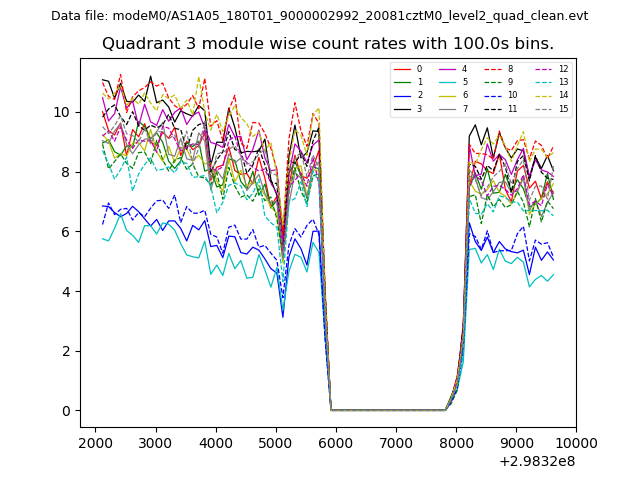
| Quadrant-wise count rates Data is divided into 100 sec bins |
 |
|
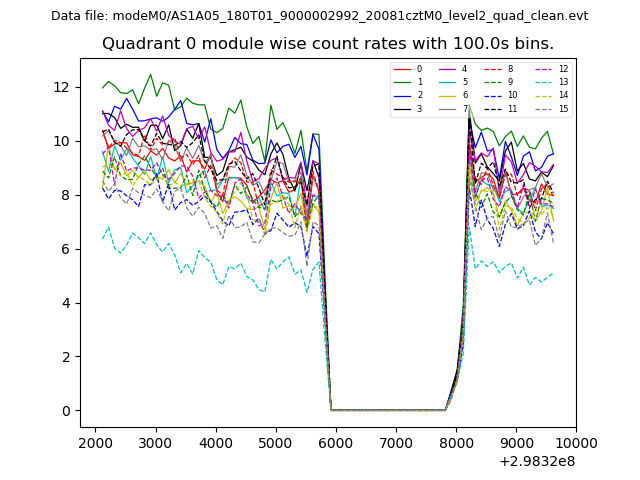
| Module-wise count rates for Quadrant A Data is divided into 100 sec bins |
 |
 |
| Module-wise count rates for Quadrant B Data is divided into 100 sec bins |
 |
 |
| Module-wise count rates for Quadrant C Data is divided into 100 sec bins |
 |
 |
| Module-wise count rates for Quadrant D Data is divided into 100 sec bins |
 |
 |
| Parameter | Plot |
|---|---|
| CZT HV Monitor | 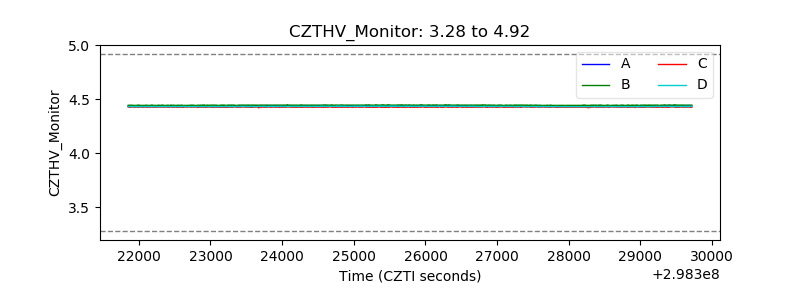 |
| D_VDD | 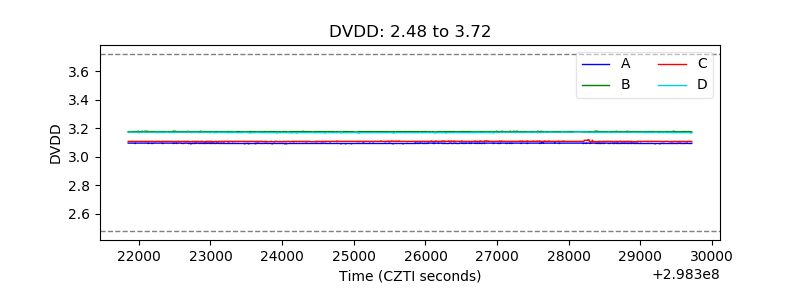 |
| Temperature 1 | 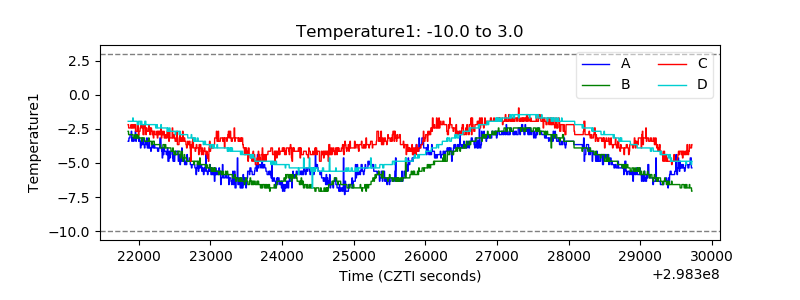 |
| Veto HV Monitor | 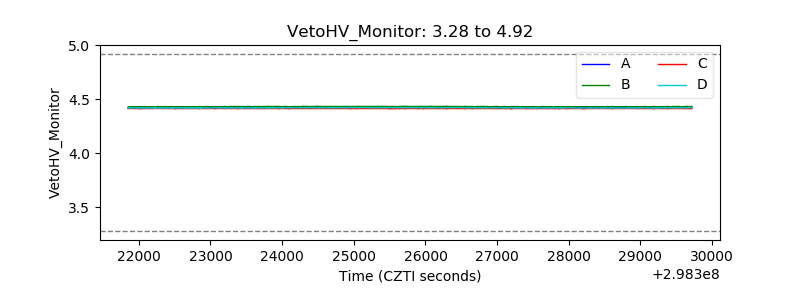 |
| Veto LLD | 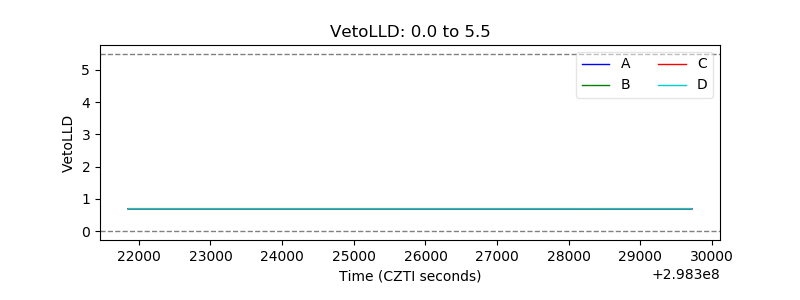 |
| Alpha Counter | 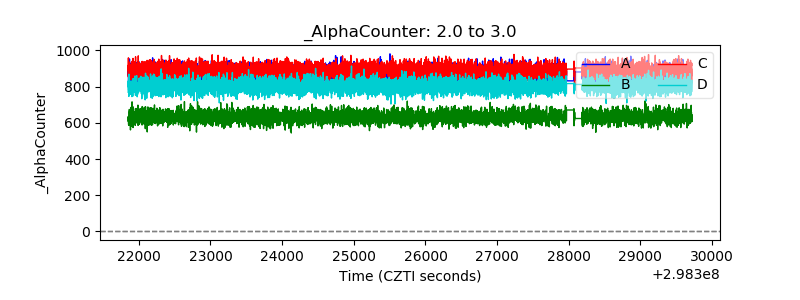 |
| _CPM_Rate | 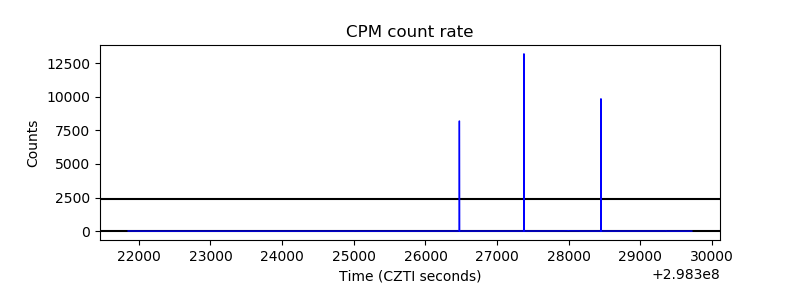 |
| CZT Counter | 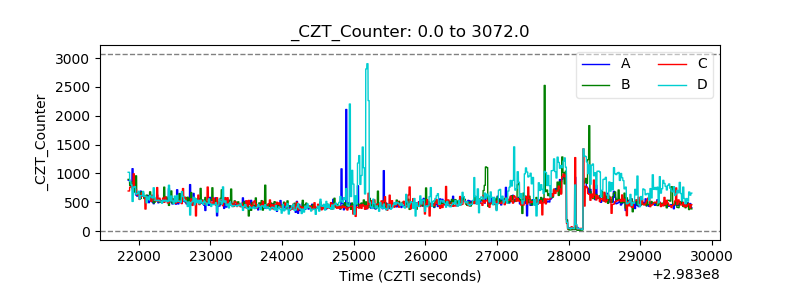 |
| +2.5 Volts monitor |  |
| +5 Volts monitor |  |
| _ROLL_ROT | 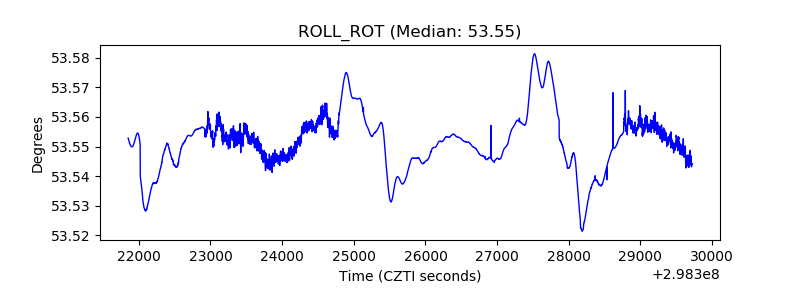 |
| _Roll_DEC | 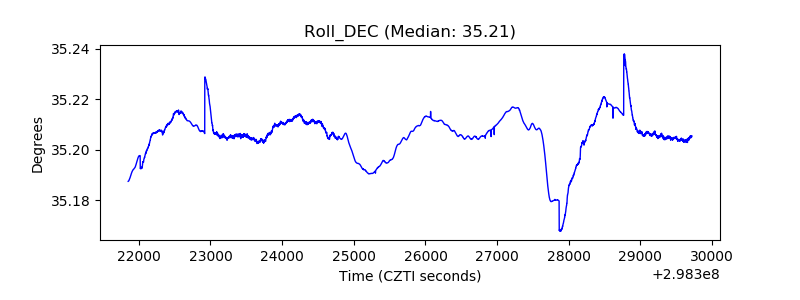 |
| _Roll_RA | 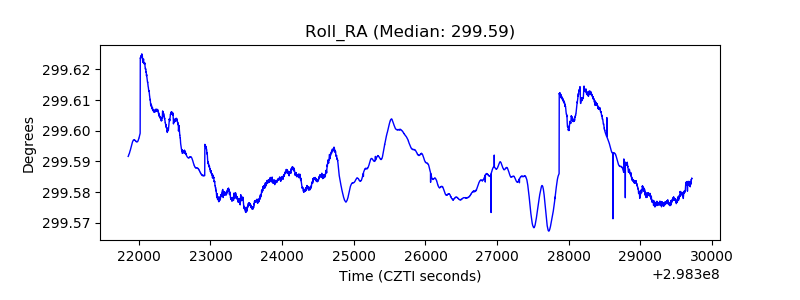 |
| Veto Counter | 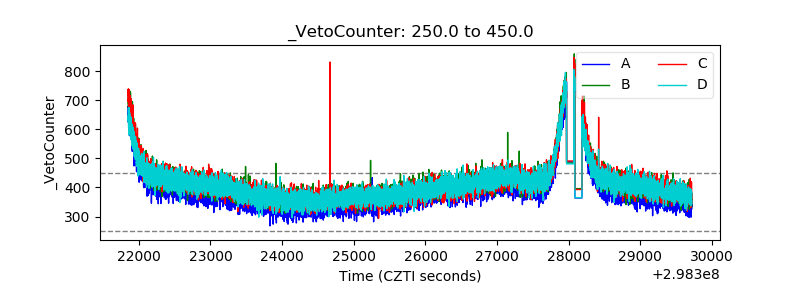 |