| Param | Original file | Final file |
|---|---|---|
| Filename | modeM0/AS1A05_180T01_9000002992_20082cztM0_level2.evt | modeM0/AS1A05_180T01_9000002992_20082cztM0_level2_quad_clean.evt |
| Size (bytes) | 525,778,560 | 17,104,320 |
| Size | 501.4 MB | 16.3 MB |
| Events in quadrant A | 3,574,150 | 8,440 |
| Events in quadrant B | 3,640,024 | 8,339 |
| Events in quadrant C | 3,485,761 | 8,355 |
| Events in quadrant D | 4,750,687 | 8,183 |
| Mode M9 | |||
|---|---|---|---|
| Quadrant | BADHDUFLAG | Total packets | Discarded packets |
| A | 0 | 10 | 4 |
| B | 0 | 10 | 5 |
| C | 0 | 8 | 3 |
| D | 0 | 11 | 5 |
| Mode M0 | |||
|---|---|---|---|
| Quadrant | BADHDUFLAG | Total packets | Discarded packets |
| A | 0 | 16781 | 1631 |
| B | 0 | 16931 | 1633 |
| C | 0 | 16336 | 1599 |
| D | 0 | 21262 | 2304 |
| Mode SS | |||
|---|---|---|---|
| Quadrant | BADHDUFLAG | Total packets | Discarded packets |
| A | 0 | 159 | 7 |
| B | 0 | 163 | 19 |
| C | 0 | 166 | 20 |
| D | 0 | 159 | 11 |
| Quadrant | Total seconds | Saturated seconds | Saturation percentage |
|---|---|---|---|
| A | 6946 | 151 | 2.173913% |
| B | 6947 | 192 | 2.763783% |
| C | 6937 | 204 | 2.940752% |
| D | 6883 | 184 | 2.673253% |
Noise dominated data is calculated using 1-second bins in cleaned event files. If a bin has >2000 counts, and if more than 50% of those come from <1% of pixels, then it is considered to be noise-dominated and hence unusable.
| Quadrant | # 1 sec bins | Bins with >0 counts | Bins with >2000 counts | High rate bins dominated by noise | Noise dominated (total time) | Noise dominated (detector-on time) | Marked lightcurve |
|---|---|---|---|---|---|---|---|
| A | 8287 | 7632 | 25 | 25 | 0.30% | 0.33% | 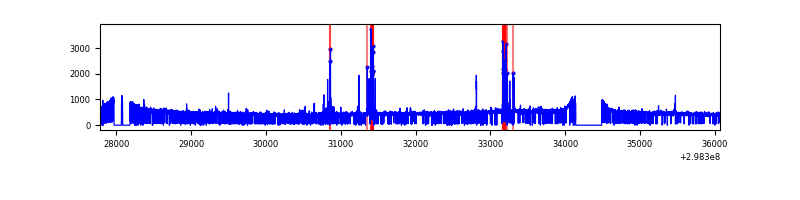 |
| B | 8287 | 7638 | 19 | 19 | 0.23% | 0.25% | 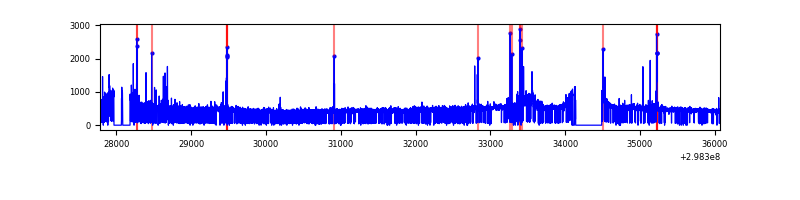 |
| C | 8287 | 7630 | 0 | 0 | 0.00% | 0.00% | 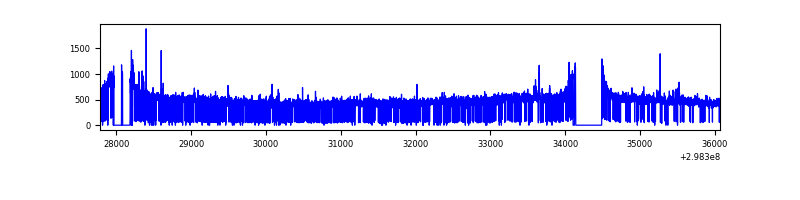 |
| D | 8287 | 7653 | 16 | 16 | 0.19% | 0.21% | 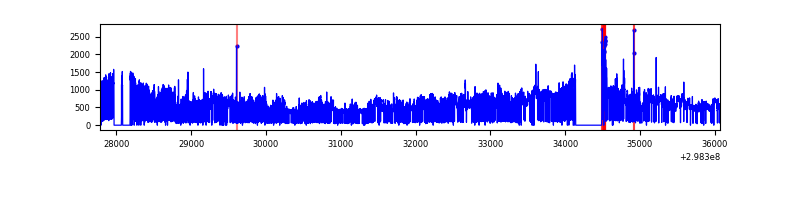 |
Top three noisy pixels from each quadrant. If the there are fewer than three noisy pixels in the level2.evt file, extra rows are filled as -1
| Pixel properties | Quadrant properties | ||||||
|---|---|---|---|---|---|---|---|
| Quadrant | DetID | PixID | Counts | Sigma | Mean | Median | Sigma |
| A | 14 | 238 | 154330 | 858.6 | 877 | 862 | 178.7 |
| A | 4 | 2 | 28189 | 152.88 | 877 | 862 | 178.7 |
| A | 11 | 29 | 10312 | 52.87 | 877 | 862 | 178.7 |
| B | 4 | 80 | 65906 | 389.12 | 871 | 851 | 167.2 |
| B | 0 | 183 | 52857 | 311.07 | 871 | 851 | 167.2 |
| B | 0 | 189 | 30290 | 176.08 | 871 | 851 | 167.2 |
| C | 14 | 238 | 132831 | 658.29 | 845 | 853 | 200.5 |
| C | 4 | 254 | 54555 | 267.86 | 845 | 853 | 200.5 |
| C | 3 | 233 | 6771 | 29.52 | 845 | 853 | 200.5 |
| D | 1 | 52 | 1430858 | 6878.19 | 844 | 820 | 207.9 |
| D | 7 | 238 | 71407 | 339.51 | 844 | 820 | 207.9 |
| D | 12 | 218 | 34240 | 160.74 | 844 | 820 | 207.9 |
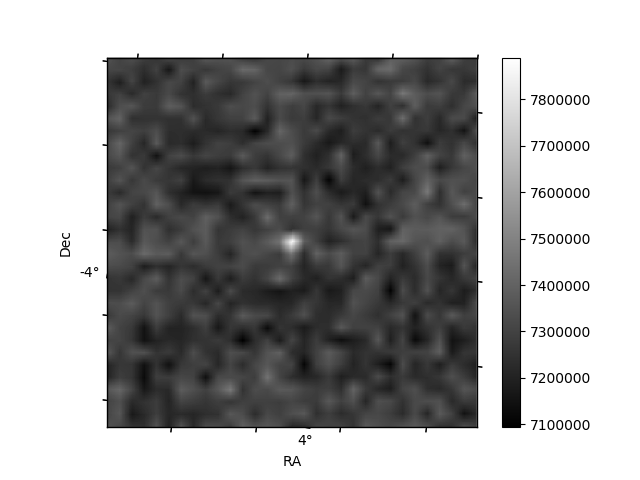
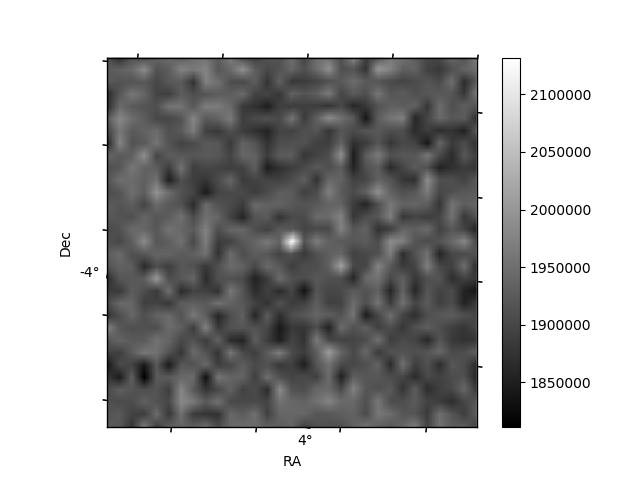
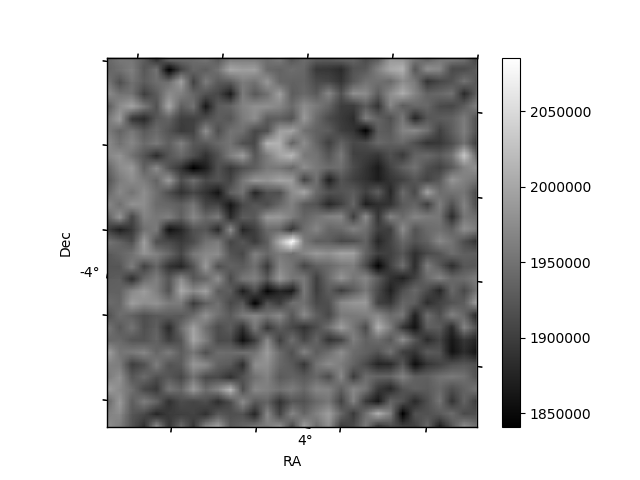
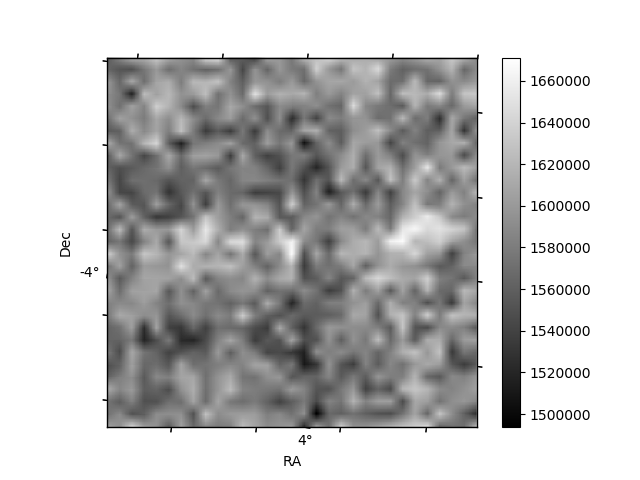
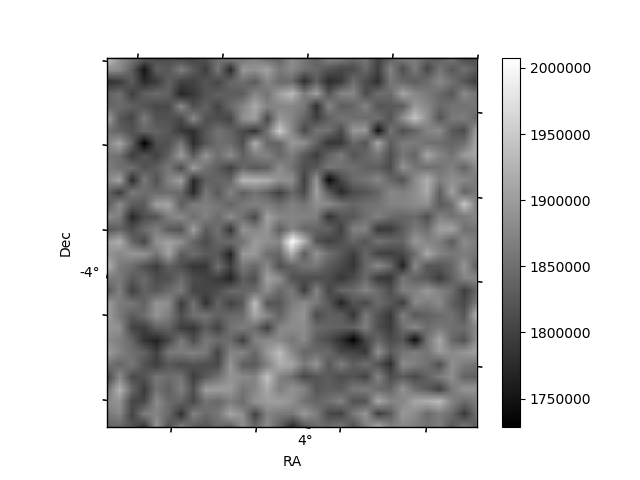
Histogram calculated using DETX and DETY for each event in the final _common_clean file
| Quadrant A | 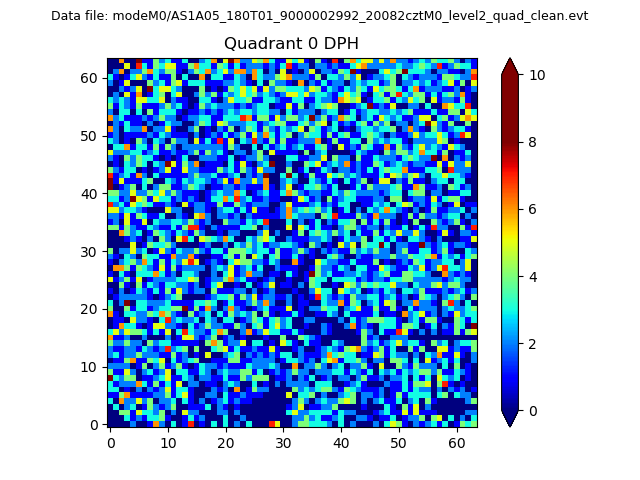 |
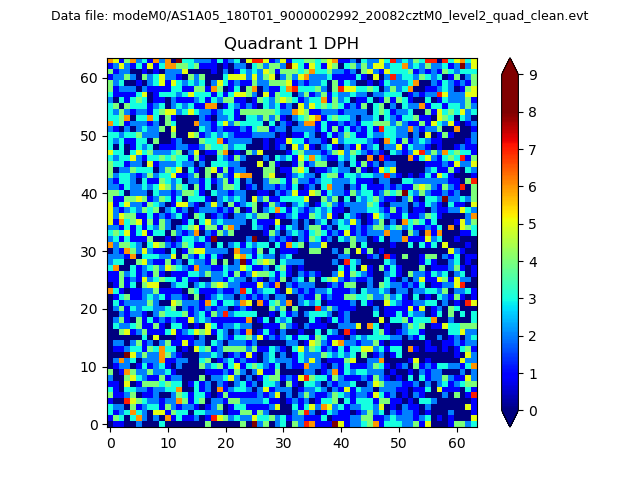 |
Quadrant B |
|---|---|---|---|
| Quadrant D |  |
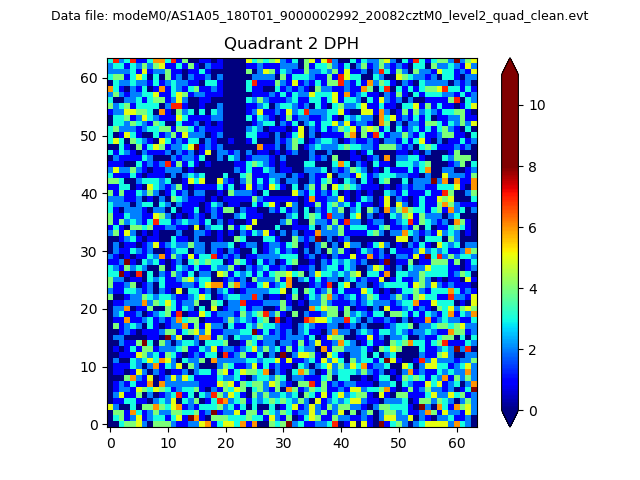 |
Quadrant C |
| Plot type | Count rate plots | Images |
|---|---|---|
| Comparison with Poisson distribution Blue bars denote a histogram of data divided into 1 sec bins. Red curve is a Poisson curve with rate = median count rate of data. |
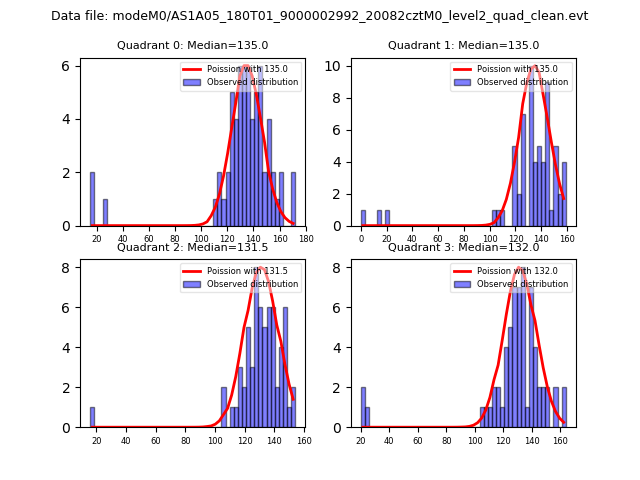 |
 |
| Quadrant-wise count rates Data is divided into 100 sec bins |
 |
|
| Module-wise count rates for Quadrant A Data is divided into 100 sec bins |
 |
 |
| Module-wise count rates for Quadrant B Data is divided into 100 sec bins |
 |
 |
| Module-wise count rates for Quadrant C Data is divided into 100 sec bins |
 |
 |
| Module-wise count rates for Quadrant D Data is divided into 100 sec bins |
 |
 |
| Parameter | Plot |
|---|---|
| CZT HV Monitor |  |
| D_VDD | 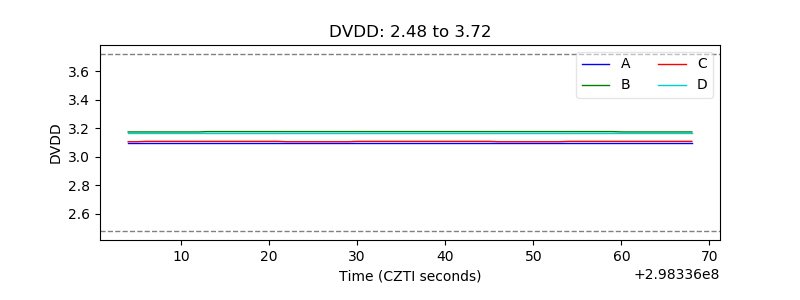 |
| Temperature 1 | 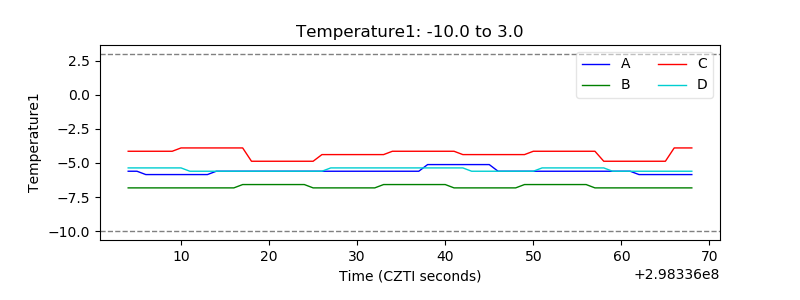 |
| Veto HV Monitor | 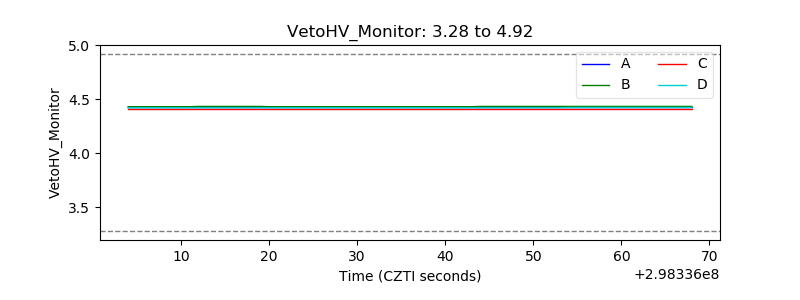 |
| Veto LLD | 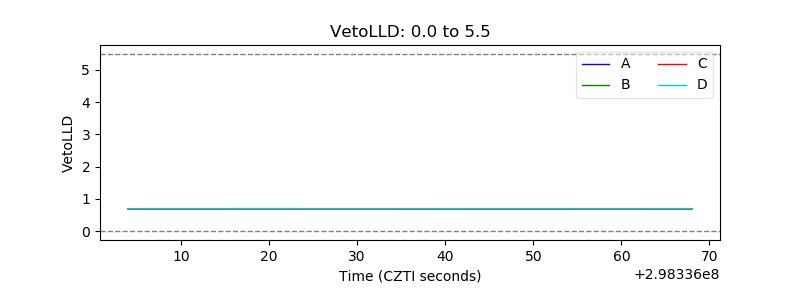 |
| Alpha Counter | 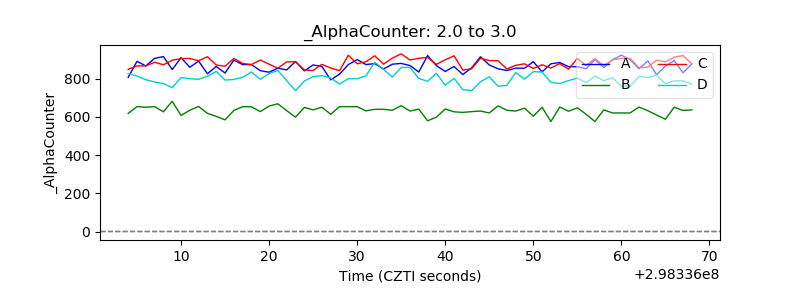 |
| _CPM_Rate | 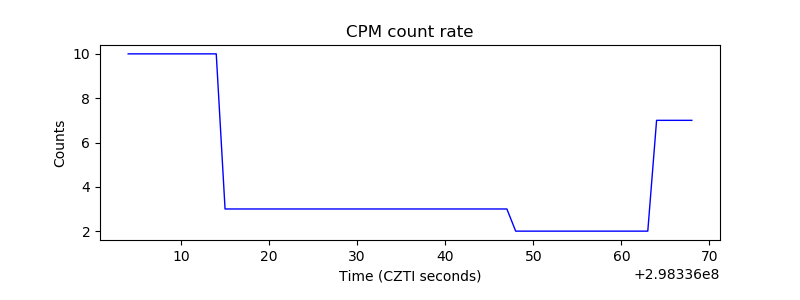 |
| CZT Counter | 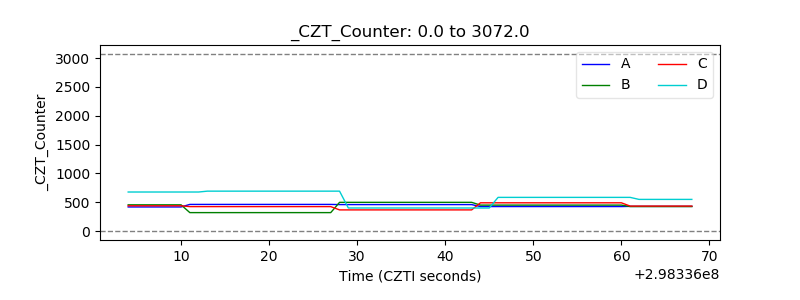 |
| +2.5 Volts monitor |  |
| +5 Volts monitor | 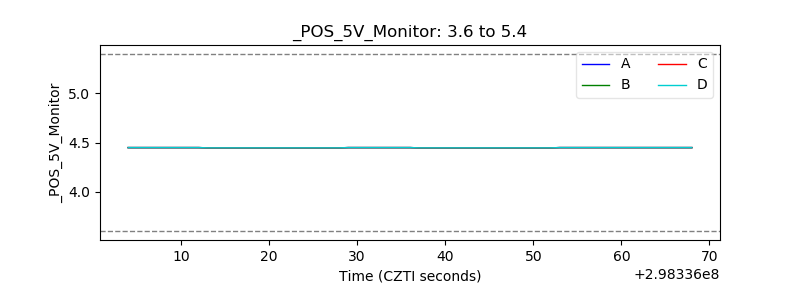 |
| _ROLL_ROT | 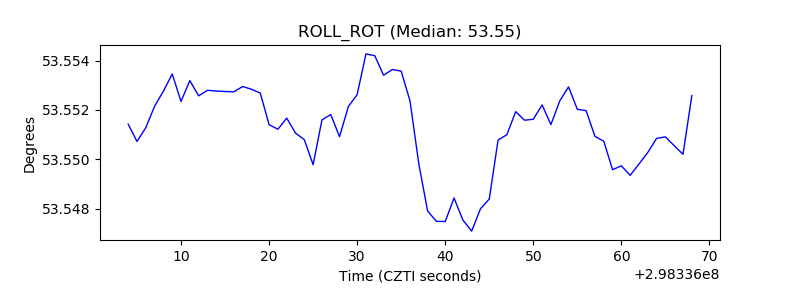 |
| _Roll_DEC | 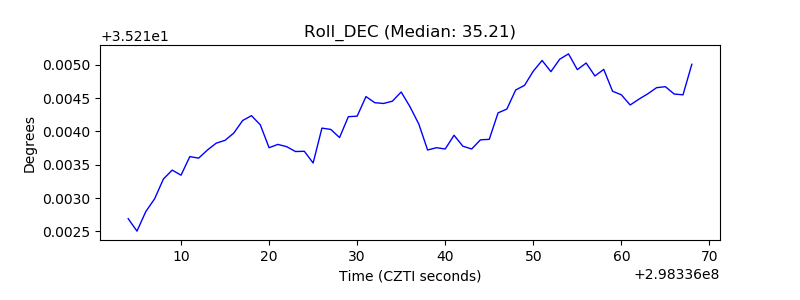 |
| _Roll_RA | 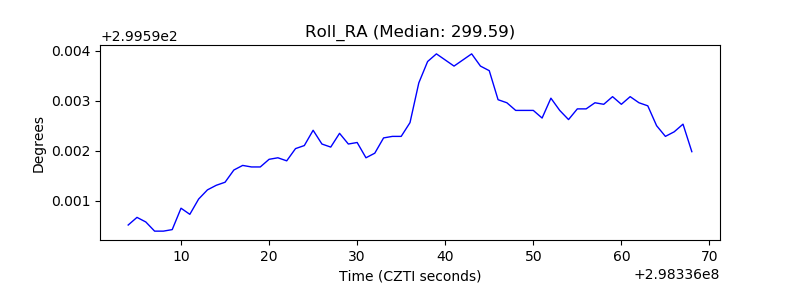 |
| Veto Counter |  |