| Param | Original file | Final file |
|---|---|---|
| Filename | modeM0/AS1A05_180T01_9000002992_20085cztM0_level2.evt | modeM0/AS1A05_180T01_9000002992_20085cztM0_level2_quad_clean.evt |
| Size (bytes) | 2,201,336,640 | 395,170,560 |
| Size | 2.1 GB | 376.9 MB |
| Events in quadrant A | 14,859,137 | 2,577,421 |
| Events in quadrant B | 14,611,864 | 2,576,942 |
| Events in quadrant C | 16,503,510 | 2,421,790 |
| Events in quadrant D | 18,720,261 | 2,387,025 |
| Mode M9 | |||
|---|---|---|---|
| Quadrant | BADHDUFLAG | Total packets | Discarded packets |
| A | 0 | 50 | 20 |
| B | 0 | 54 | 24 |
| C | 0 | 40 | 9 |
| D | 0 | 51 | 21 |
| Mode M0 | |||
|---|---|---|---|
| Quadrant | BADHDUFLAG | Total packets | Discarded packets |
| A | 0 | 68648 | 5952 |
| B | 0 | 67594 | 5845 |
| C | 0 | 73505 | 5775 |
| D | 0 | 83508 | 8438 |
| Mode SS | |||
|---|---|---|---|
| Quadrant | BADHDUFLAG | Total packets | Discarded packets |
| A | 0 | 652 | 42 |
| B | 0 | 658 | 55 |
| C | 0 | 663 | 57 |
| D | 0 | 658 | 45 |
| Quadrant | Total seconds | Saturated seconds | Saturation percentage |
|---|---|---|---|
| A | 29140 | 413 | 1.417296% |
| B | 29173 | 431 | 1.477393% |
| C | 29201 | 1393 | 4.770385% |
| D | 28871 | 1114 | 3.858543% |
Noise dominated data is calculated using 1-second bins in cleaned event files. If a bin has >2000 counts, and if more than 50% of those come from <1% of pixels, then it is considered to be noise-dominated and hence unusable.
| Quadrant | # 1 sec bins | Bins with >0 counts | Bins with >2000 counts | High rate bins dominated by noise | Noise dominated (total time) | Noise dominated (detector-on time) | Marked lightcurve |
|---|---|---|---|---|---|---|---|
| A | 35078 | 31636 | 82 | 82 | 0.23% | 0.26% | 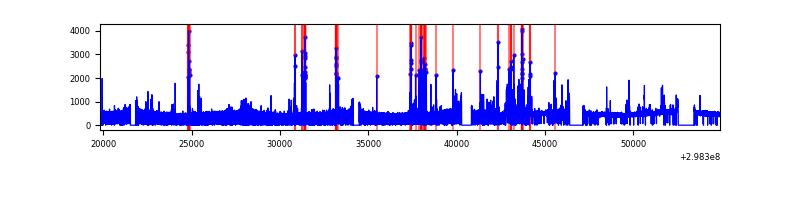 |
| B | 35078 | 31666 | 32 | 32 | 0.09% | 0.10% | 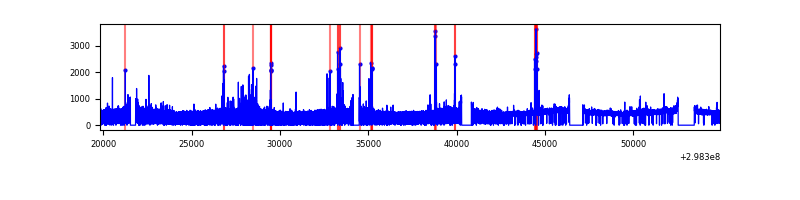 |
| C | 35078 | 31707 | 535 | 535 | 1.53% | 1.69% | 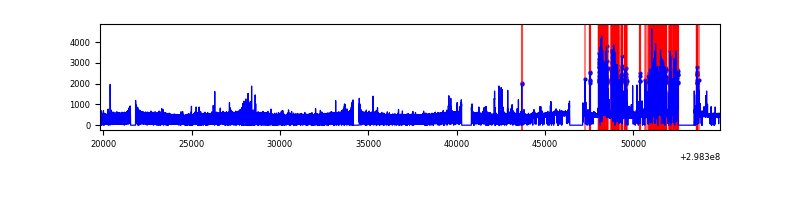 |
| D | 35078 | 31637 | 704 | 704 | 2.01% | 2.23% | 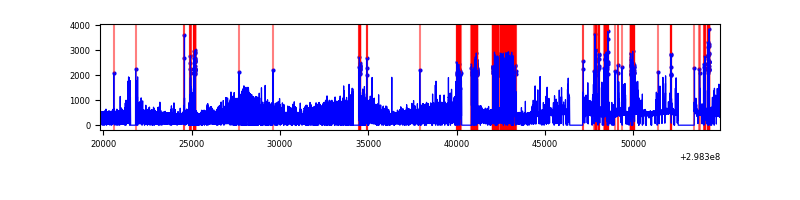 |
Top three noisy pixels from each quadrant. If the there are fewer than three noisy pixels in the level2.evt file, extra rows are filled as -1
| Pixel properties | Quadrant properties | ||||||
|---|---|---|---|---|---|---|---|
| Quadrant | DetID | PixID | Counts | Sigma | Mean | Median | Sigma |
| A | 14 | 238 | 462378 | 630.74 | 3624 | 3557 | 727.4 |
| A | 4 | 2 | 335805 | 456.74 | 3624 | 3557 | 727.4 |
| A | 13 | 254 | 34885 | 43.07 | 3624 | 3557 | 727.4 |
| B | 4 | 80 | 154171 | 220.61 | 3597 | 3513 | 682.9 |
| B | 0 | 183 | 106963 | 151.48 | 3597 | 3513 | 682.9 |
| B | 12 | 111 | 83090 | 116.52 | 3597 | 3513 | 682.9 |
| C | 4 | 254 | 2632468 | 3291.42 | 3414 | 3446 | 798.7 |
| C | 14 | 238 | 535293 | 665.85 | 3414 | 3446 | 798.7 |
| C | 13 | 61 | 23738 | 25.4 | 3414 | 3446 | 798.7 |
| D | 1 | 52 | 3909458 | 4690.67 | 3449 | 3358 | 832.7 |
| D | 7 | 238 | 818913 | 979.36 | 3449 | 3358 | 832.7 |
| D | 12 | 218 | 476082 | 567.67 | 3449 | 3358 | 832.7 |
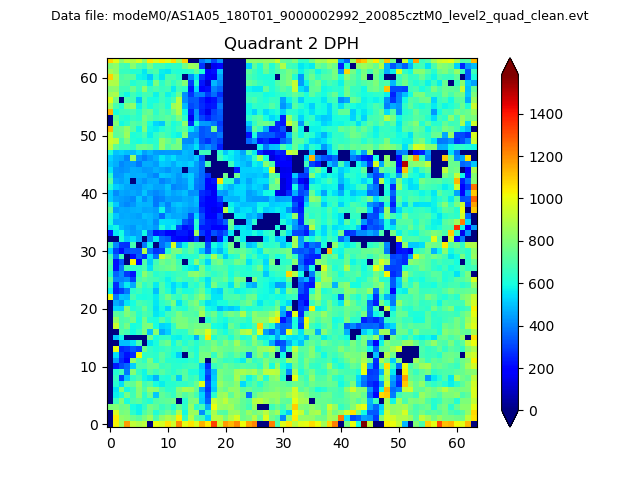
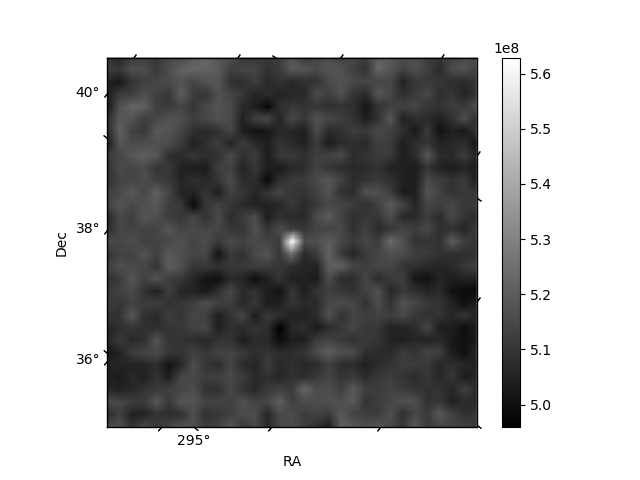
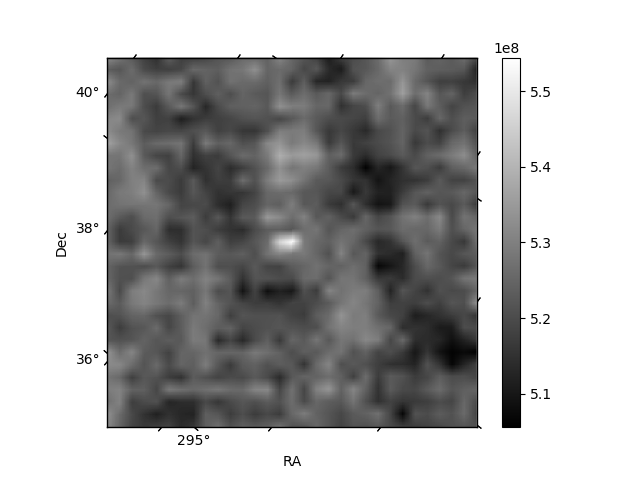
Histogram calculated using DETX and DETY for each event in the final _common_clean file
| Quadrant A | 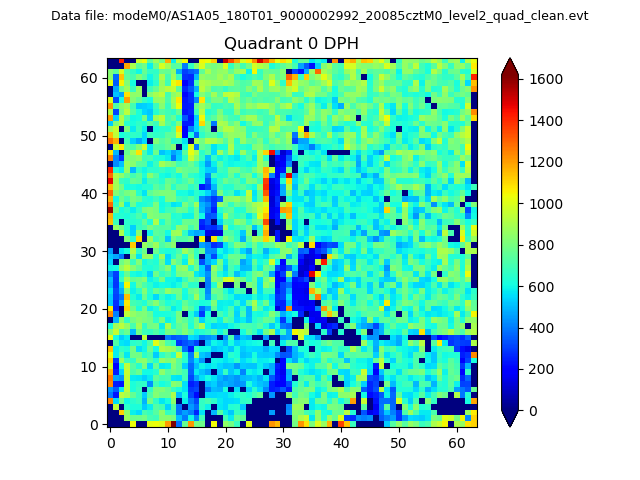 |
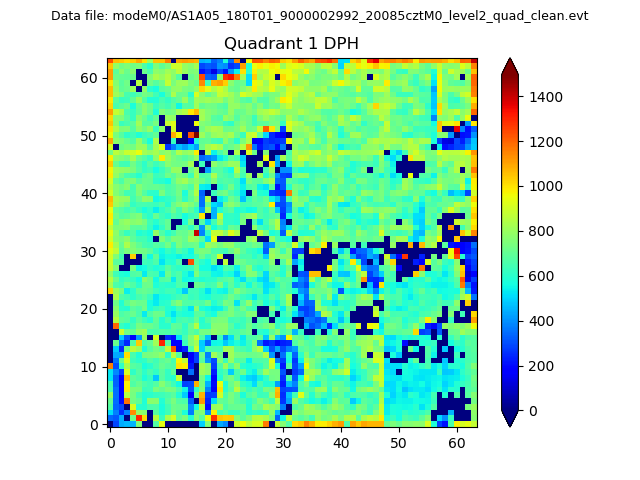 |
Quadrant B |
|---|---|---|---|
| Quadrant D | 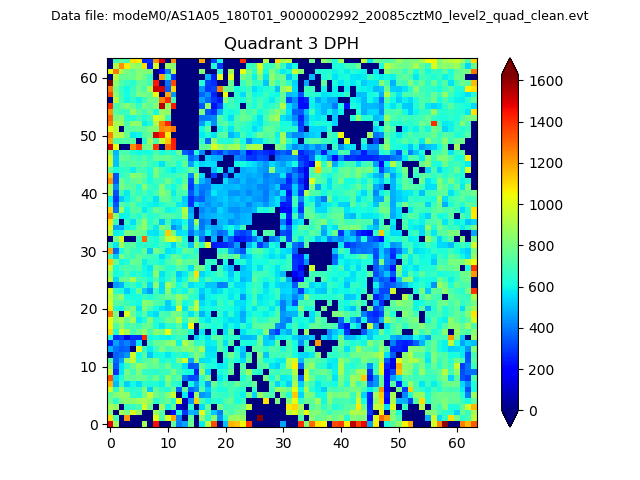 |
 |
Quadrant C |
| Plot type | Count rate plots | Images |
|---|---|---|
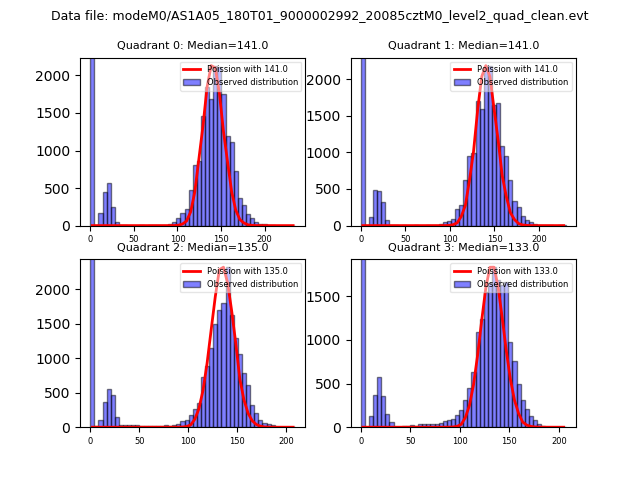
| Comparison with Poisson distribution Blue bars denote a histogram of data divided into 1 sec bins. Red curve is a Poisson curve with rate = median count rate of data. |
 |
 |
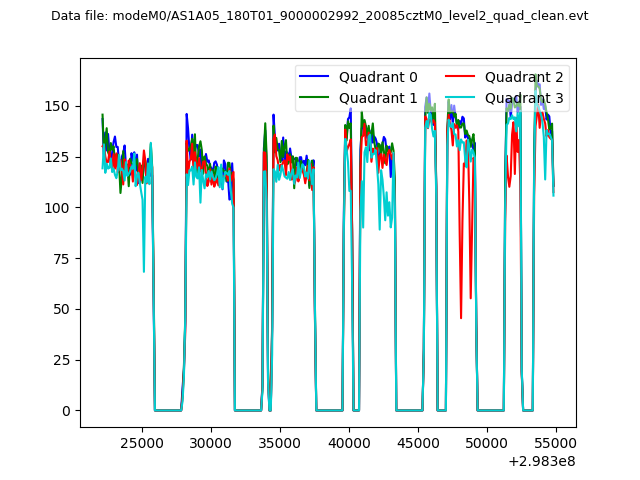
| Quadrant-wise count rates Data is divided into 100 sec bins |
 |
|
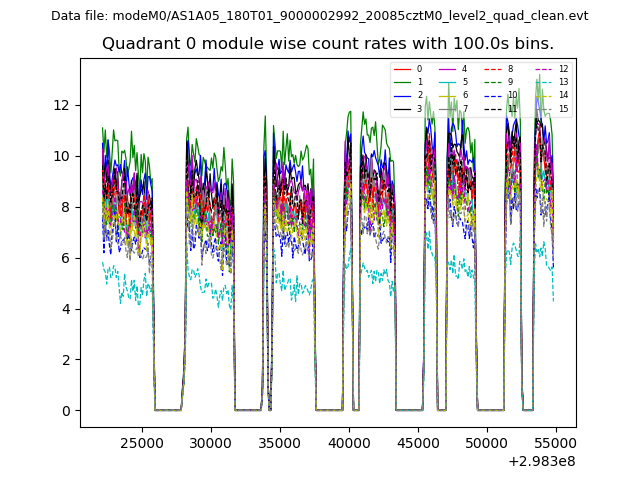
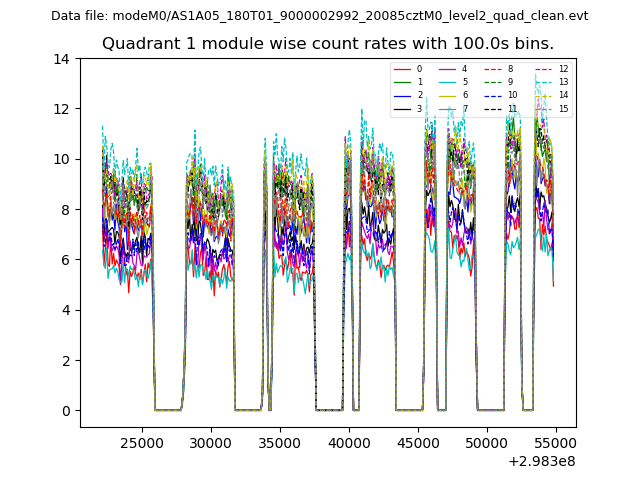
| Module-wise count rates for Quadrant A Data is divided into 100 sec bins |
 |
 |
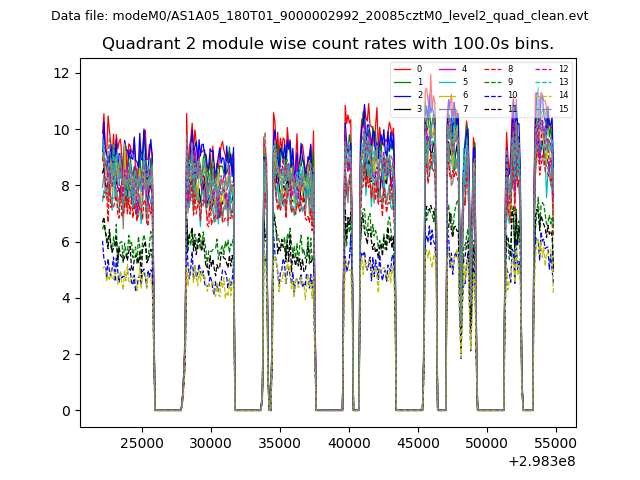
| Module-wise count rates for Quadrant B Data is divided into 100 sec bins |
 |
 |
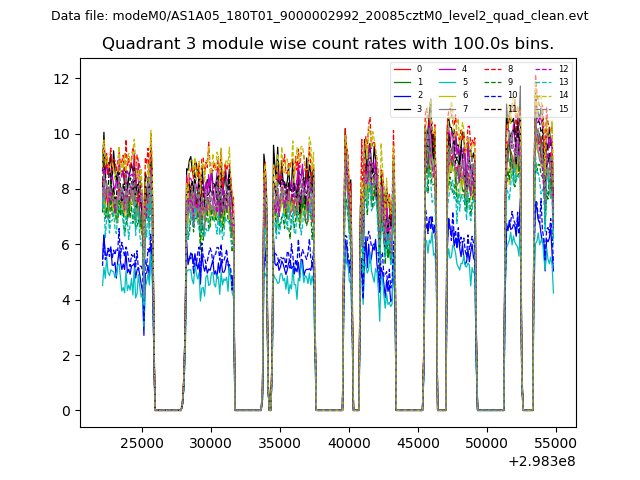
| Module-wise count rates for Quadrant C Data is divided into 100 sec bins |
 |
 |
| Module-wise count rates for Quadrant D Data is divided into 100 sec bins |
 |
 |
| Parameter | Plot |
|---|---|
| CZT HV Monitor | 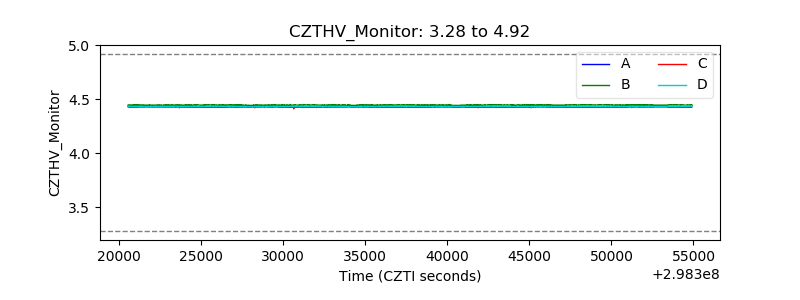 |
| D_VDD | 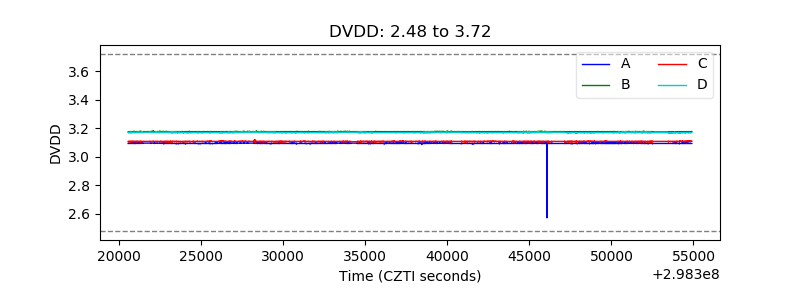 |
| Temperature 1 | 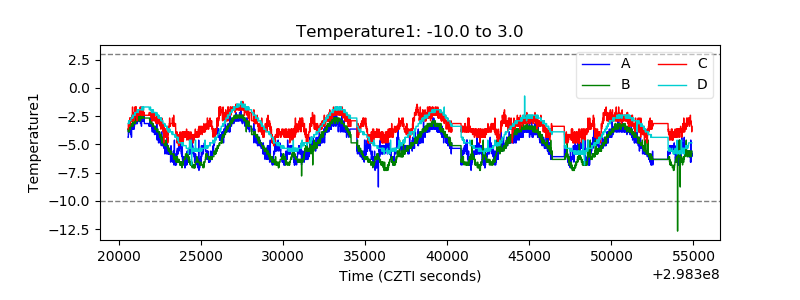 |
| Veto HV Monitor | 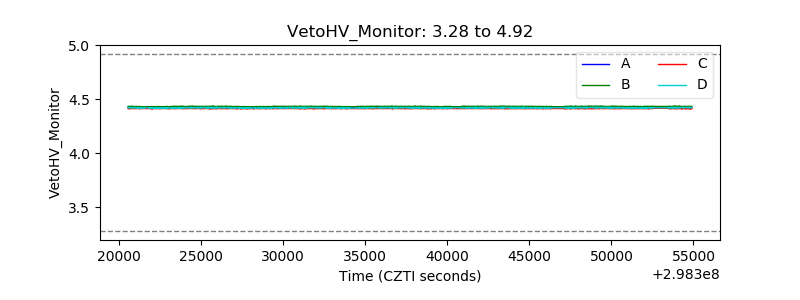 |
| Veto LLD | 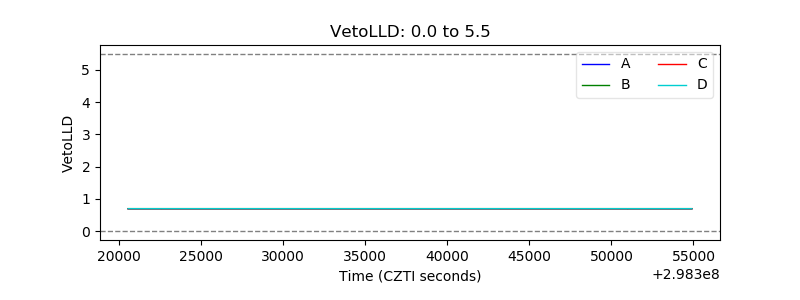 |
| Alpha Counter | 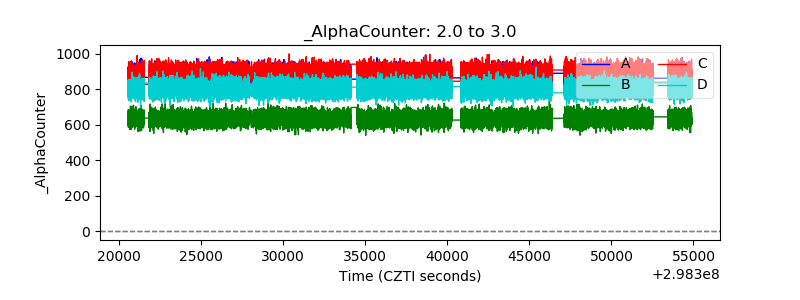 |
| _CPM_Rate | 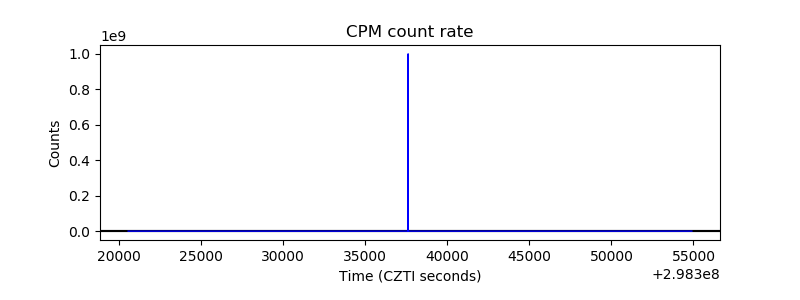 |
| CZT Counter | 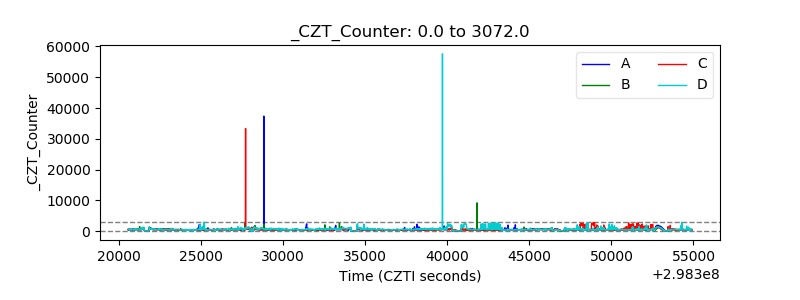 |
| +2.5 Volts monitor |  |
| +5 Volts monitor |  |
| _ROLL_ROT | 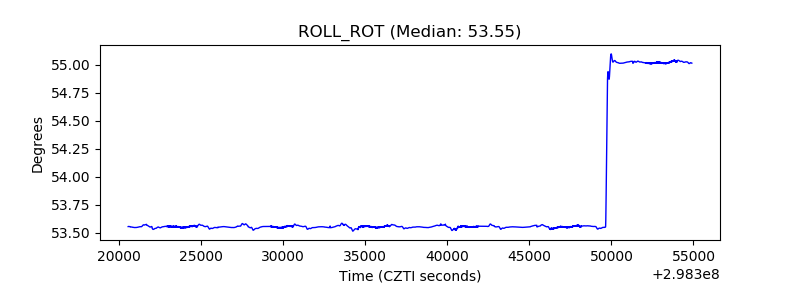 |
| _Roll_DEC | 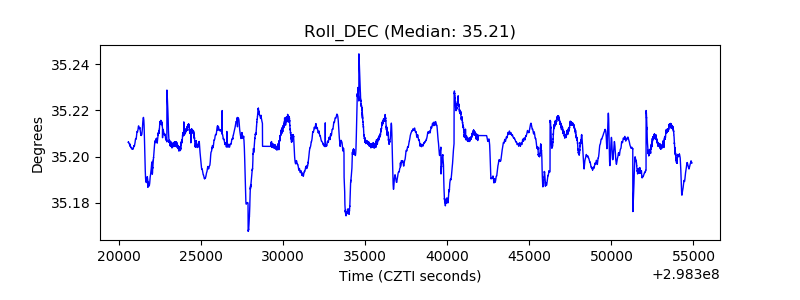 |
| _Roll_RA | 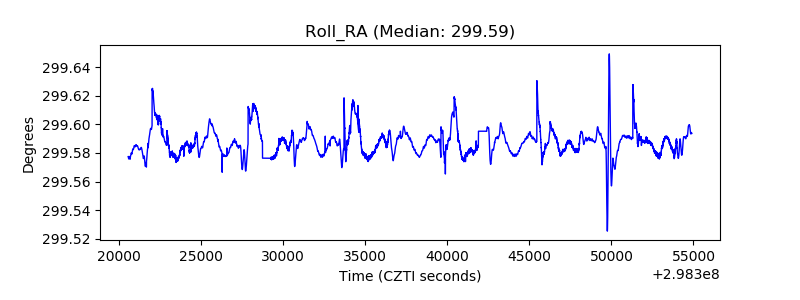 |
| Veto Counter | 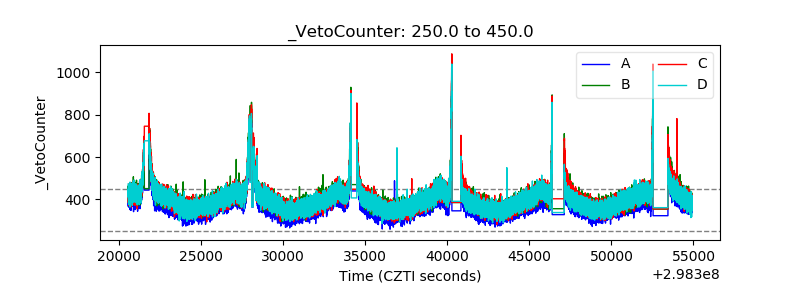 |