| Param | Original file | Final file |
|---|---|---|
| Filename | modeM0/AS1A05_180T01_9000002992_20086cztM0_level2.evt | modeM0/AS1A05_180T01_9000002992_20086cztM0_level2_quad_clean.evt |
| Size (bytes) | 405,362,880 | 86,273,280 |
| Size | 386.6 MB | 82.3 MB |
| Events in quadrant A | 2,981,883 | 567,043 |
| Events in quadrant B | 2,882,001 | 568,346 |
| Events in quadrant C | 2,824,103 | 540,793 |
| Events in quadrant D | 3,196,048 | 533,084 |
| Mode M9 | |||
|---|---|---|---|
| Quadrant | BADHDUFLAG | Total packets | Discarded packets |
| A | 0 | 11 | 0 |
| B | 0 | 11 | 0 |
| C | 0 | 11 | 0 |
| D | 0 | 11 | 0 |
| Mode M0 | |||
|---|---|---|---|
| Quadrant | BADHDUFLAG | Total packets | Discarded packets |
| A | 0 | 12415 | 1 |
| B | 0 | 12032 | 1 |
| C | 0 | 11939 | 1 |
| D | 0 | 13228 | 1 |
| Mode SS | |||
|---|---|---|---|
| Quadrant | BADHDUFLAG | Total packets | Discarded packets |
| A | 0 | 116 | 0 |
| B | 0 | 116 | 0 |
| C | 0 | 116 | 0 |
| D | 0 | 116 | 0 |
| Quadrant | Total seconds | Saturated seconds | Saturation percentage |
|---|---|---|---|
| A | 5774 | 64 | 1.108417% |
| B | 5775 | 52 | 0.900433% |
| C | 5775 | 63 | 1.090909% |
| D | 5775 | 107 | 1.852814% |
Noise dominated data is calculated using 1-second bins in cleaned event files. If a bin has >2000 counts, and if more than 50% of those come from <1% of pixels, then it is considered to be noise-dominated and hence unusable.
| Quadrant | # 1 sec bins | Bins with >0 counts | Bins with >2000 counts | High rate bins dominated by noise | Noise dominated (total time) | Noise dominated (detector-on time) | Marked lightcurve |
|---|---|---|---|---|---|---|---|
| A | 6824 | 5775 | 20 | 20 | 0.29% | 0.35% | 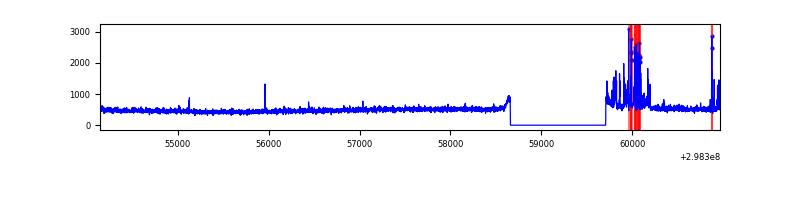 |
| B | 6825 | 5776 | 5 | 5 | 0.07% | 0.09% | 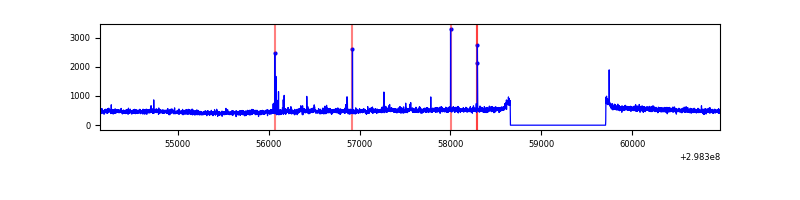 |
| C | 6825 | 5776 | 1 | 1 | 0.01% | 0.02% | 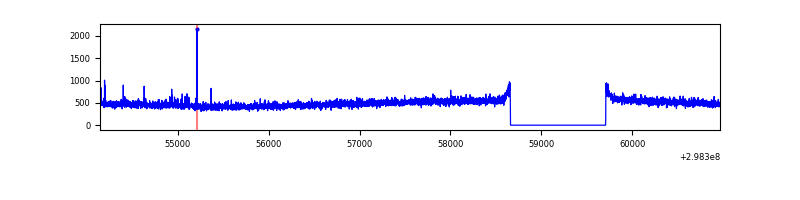 |
| D | 6825 | 5776 | 62 | 62 | 0.91% | 1.07% |  |
Top three noisy pixels from each quadrant. If the there are fewer than three noisy pixels in the level2.evt file, extra rows are filled as -1
| Pixel properties | Quadrant properties | ||||||
|---|---|---|---|---|---|---|---|
| Quadrant | DetID | PixID | Counts | Sigma | Mean | Median | Sigma |
| A | 4 | 2 | 151942 | 1032.85 | 728 | 715 | 146.4 |
| A | 14 | 238 | 7912 | 49.15 | 728 | 715 | 146.4 |
| A | 12 | 16 | 7668 | 47.49 | 728 | 715 | 146.4 |
| B | 4 | 80 | 23939 | 167.31 | 720 | 702 | 138.9 |
| B | 12 | 111 | 16437 | 113.3 | 720 | 702 | 138.9 |
| B | 11 | 111 | 14656 | 100.47 | 720 | 702 | 138.9 |
| C | 14 | 238 | 109744 | 675.04 | 689 | 696 | 161.5 |
| C | 4 | 254 | 26596 | 160.33 | 689 | 696 | 161.5 |
| C | 13 | 61 | 4914 | 26.11 | 689 | 696 | 161.5 |
| D | 1 | 52 | 482019 | 2817.62 | 701 | 682 | 170.8 |
| D | 13 | 249 | 31004 | 177.5 | 701 | 682 | 170.8 |
| D | 2 | 234 | 26971 | 153.89 | 701 | 682 | 170.8 |
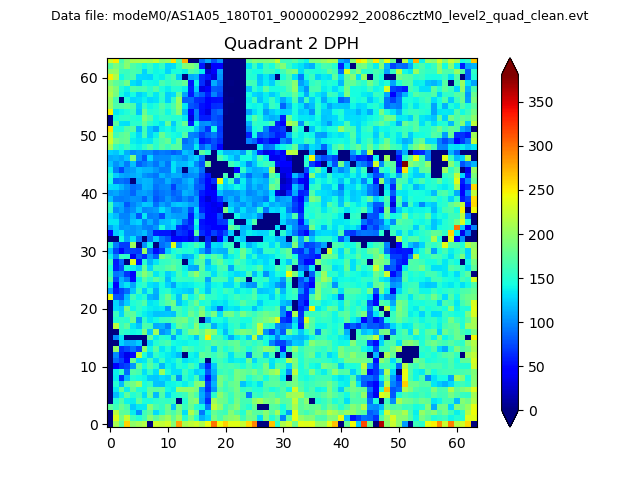
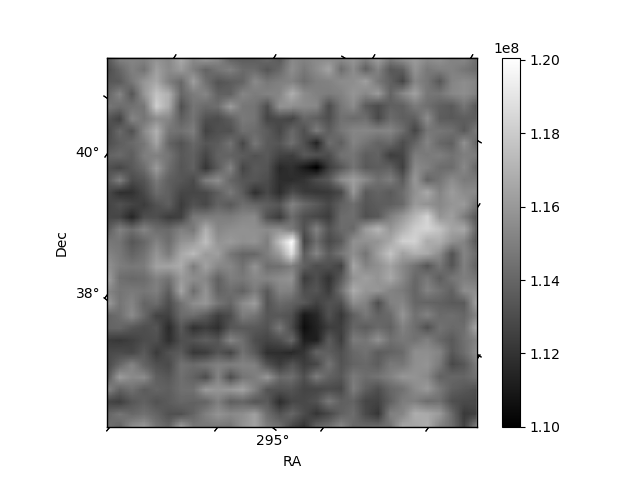
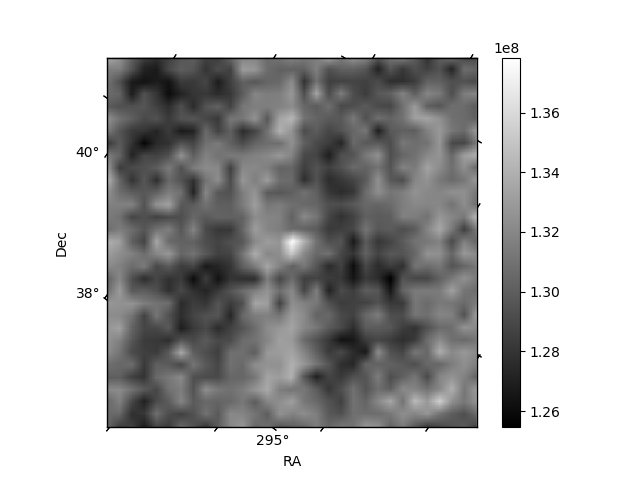
Histogram calculated using DETX and DETY for each event in the final _common_clean file
| Quadrant A | 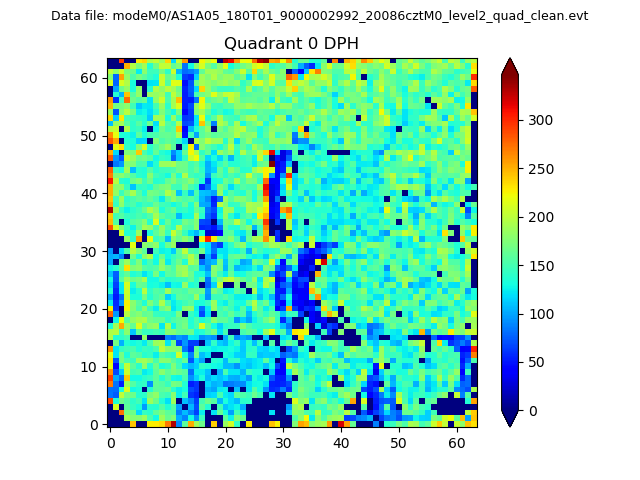 |
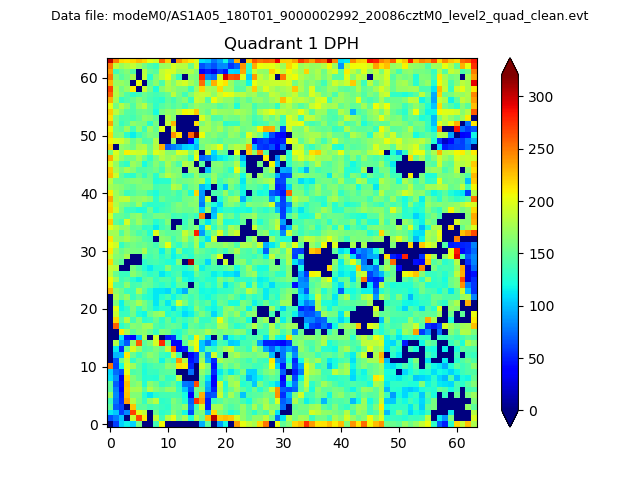 |
Quadrant B |
|---|---|---|---|
| Quadrant D | 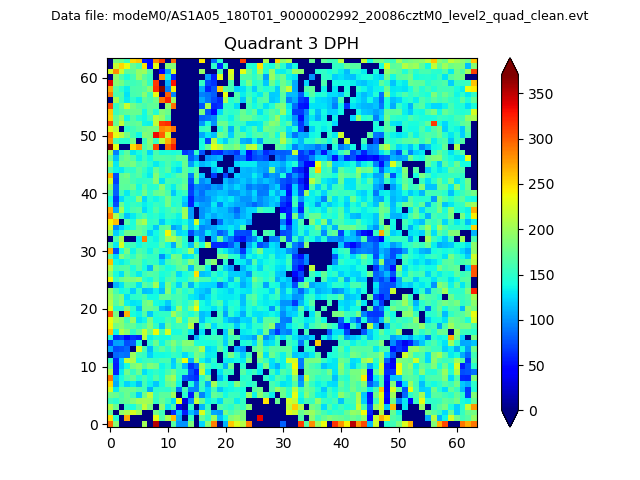 |
 |
Quadrant C |
| Plot type | Count rate plots | Images |
|---|---|---|
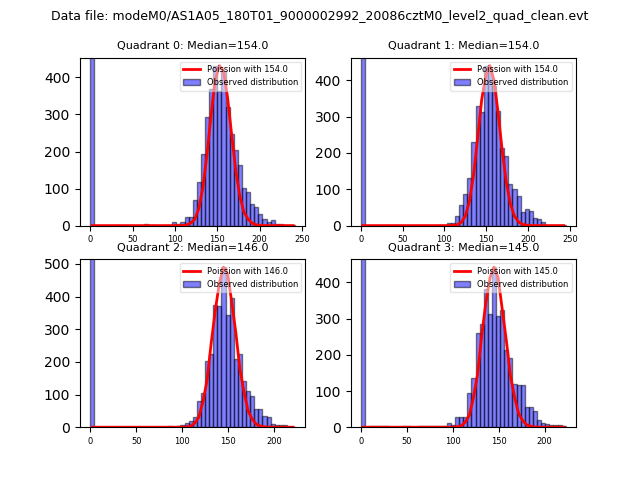
| Comparison with Poisson distribution Blue bars denote a histogram of data divided into 1 sec bins. Red curve is a Poisson curve with rate = median count rate of data. |
 |
 |
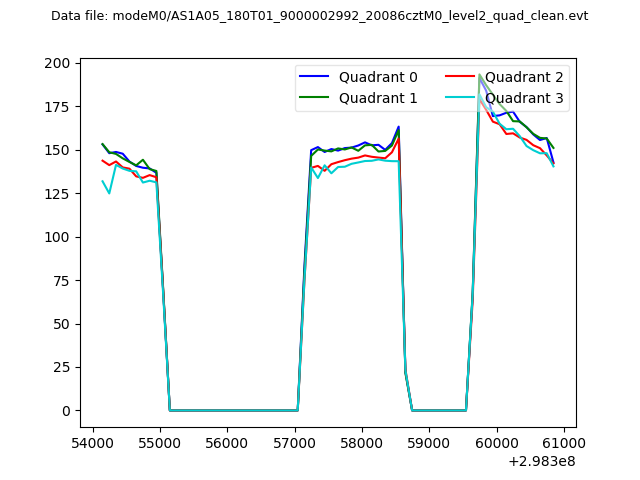
| Quadrant-wise count rates Data is divided into 100 sec bins |
 |
|
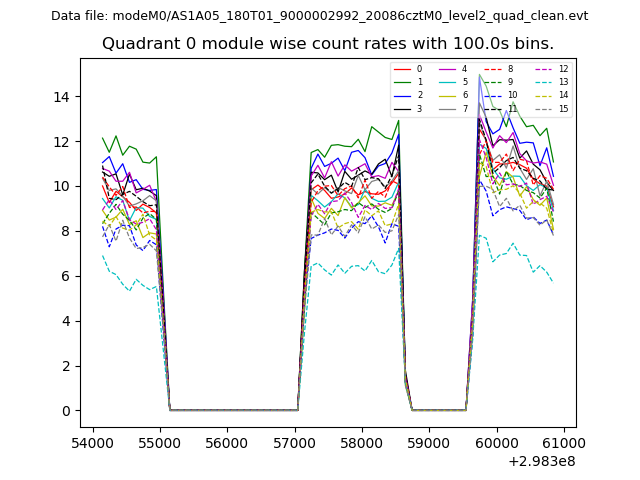
| Module-wise count rates for Quadrant A Data is divided into 100 sec bins |
 |
 |
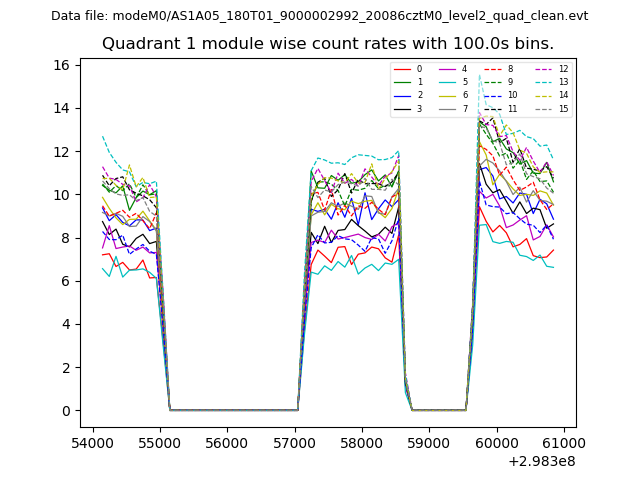
| Module-wise count rates for Quadrant B Data is divided into 100 sec bins |
 |
 |
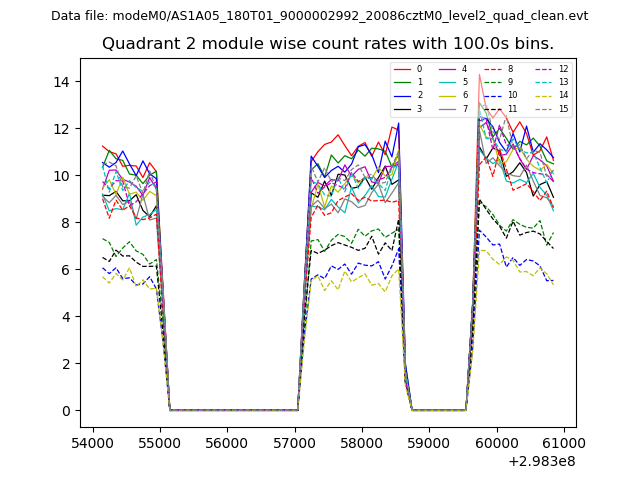
| Module-wise count rates for Quadrant C Data is divided into 100 sec bins |
 |
 |
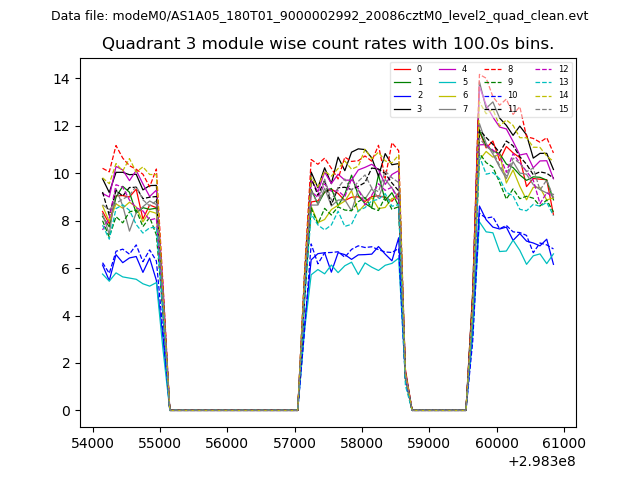
| Module-wise count rates for Quadrant D Data is divided into 100 sec bins |
 |
 |
| Parameter | Plot |
|---|---|
| CZT HV Monitor | 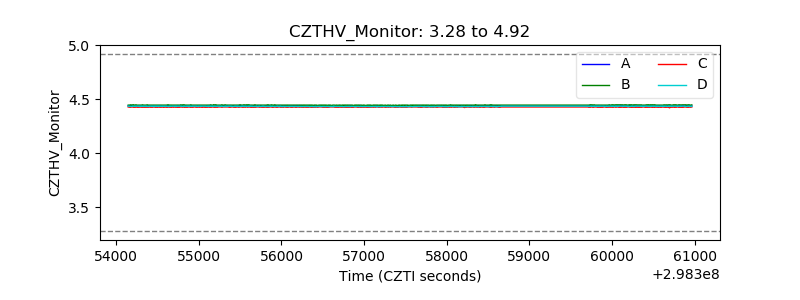 |
| D_VDD |  |
| Temperature 1 | 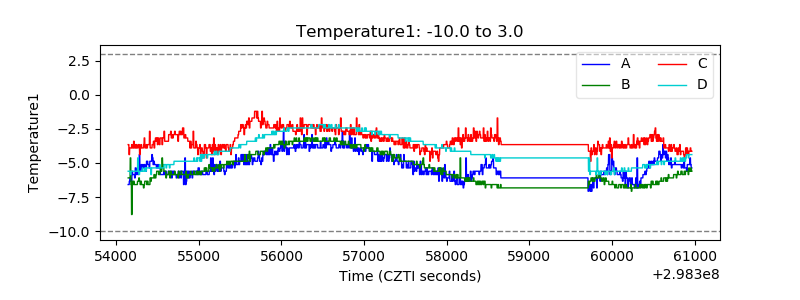 |
| Veto HV Monitor |  |
| Veto LLD | 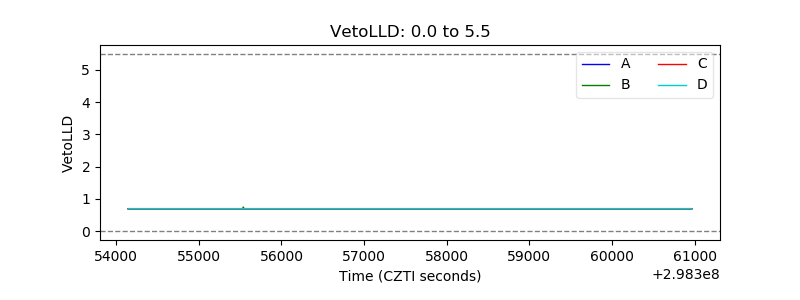 |
| Alpha Counter | 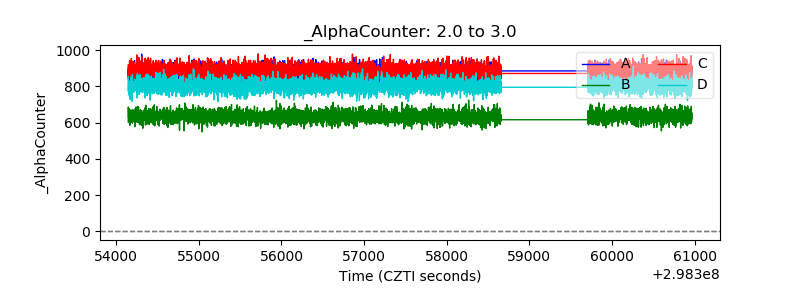 |
| _CPM_Rate | 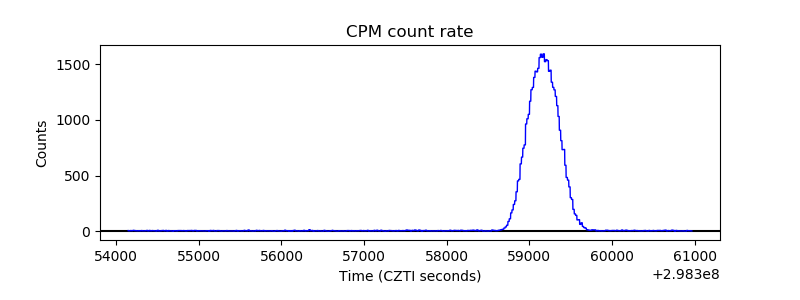 |
| CZT Counter | 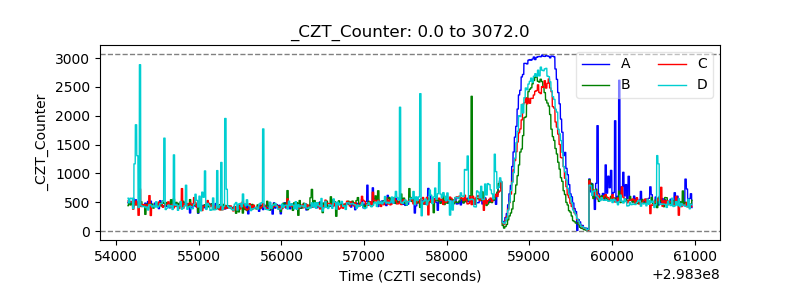 |
| +2.5 Volts monitor |  |
| +5 Volts monitor |  |
| _ROLL_ROT | 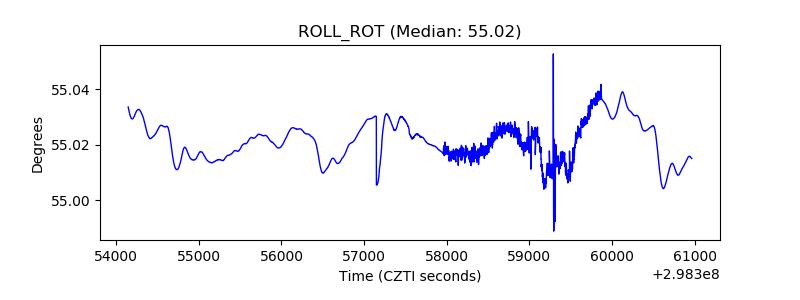 |
| _Roll_DEC | 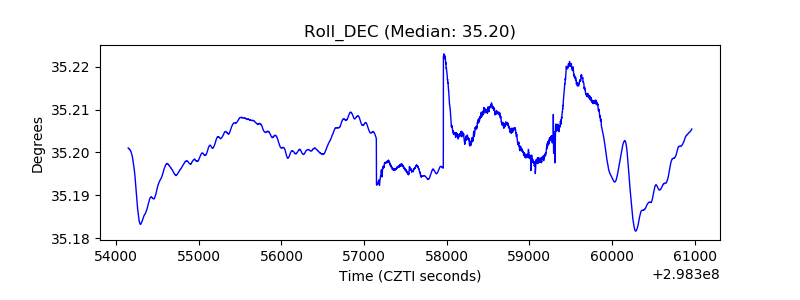 |
| _Roll_RA | 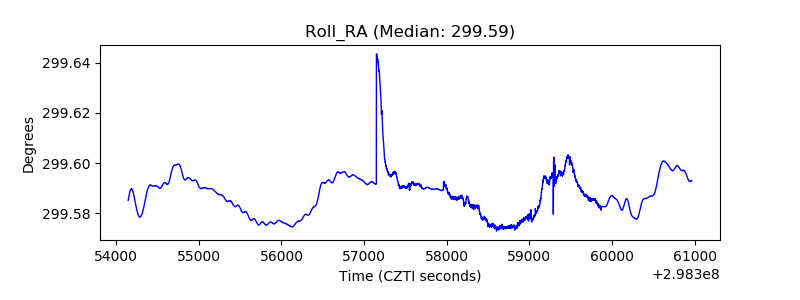 |
| Veto Counter | 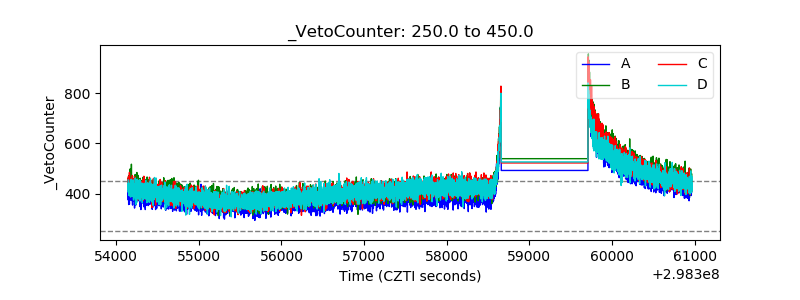 |