| Param | Original file | Final file |
|---|---|---|
| Filename | modeM0/AS1A05_180T01_9000002992_20088cztM0_level2.evt | modeM0/AS1A05_180T01_9000002992_20088cztM0_level2_quad_clean.evt |
| Size (bytes) | 453,487,680 | 90,587,520 |
| Size | 432.5 MB | 86.4 MB |
| Events in quadrant A | 3,546,749 | 590,647 |
| Events in quadrant B | 3,222,796 | 598,451 |
| Events in quadrant C | 3,131,420 | 563,581 |
| Events in quadrant D | 3,416,490 | 562,391 |
| Mode M9 | |||
|---|---|---|---|
| Quadrant | BADHDUFLAG | Total packets | Discarded packets |
| A | 0 | 11 | 0 |
| B | 0 | 11 | 0 |
| C | 0 | 11 | 0 |
| D | 0 | 11 | 0 |
| Mode M0 | |||
|---|---|---|---|
| Quadrant | BADHDUFLAG | Total packets | Discarded packets |
| A | 0 | 14233 | 2 |
| B | 0 | 13179 | 1 |
| C | 0 | 12962 | 1 |
| D | 0 | 13970 | 1 |
| Mode SS | |||
|---|---|---|---|
| Quadrant | BADHDUFLAG | Total packets | Discarded packets |
| A | 0 | 126 | 0 |
| B | 0 | 126 | 0 |
| C | 0 | 126 | 0 |
| D | 0 | 126 | 0 |
| Quadrant | Total seconds | Saturated seconds | Saturation percentage |
|---|---|---|---|
| A | 6127 | 189 | 3.084707% |
| B | 6128 | 86 | 1.403394% |
| C | 6128 | 84 | 1.370757% |
| D | 6128 | 77 | 1.256527% |
Noise dominated data is calculated using 1-second bins in cleaned event files. If a bin has >2000 counts, and if more than 50% of those come from <1% of pixels, then it is considered to be noise-dominated and hence unusable.
| Quadrant | # 1 sec bins | Bins with >0 counts | Bins with >2000 counts | High rate bins dominated by noise | Noise dominated (total time) | Noise dominated (detector-on time) | Marked lightcurve |
|---|---|---|---|---|---|---|---|
| A | 7287 | 6128 | 79 | 79 | 1.08% | 1.29% | 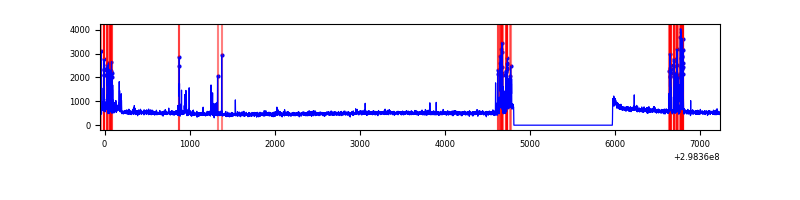 |
| B | 7288 | 6129 | 4 | 4 | 0.05% | 0.07% | 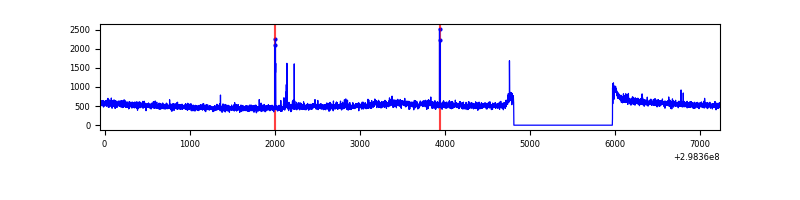 |
| C | 7288 | 6129 | 4 | 4 | 0.05% | 0.07% |  |
| D | 7288 | 6129 | 31 | 31 | 0.43% | 0.51% | 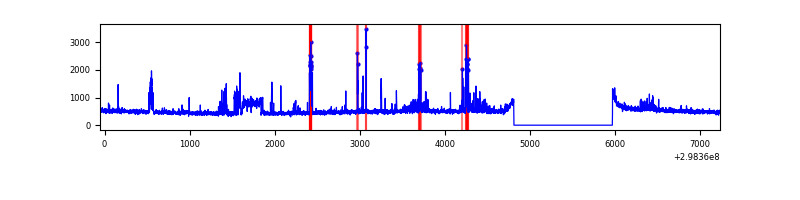 |
Top three noisy pixels from each quadrant. If the there are fewer than three noisy pixels in the level2.evt file, extra rows are filled as -1
| Pixel properties | Quadrant properties | ||||||
|---|---|---|---|---|---|---|---|
| Quadrant | DetID | PixID | Counts | Sigma | Mean | Median | Sigma |
| A | 14 | 238 | 259066 | 1595.21 | 808 | 794 | 161.9 |
| A | 4 | 2 | 137695 | 845.57 | 808 | 794 | 161.9 |
| A | 12 | 16 | 19694 | 116.73 | 808 | 794 | 161.9 |
| B | 0 | 198 | 53761 | 350.24 | 802 | 784 | 151.3 |
| B | 4 | 80 | 19129 | 121.28 | 802 | 784 | 151.3 |
| B | 12 | 111 | 17851 | 112.83 | 802 | 784 | 151.3 |
| C | 14 | 238 | 121720 | 679.07 | 766 | 775 | 178.1 |
| C | 4 | 254 | 25318 | 137.8 | 766 | 775 | 178.1 |
| C | 13 | 61 | 5333 | 25.59 | 766 | 775 | 178.1 |
| D | 12 | 218 | 276405 | 1463.95 | 784 | 766 | 188.3 |
| D | 1 | 52 | 169305 | 895.13 | 784 | 766 | 188.3 |
| D | 2 | 234 | 25899 | 133.48 | 784 | 766 | 188.3 |
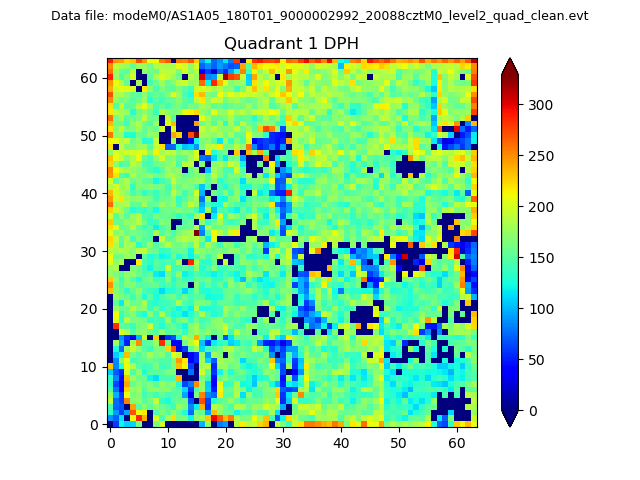
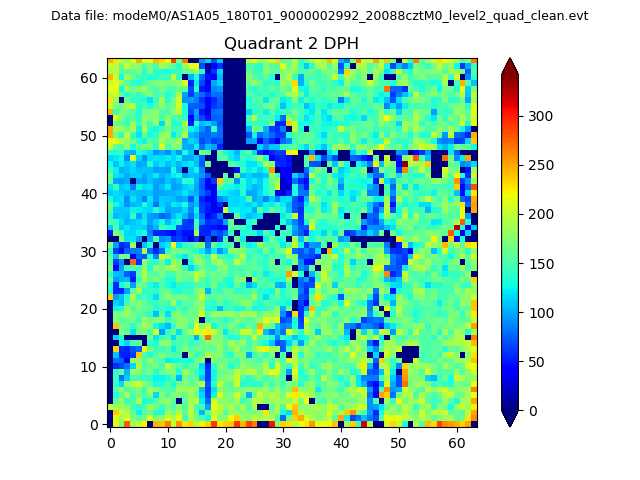
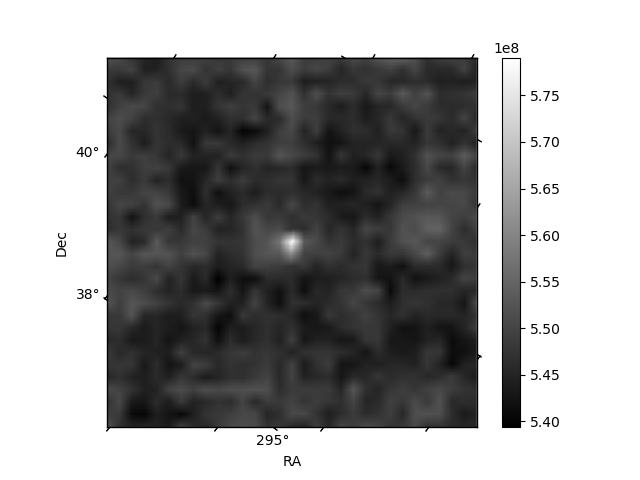
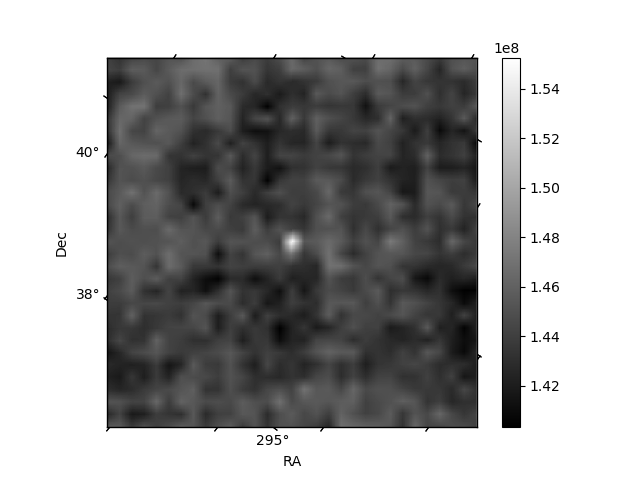
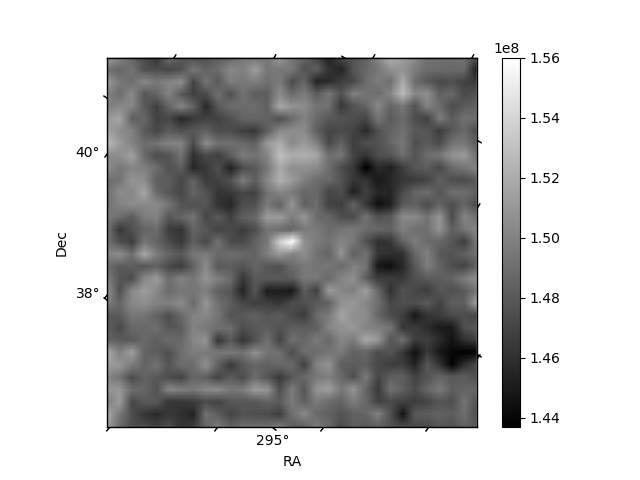
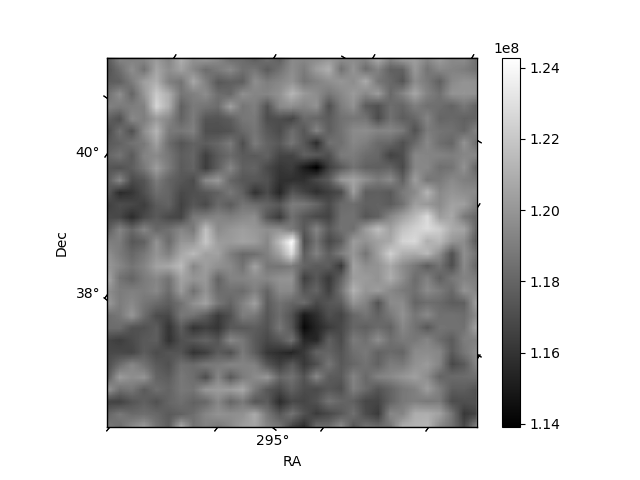
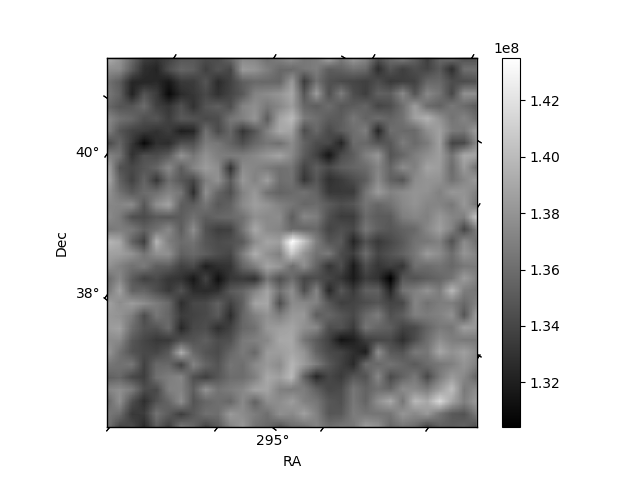
Histogram calculated using DETX and DETY for each event in the final _common_clean file
| Quadrant A | 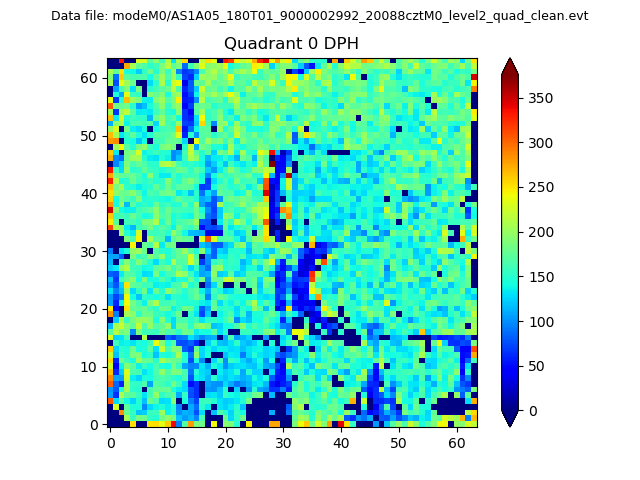 |
 |
Quadrant B |
|---|---|---|---|
| Quadrant D | 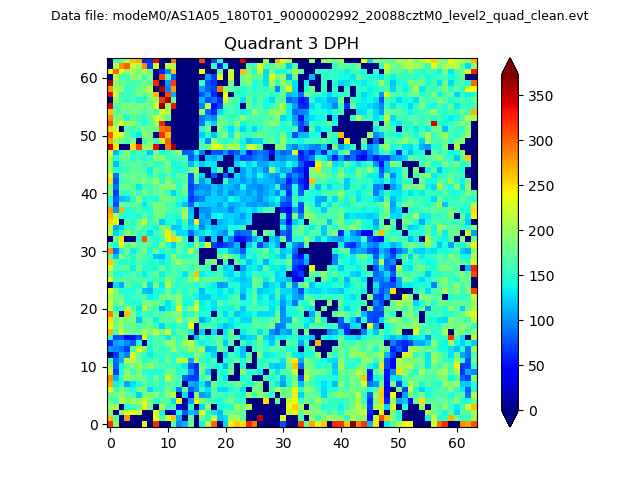 |
 |
Quadrant C |
| Plot type | Count rate plots | Images |
|---|---|---|
| Comparison with Poisson distribution Blue bars denote a histogram of data divided into 1 sec bins. Red curve is a Poisson curve with rate = median count rate of data. |
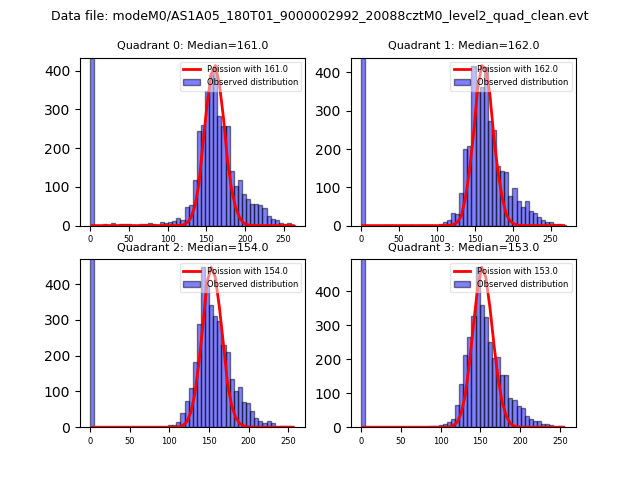 |
 |
| Quadrant-wise count rates Data is divided into 100 sec bins |
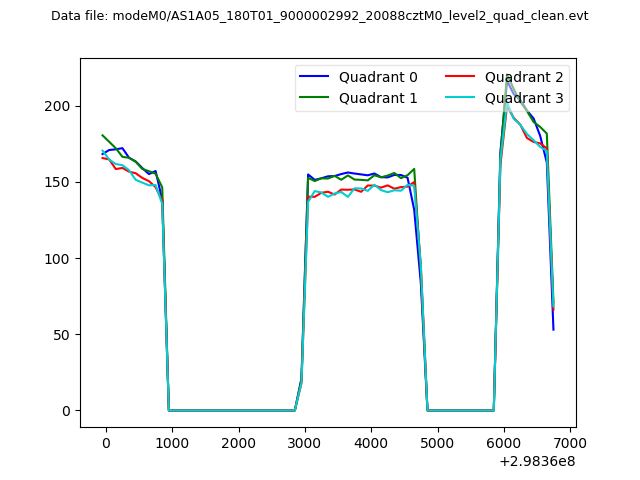 |
|
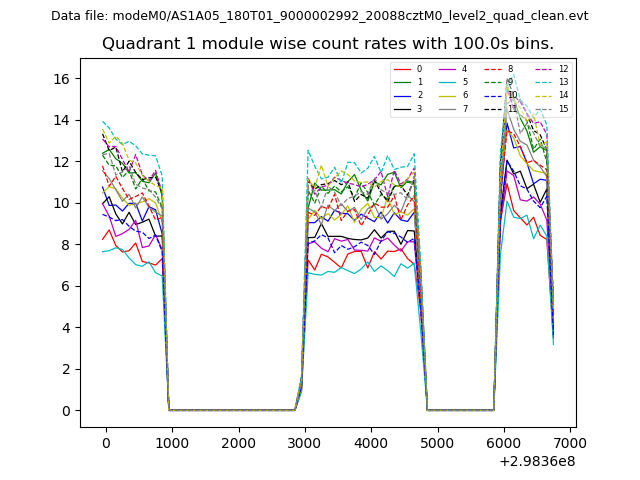
| Module-wise count rates for Quadrant A Data is divided into 100 sec bins |
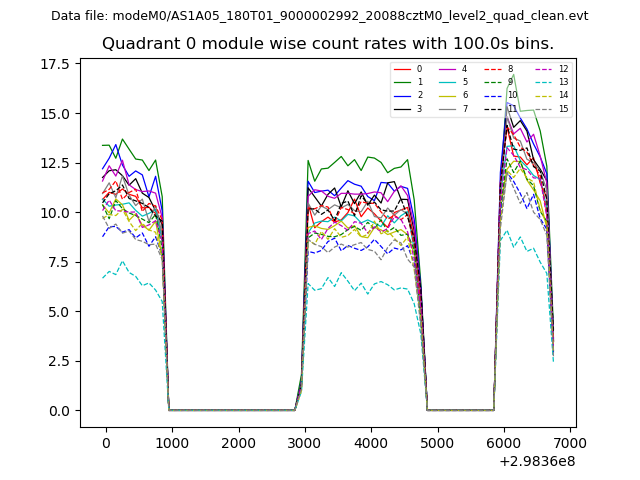 |
 |
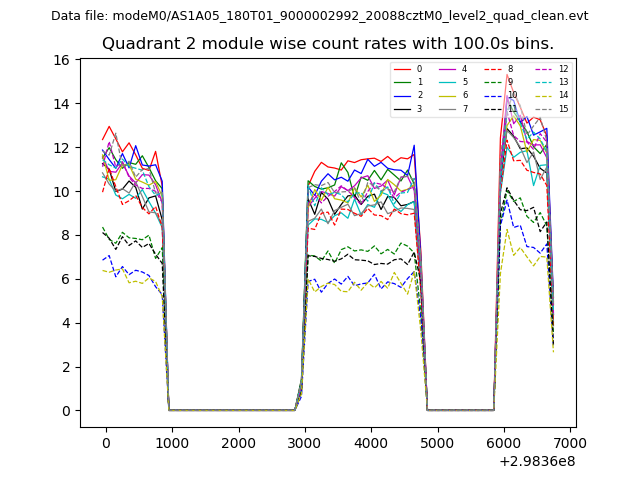
| Module-wise count rates for Quadrant B Data is divided into 100 sec bins |
 |
 |
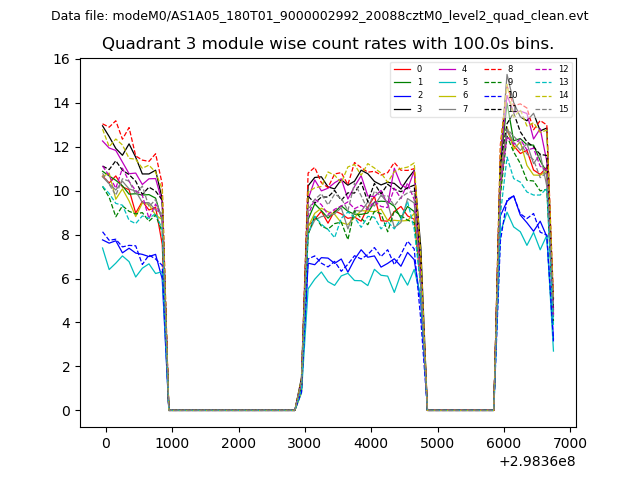
| Module-wise count rates for Quadrant C Data is divided into 100 sec bins |
 |
 |
| Module-wise count rates for Quadrant D Data is divided into 100 sec bins |
 |
 |
| Parameter | Plot |
|---|---|
| CZT HV Monitor | 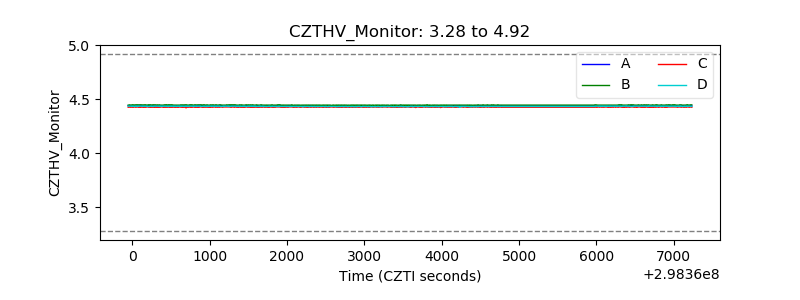 |
| D_VDD | 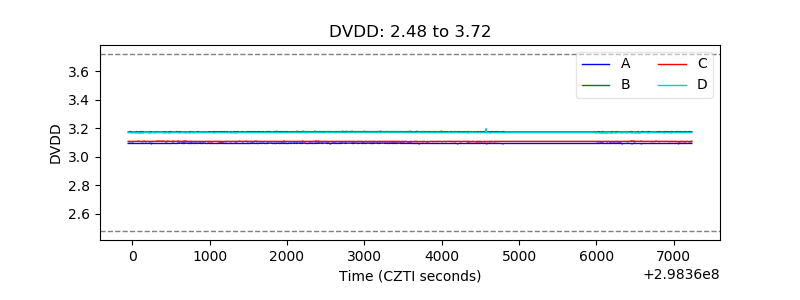 |
| Temperature 1 |  |
| Veto HV Monitor | 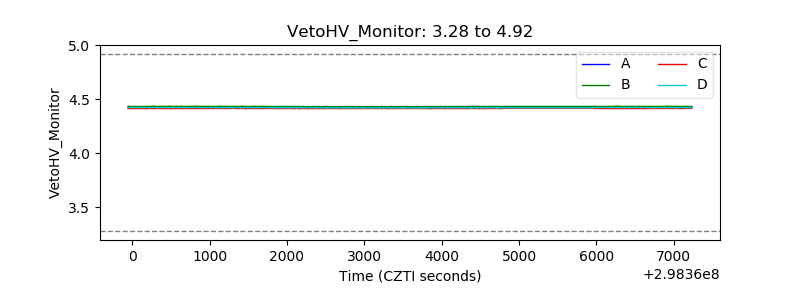 |
| Veto LLD | 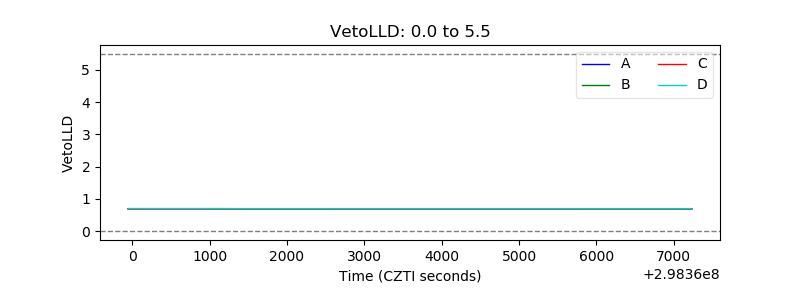 |
| Alpha Counter | 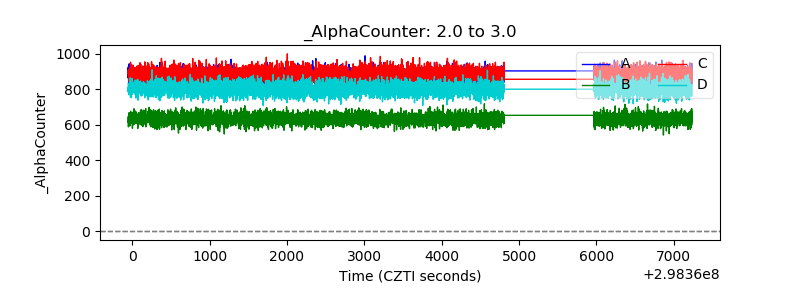 |
| _CPM_Rate |  |
| CZT Counter | 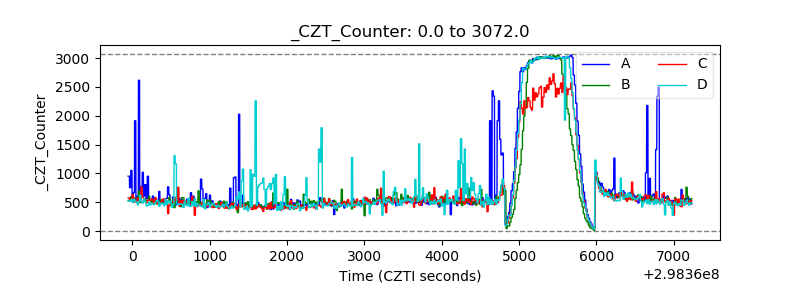 |
| +2.5 Volts monitor |  |
| +5 Volts monitor | 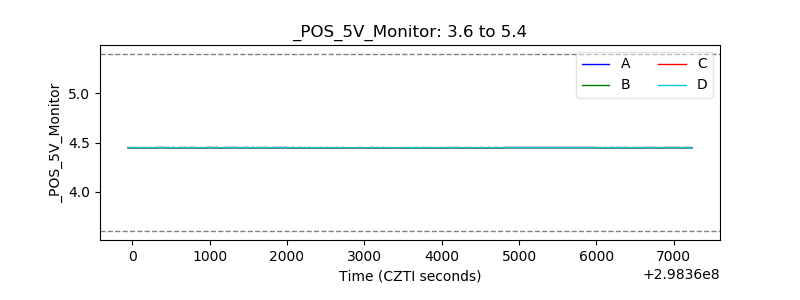 |
| _ROLL_ROT | 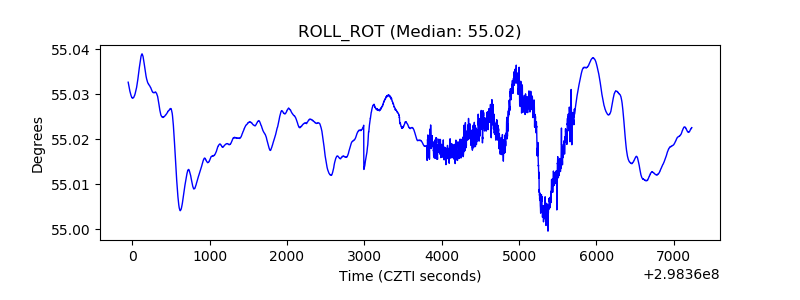 |
| _Roll_DEC | 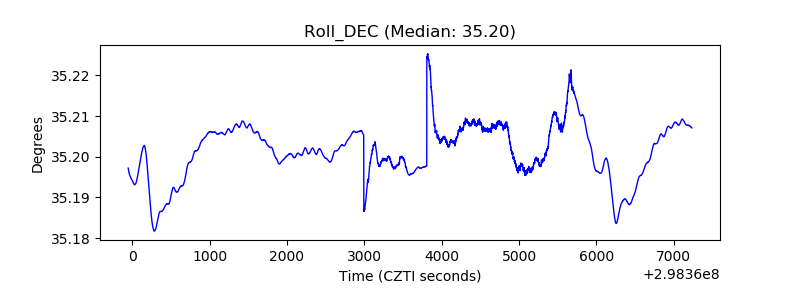 |
| _Roll_RA | 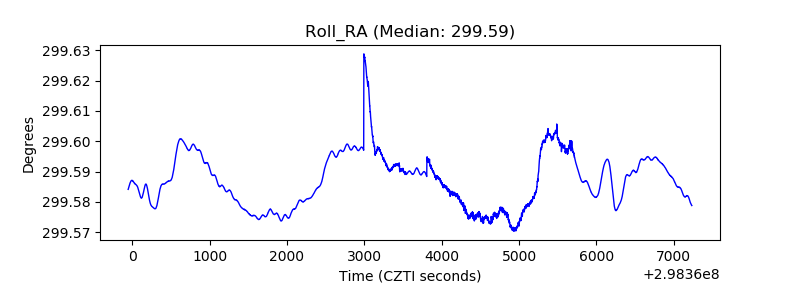 |
| Veto Counter | 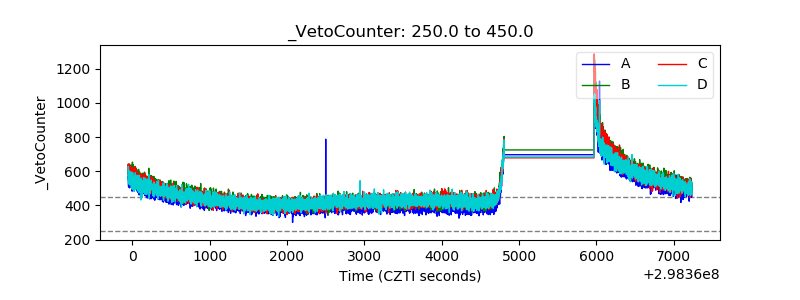 |