| Param | Original file | Final file |
|---|---|---|
| Filename | modeM0/AS1A05_180T01_9000002992_20089cztM0_level2.evt | modeM0/AS1A05_180T01_9000002992_20089cztM0_level2_quad_clean.evt |
| Size (bytes) | 430,698,240 | 77,057,280 |
| Size | 410.7 MB | 73.5 MB |
| Events in quadrant A | 3,288,591 | 495,386 |
| Events in quadrant B | 3,115,229 | 505,682 |
| Events in quadrant C | 3,168,229 | 467,278 |
| Events in quadrant D | 3,090,434 | 473,872 |
| Mode M9 | |||
|---|---|---|---|
| Quadrant | BADHDUFLAG | Total packets | Discarded packets |
| A | 0 | 15 | 1 |
| B | 0 | 16 | 2 |
| C | 0 | 16 | 2 |
| D | 0 | 17 | 1 |
| Mode M0 | |||
|---|---|---|---|
| Quadrant | BADHDUFLAG | Total packets | Discarded packets |
| A | 0 | 15312 | 2150 |
| B | 0 | 14375 | 1833 |
| C | 0 | 14724 | 2002 |
| D | 0 | 14527 | 1953 |
| Mode SS | |||
|---|---|---|---|
| Quadrant | BADHDUFLAG | Total packets | Discarded packets |
| A | 0 | 130 | 12 |
| B | 0 | 130 | 8 |
| C | 0 | 129 | 19 |
| D | 0 | 128 | 16 |
| Quadrant | Total seconds | Saturated seconds | Saturation percentage |
|---|---|---|---|
| A | 5564 | 154 | 2.767793% |
| B | 5590 | 106 | 1.896243% |
| C | 5565 | 119 | 2.138365% |
| D | 5577 | 77 | 1.380671% |
Noise dominated data is calculated using 1-second bins in cleaned event files. If a bin has >2000 counts, and if more than 50% of those come from <1% of pixels, then it is considered to be noise-dominated and hence unusable.
| Quadrant | # 1 sec bins | Bins with >0 counts | Bins with >2000 counts | High rate bins dominated by noise | Noise dominated (total time) | Noise dominated (detector-on time) | Marked lightcurve |
|---|---|---|---|---|---|---|---|
| A | 7684 | 6314 | 32 | 32 | 0.42% | 0.51% | 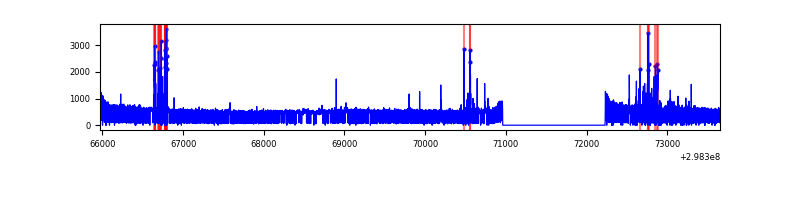 |
| B | 7684 | 6332 | 7 | 7 | 0.09% | 0.11% | 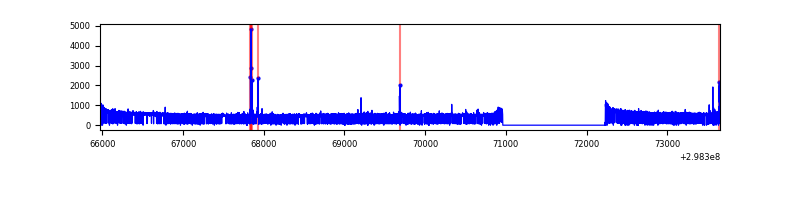 |
| C | 7684 | 6326 | 13 | 13 | 0.17% | 0.21% | 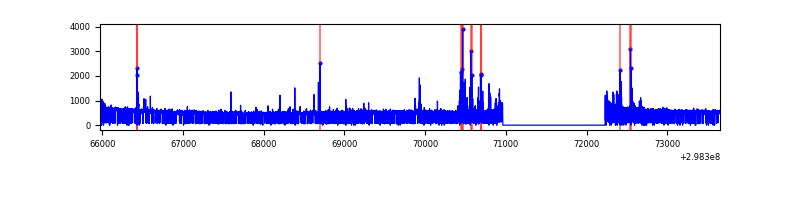 |
| D | 7683 | 6341 | 11 | 11 | 0.14% | 0.17% | 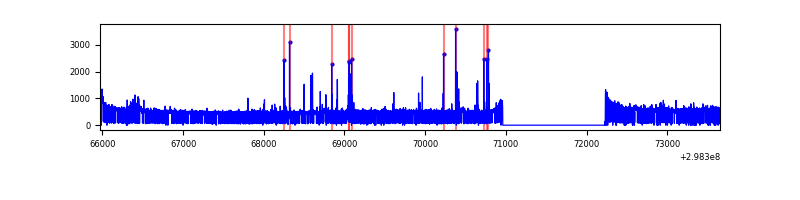 |
Top three noisy pixels from each quadrant. If the there are fewer than three noisy pixels in the level2.evt file, extra rows are filled as -1
| Pixel properties | Quadrant properties | ||||||
|---|---|---|---|---|---|---|---|
| Quadrant | DetID | PixID | Counts | Sigma | Mean | Median | Sigma |
| A | 14 | 238 | 191972 | 1228.8 | 786 | 773 | 155.6 |
| A | 12 | 16 | 28870 | 180.57 | 786 | 773 | 155.6 |
| A | 4 | 2 | 21944 | 136.06 | 786 | 773 | 155.6 |
| B | 4 | 80 | 34728 | 235.3 | 778 | 761 | 144.4 |
| B | 12 | 111 | 16914 | 111.9 | 778 | 761 | 144.4 |
| B | 0 | 214 | 16554 | 109.4 | 778 | 761 | 144.4 |
| C | 4 | 254 | 185723 | 1092.49 | 735 | 746 | 169.3 |
| C | 14 | 238 | 116153 | 681.6 | 735 | 746 | 169.3 |
| C | 13 | 61 | 5120 | 25.83 | 735 | 746 | 169.3 |
| D | 1 | 52 | 152263 | 835.72 | 760 | 742 | 181.3 |
| D | 13 | 249 | 39764 | 215.23 | 760 | 742 | 181.3 |
| D | 2 | 234 | 25057 | 134.11 | 760 | 742 | 181.3 |
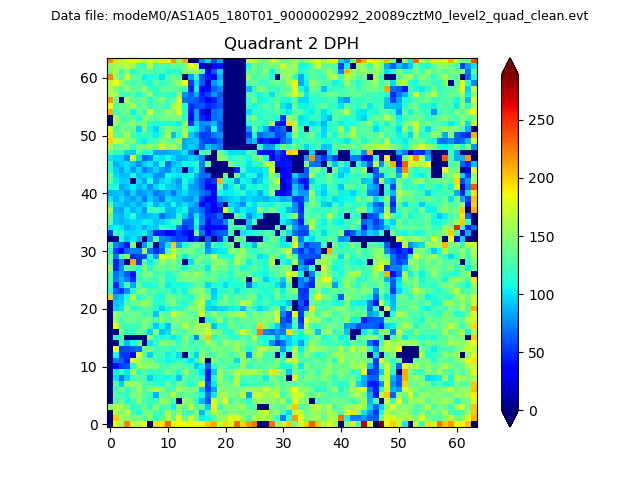
Histogram calculated using DETX and DETY for each event in the final _common_clean file
| Quadrant A | 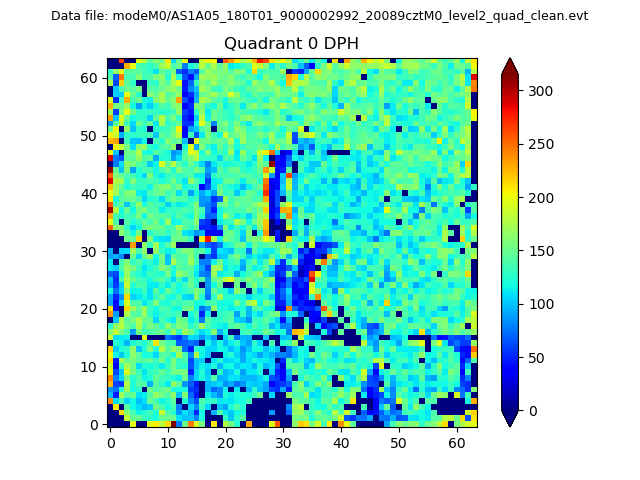 |
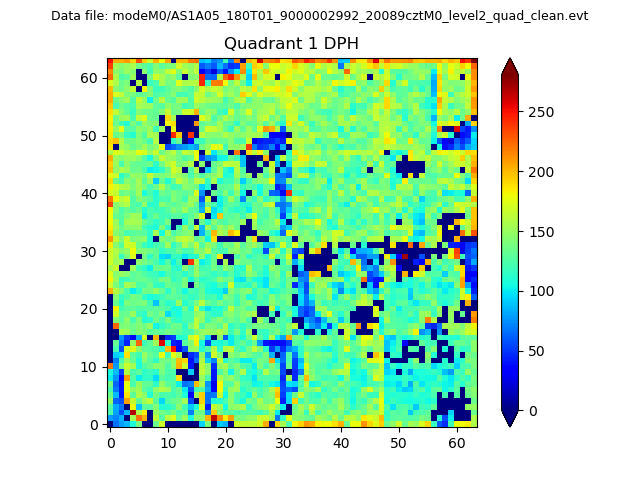 |
Quadrant B |
|---|---|---|---|
| Quadrant D | 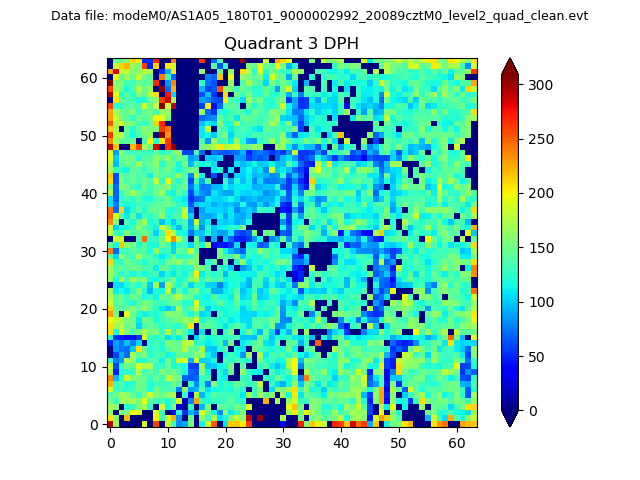 |
 |
Quadrant C |
| Plot type | Count rate plots | Images |
|---|---|---|
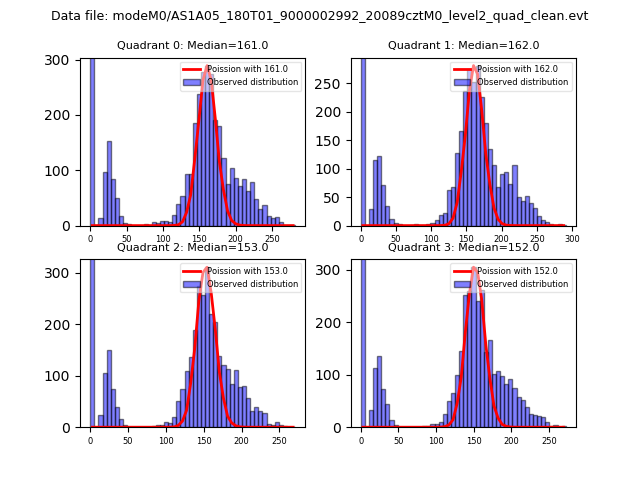
| Comparison with Poisson distribution Blue bars denote a histogram of data divided into 1 sec bins. Red curve is a Poisson curve with rate = median count rate of data. |
 |
 |
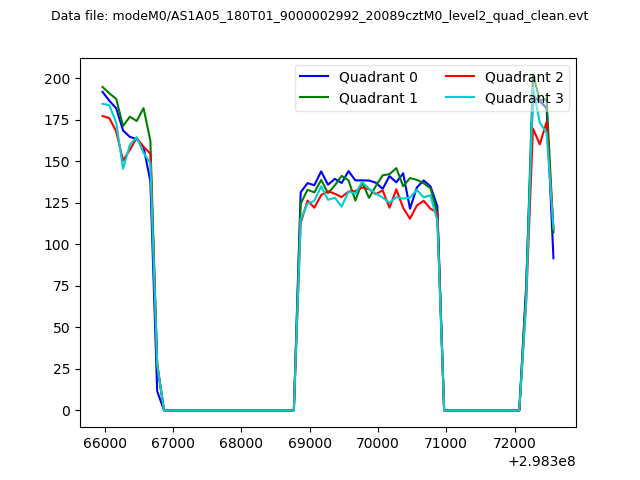
| Quadrant-wise count rates Data is divided into 100 sec bins |
 |
|
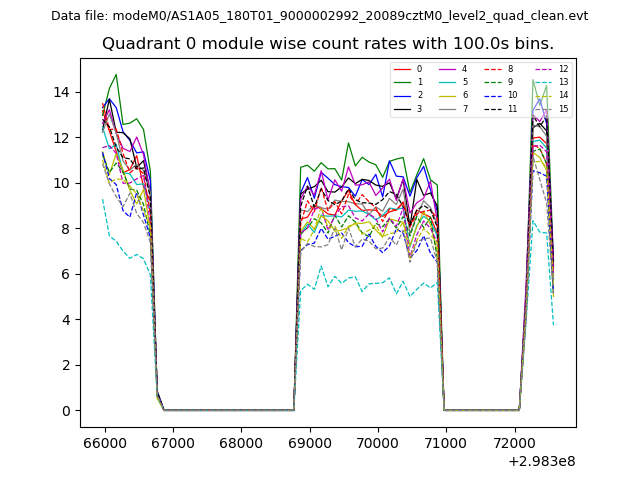
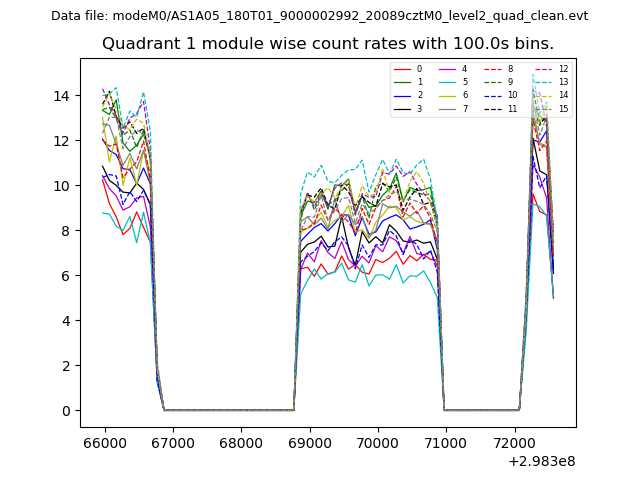
| Module-wise count rates for Quadrant A Data is divided into 100 sec bins |
 |
 |
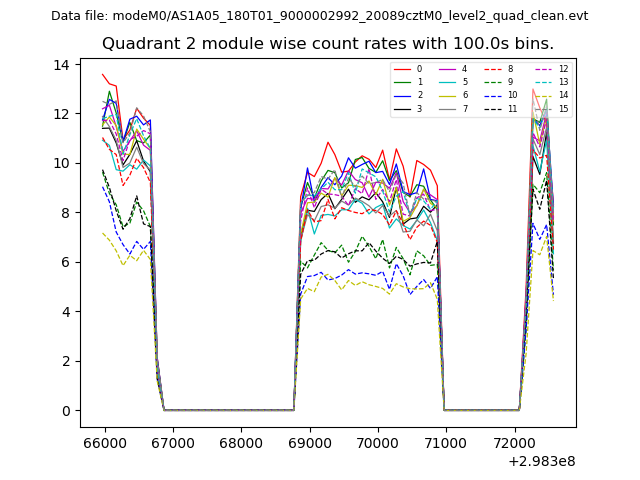
| Module-wise count rates for Quadrant B Data is divided into 100 sec bins |
 |
 |
| Module-wise count rates for Quadrant C Data is divided into 100 sec bins |
 |
 |
| Module-wise count rates for Quadrant D Data is divided into 100 sec bins |
 |
 |
| Parameter | Plot |
|---|---|
| CZT HV Monitor | 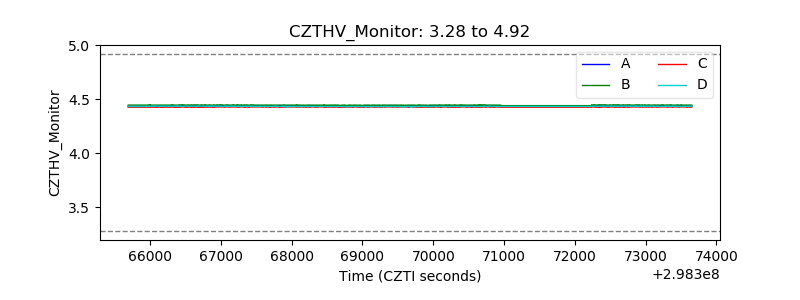 |
| D_VDD | 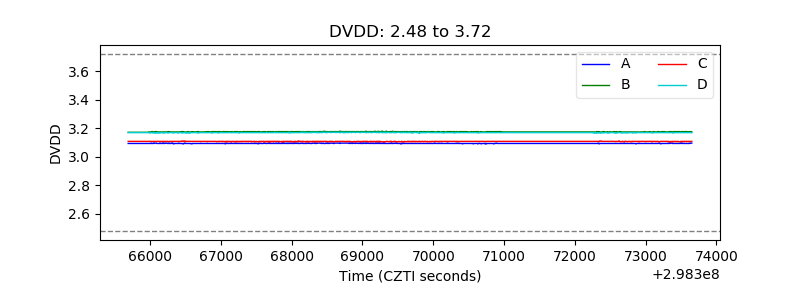 |
| Temperature 1 | 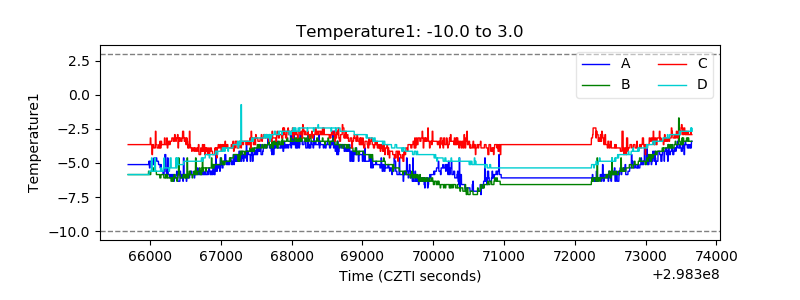 |
| Veto HV Monitor | 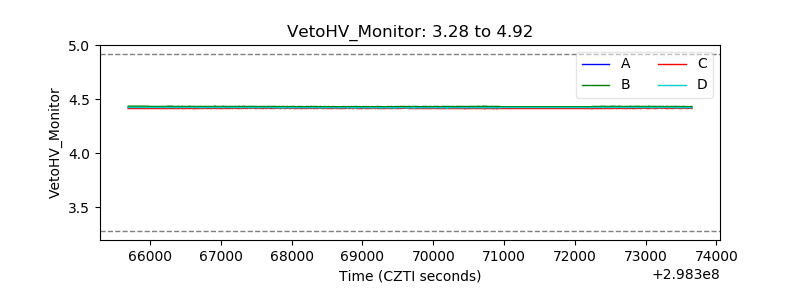 |
| Veto LLD | 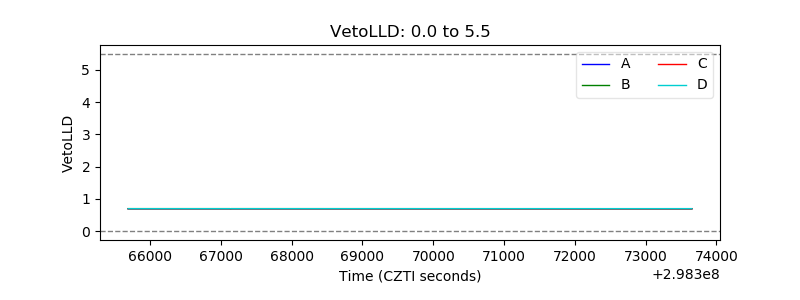 |
| Alpha Counter | 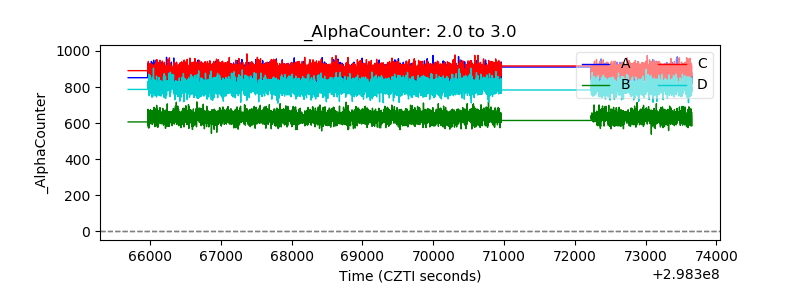 |
| _CPM_Rate | 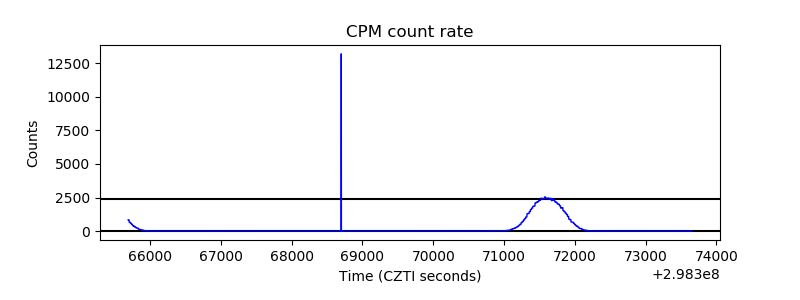 |
| CZT Counter | 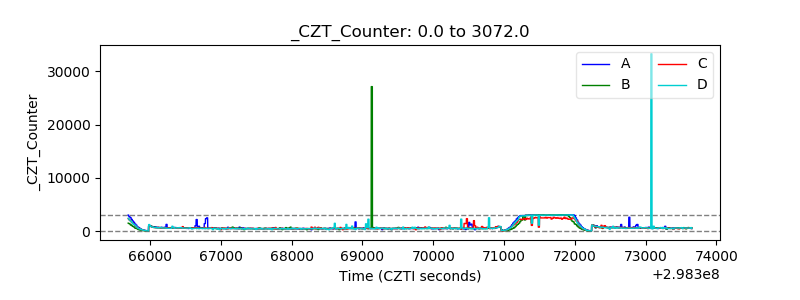 |
| +2.5 Volts monitor |  |
| +5 Volts monitor | 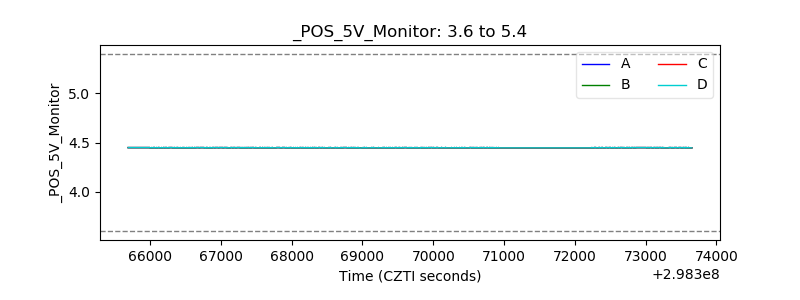 |
| _ROLL_ROT | 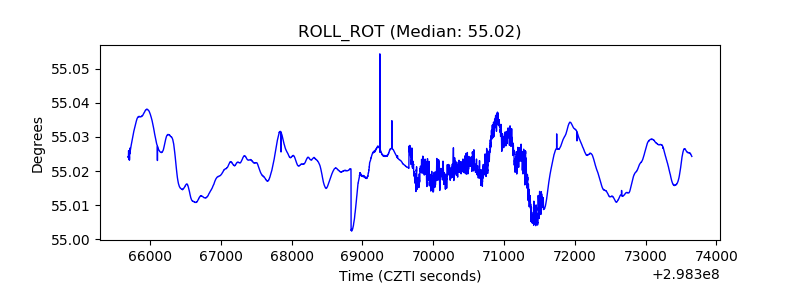 |
| _Roll_DEC |  |
| _Roll_RA | 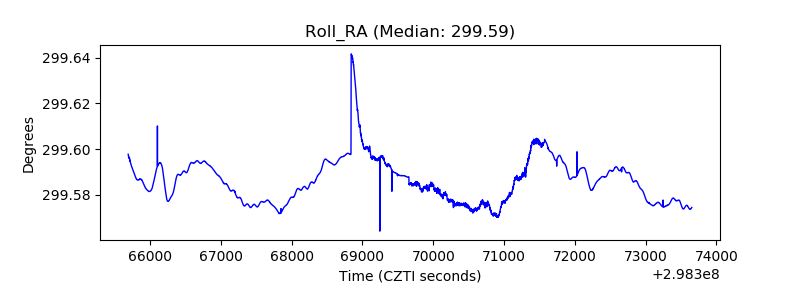 |
| Veto Counter | 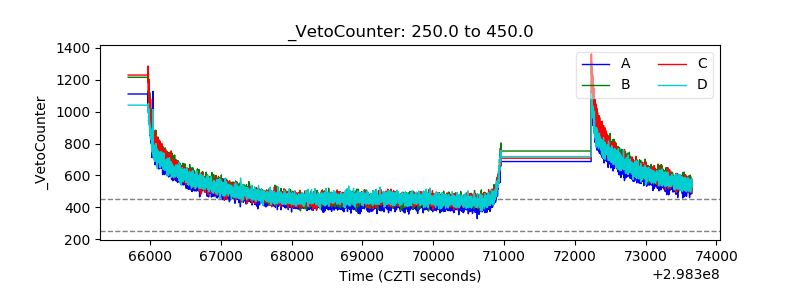 |