| Param | Original file | Final file |
|---|---|---|
| Filename | modeM0/AS1A05_180T01_9000002992_20090cztM0_level2.evt | modeM0/AS1A05_180T01_9000002992_20090cztM0_level2_quad_clean.evt |
| Size (bytes) | 510,592,320 | 71,426,880 |
| Size | 486.9 MB | 68.1 MB |
| Events in quadrant A | 3,973,515 | 435,256 |
| Events in quadrant B | 3,608,802 | 447,273 |
| Events in quadrant C | 3,701,794 | 420,990 |
| Events in quadrant D | 3,754,335 | 421,830 |
| Mode M9 | |||
|---|---|---|---|
| Quadrant | BADHDUFLAG | Total packets | Discarded packets |
| A | 0 | 13 | 0 |
| B | 0 | 13 | 0 |
| C | 0 | 13 | 0 |
| D | 0 | 13 | 0 |
| Mode M0 | |||
|---|---|---|---|
| Quadrant | BADHDUFLAG | Total packets | Discarded packets |
| A | 0 | 15686 | 1 |
| B | 0 | 14500 | 1 |
| C | 0 | 14708 | 1 |
| D | 0 | 15022 | 1 |
| Mode SS | |||
|---|---|---|---|
| Quadrant | BADHDUFLAG | Total packets | Discarded packets |
| A | 0 | 126 | 0 |
| B | 0 | 126 | 0 |
| C | 0 | 126 | 0 |
| D | 0 | 126 | 0 |
| Quadrant | Total seconds | Saturated seconds | Saturation percentage |
|---|---|---|---|
| A | 6270 | 262 | 4.178628% |
| B | 6270 | 159 | 2.535885% |
| C | 6270 | 196 | 3.125997% |
| D | 6270 | 136 | 2.169059% |
Noise dominated data is calculated using 1-second bins in cleaned event files. If a bin has >2000 counts, and if more than 50% of those come from <1% of pixels, then it is considered to be noise-dominated and hence unusable.
| Quadrant | # 1 sec bins | Bins with >0 counts | Bins with >2000 counts | High rate bins dominated by noise | Noise dominated (total time) | Noise dominated (detector-on time) | Marked lightcurve |
|---|---|---|---|---|---|---|---|
| A | 7565 | 6271 | 86 | 86 | 1.14% | 1.37% | 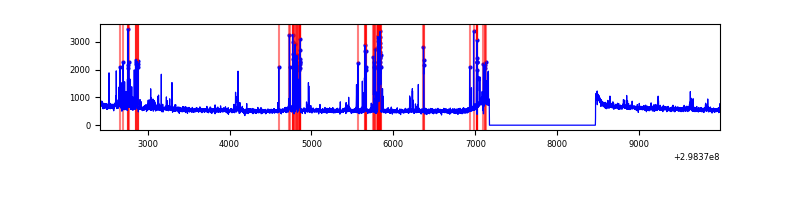 |
| B | 7565 | 6271 | 13 | 13 | 0.17% | 0.21% | 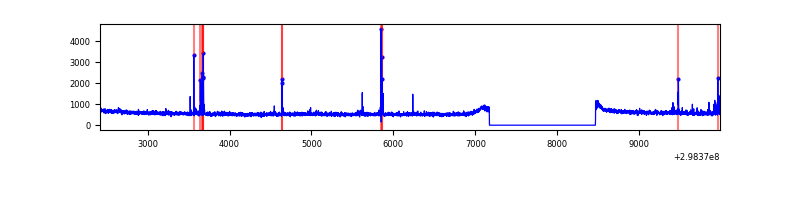 |
| C | 7565 | 6271 | 35 | 35 | 0.46% | 0.56% | 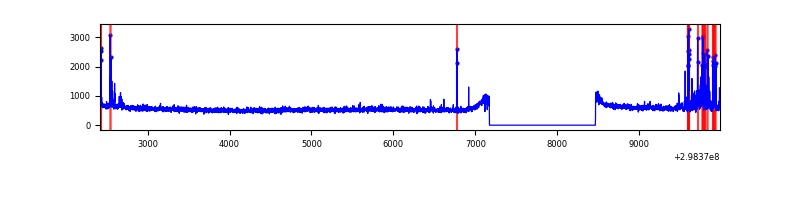 |
| D | 7565 | 6271 | 22 | 22 | 0.29% | 0.35% | 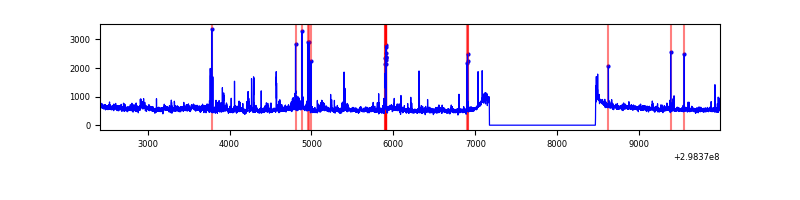 |
Top three noisy pixels from each quadrant. If the there are fewer than three noisy pixels in the level2.evt file, extra rows are filled as -1
| Pixel properties | Quadrant properties | ||||||
|---|---|---|---|---|---|---|---|
| Quadrant | DetID | PixID | Counts | Sigma | Mean | Median | Sigma |
| A | 14 | 238 | 365933 | 2045.69 | 904 | 891 | 178.4 |
| A | 14 | 254 | 70803 | 391.78 | 904 | 891 | 178.4 |
| A | 4 | 2 | 30930 | 168.34 | 904 | 891 | 178.4 |
| B | 4 | 80 | 45872 | 271.86 | 896 | 880 | 165.5 |
| B | 0 | 182 | 24720 | 144.05 | 896 | 880 | 165.5 |
| B | 12 | 111 | 19533 | 112.71 | 896 | 880 | 165.5 |
| C | 4 | 254 | 228680 | 1170.18 | 854 | 865 | 194.7 |
| C | 14 | 238 | 137337 | 700.99 | 854 | 865 | 194.7 |
| C | 3 | 233 | 8436 | 38.89 | 854 | 865 | 194.7 |
| D | 1 | 52 | 311712 | 1484.61 | 881 | 862 | 209.4 |
| D | 12 | 218 | 87307 | 412.86 | 881 | 862 | 209.4 |
| D | 2 | 234 | 28562 | 132.29 | 881 | 862 | 209.4 |
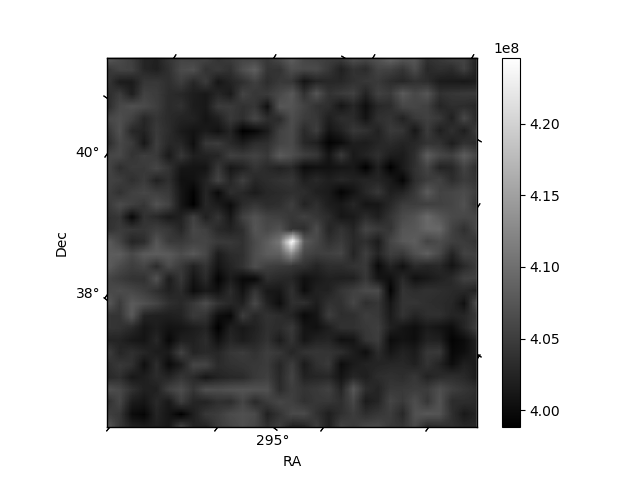
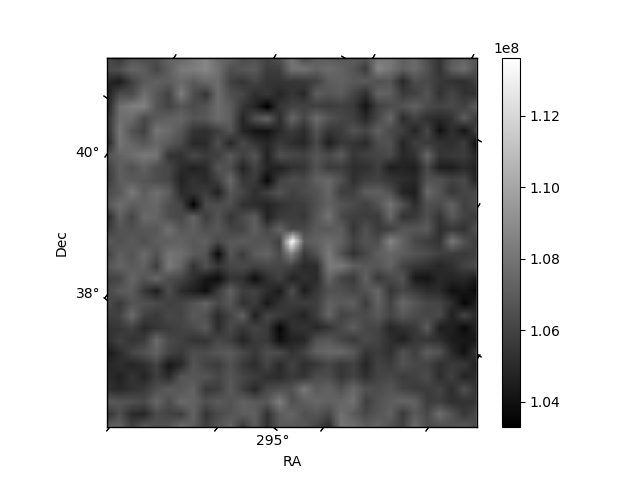
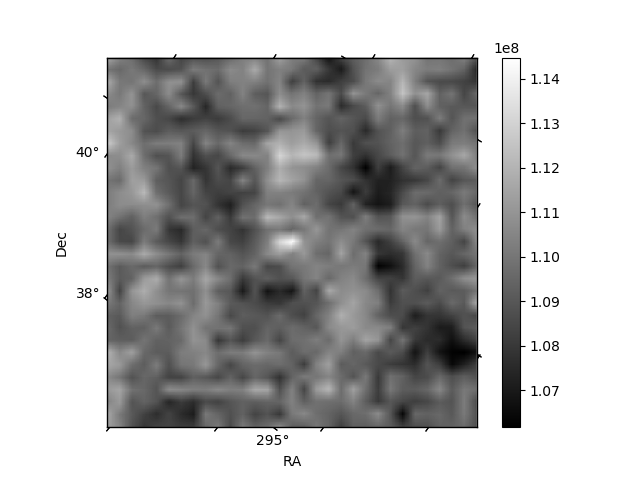
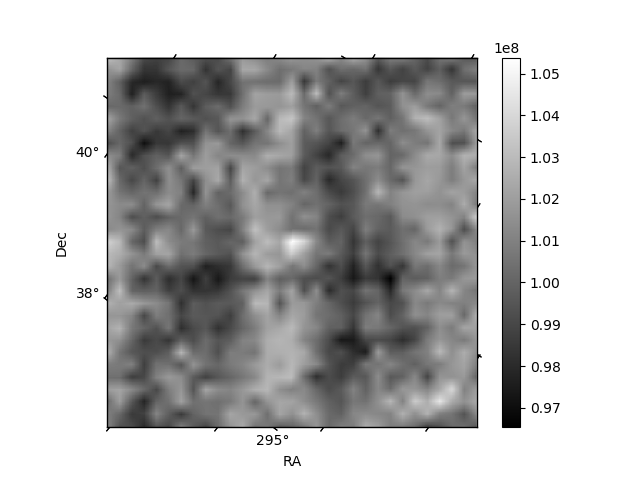
Histogram calculated using DETX and DETY for each event in the final _common_clean file
| Quadrant A | 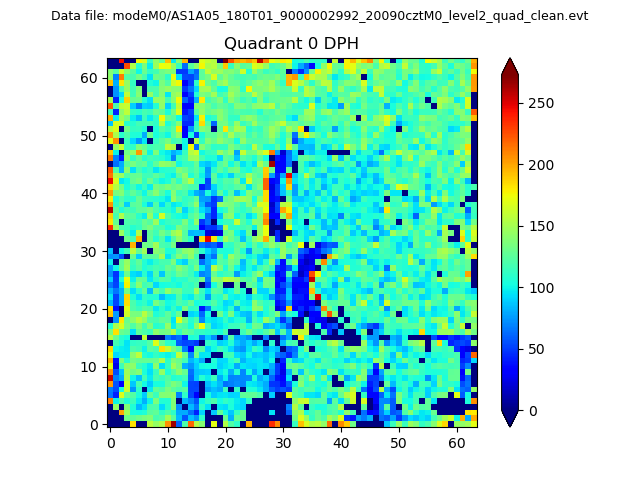 |
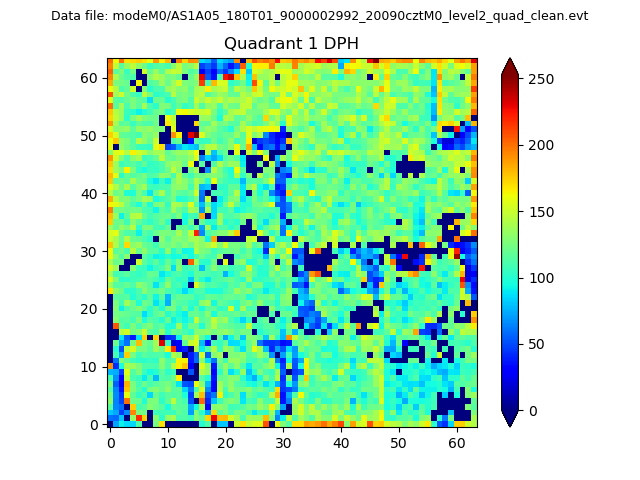 |
Quadrant B |
|---|---|---|---|
| Quadrant D | 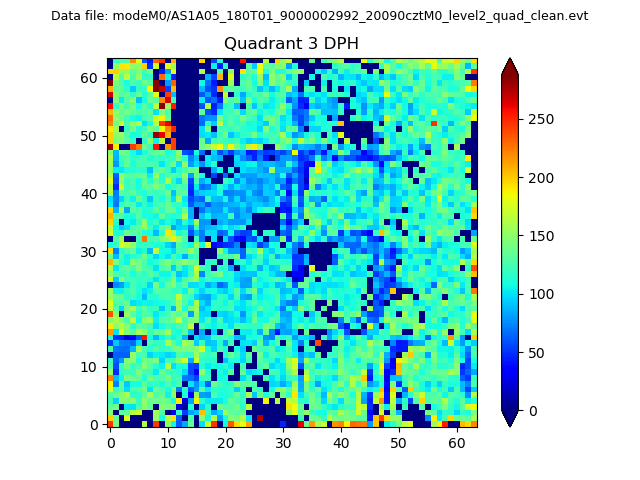 |
 |
Quadrant C |
| Plot type | Count rate plots | Images |
|---|---|---|
| Comparison with Poisson distribution Blue bars denote a histogram of data divided into 1 sec bins. Red curve is a Poisson curve with rate = median count rate of data. |
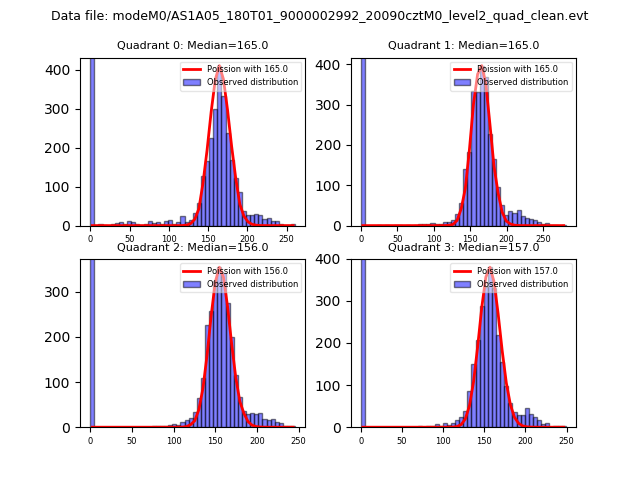 |
 |
| Quadrant-wise count rates Data is divided into 100 sec bins |
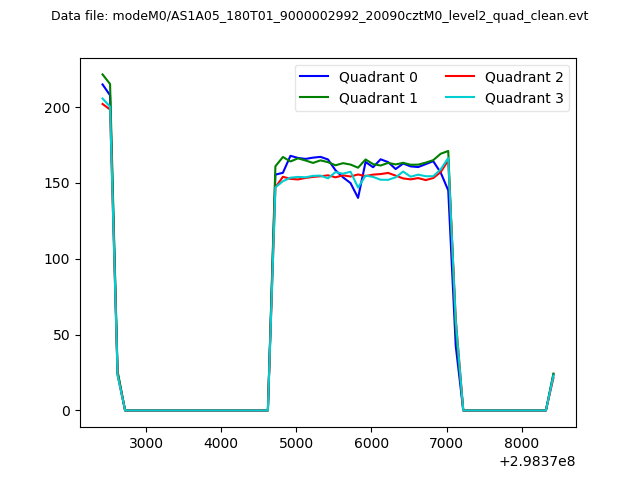 |
|
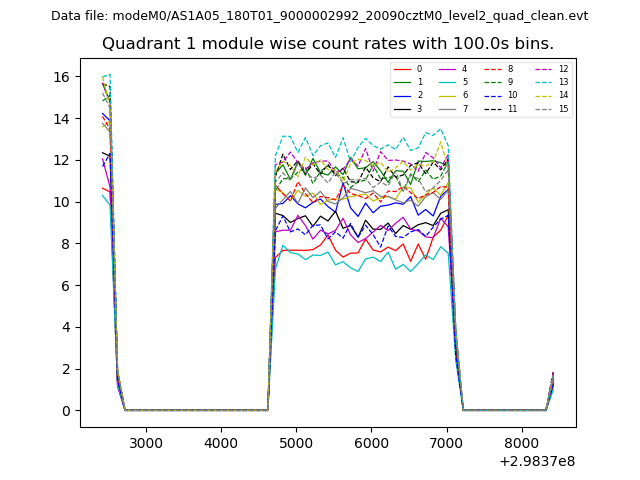
| Module-wise count rates for Quadrant A Data is divided into 100 sec bins |
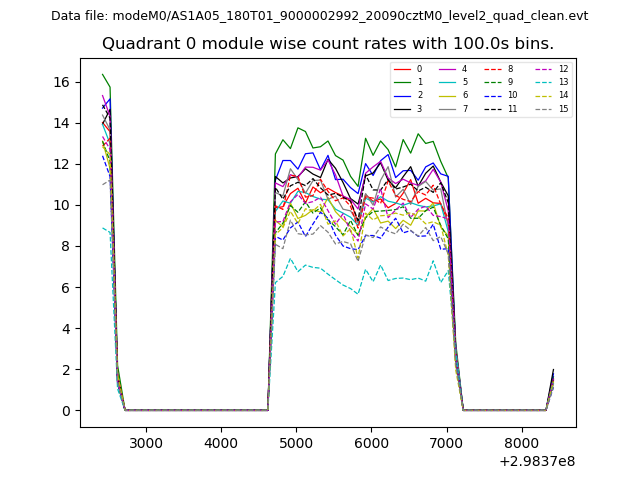 |
 |
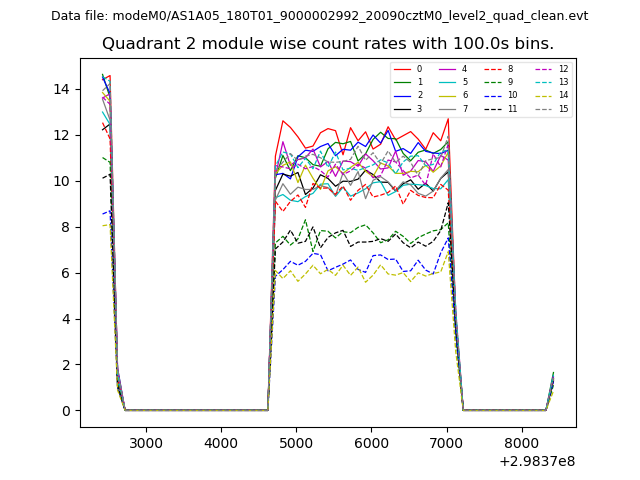
| Module-wise count rates for Quadrant B Data is divided into 100 sec bins |
 |
 |
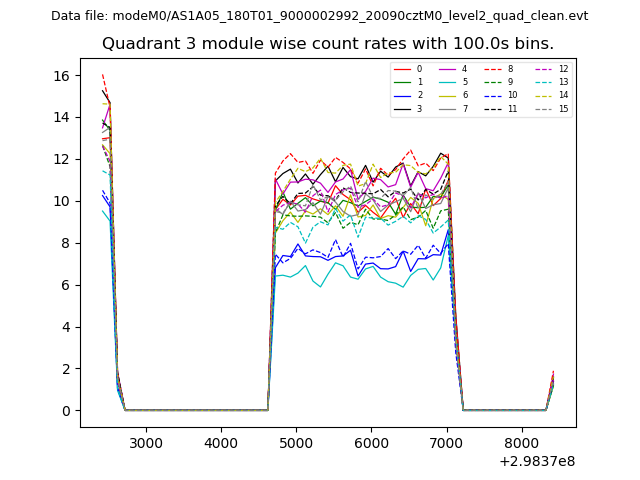
| Module-wise count rates for Quadrant C Data is divided into 100 sec bins |
 |
 |
| Module-wise count rates for Quadrant D Data is divided into 100 sec bins |
 |
 |
| Parameter | Plot |
|---|---|
| CZT HV Monitor | 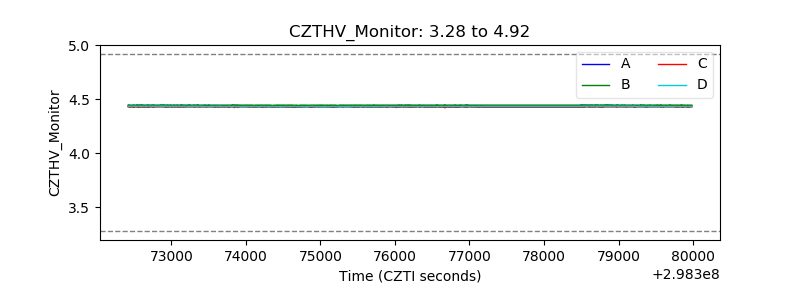 |
| D_VDD |  |
| Temperature 1 | 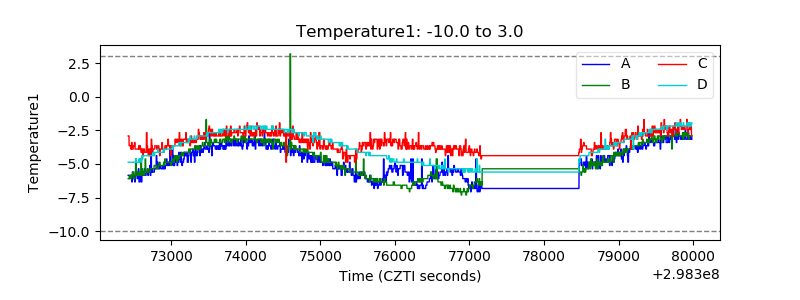 |
| Veto HV Monitor | 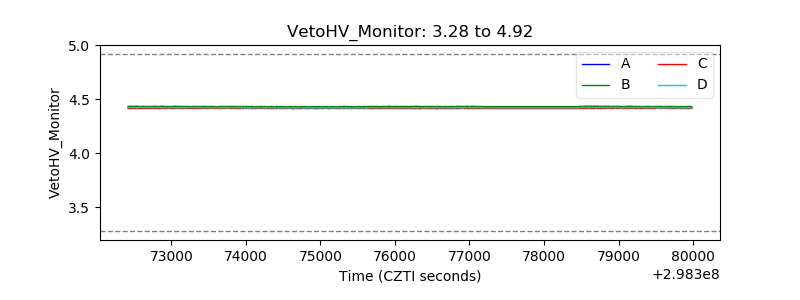 |
| Veto LLD | 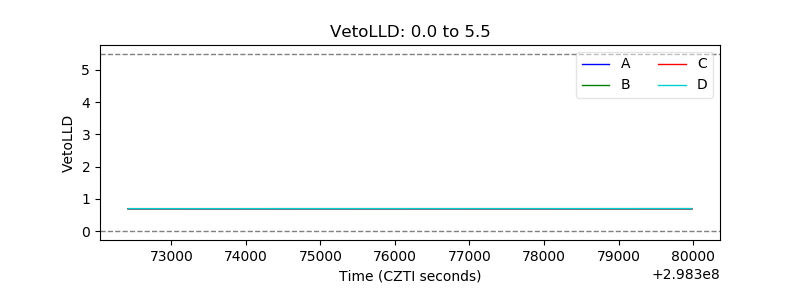 |
| Alpha Counter | 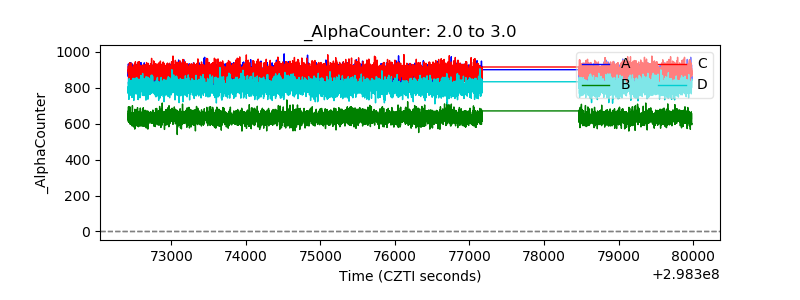 |
| _CPM_Rate | 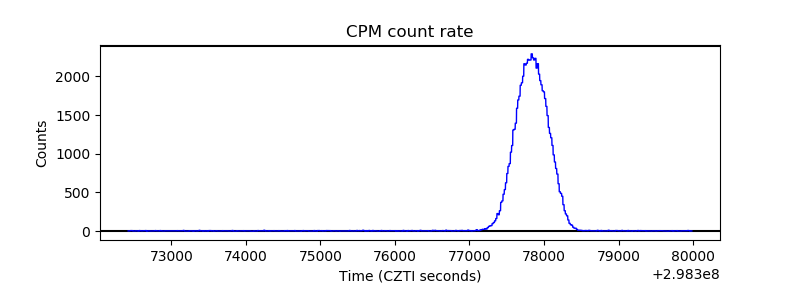 |
| CZT Counter |  |
| +2.5 Volts monitor |  |
| +5 Volts monitor |  |
| _ROLL_ROT | 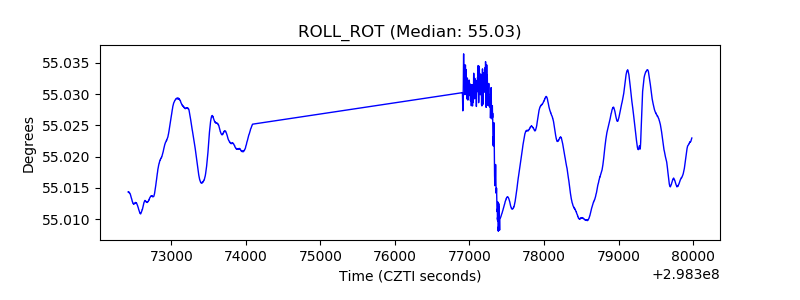 |
| _Roll_DEC | 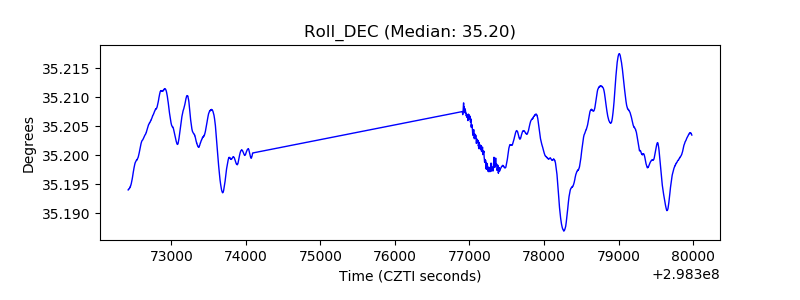 |
| _Roll_RA | 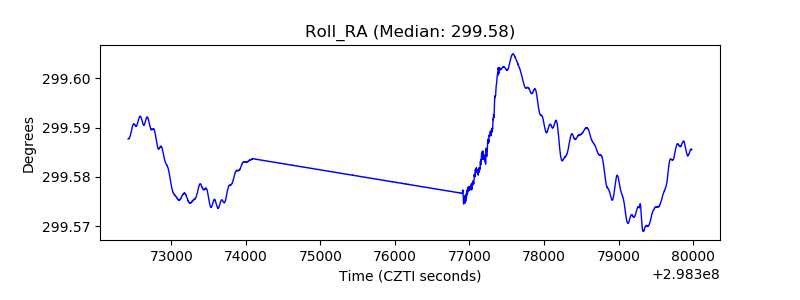 |
| Veto Counter | 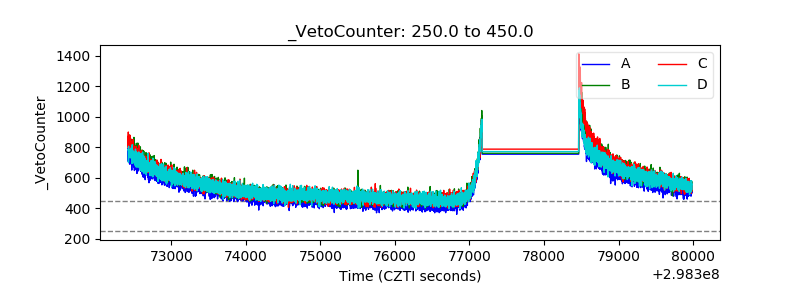 |