| Param | Original file | Final file |
|---|---|---|
| Filename | modeM0/AS1A05_180T01_9000002992_20093cztM0_level2.evt | modeM0/AS1A05_180T01_9000002992_20093cztM0_level2_quad_clean.evt |
| Size (bytes) | 536,469,120 | 98,904,960 |
| Size | 511.6 MB | 94.3 MB |
| Events in quadrant A | 5,131,526 | 615,398 |
| Events in quadrant B | 3,540,930 | 660,061 |
| Events in quadrant C | 3,656,128 | 626,272 |
| Events in quadrant D | 3,465,315 | 627,700 |
| Mode M9 | |||
|---|---|---|---|
| Quadrant | BADHDUFLAG | Total packets | Discarded packets |
| A | 0 | 22 | 0 |
| B | 0 | 22 | 0 |
| C | 0 | 22 | 0 |
| D | 0 | 22 | 0 |
| Mode M0 | |||
|---|---|---|---|
| Quadrant | BADHDUFLAG | Total packets | Discarded packets |
| A | 0 | 19471 | 2 |
| B | 0 | 14481 | 2 |
| C | 0 | 14732 | 2 |
| D | 0 | 14220 | 2 |
| Mode SS | |||
|---|---|---|---|
| Quadrant | BADHDUFLAG | Total packets | Discarded packets |
| A | 0 | 138 | 0 |
| B | 0 | 138 | 0 |
| C | 0 | 138 | 0 |
| D | 0 | 138 | 0 |
| Quadrant | Total seconds | Saturated seconds | Saturation percentage |
|---|---|---|---|
| A | 6676 | 716 | 10.724985% |
| B | 6677 | 81 | 1.213120% |
| C | 6677 | 149 | 2.231541% |
| D | 6677 | 66 | 0.988468% |
Noise dominated data is calculated using 1-second bins in cleaned event files. If a bin has >2000 counts, and if more than 50% of those come from <1% of pixels, then it is considered to be noise-dominated and hence unusable.
| Quadrant | # 1 sec bins | Bins with >0 counts | Bins with >2000 counts | High rate bins dominated by noise | Noise dominated (total time) | Noise dominated (detector-on time) | Marked lightcurve |
|---|---|---|---|---|---|---|---|
| A | 8896 | 6678 | 389 | 389 | 4.37% | 5.83% | 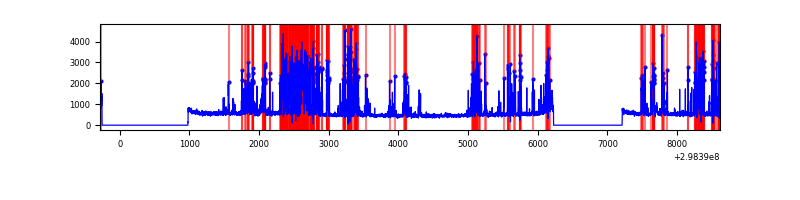 |
| B | 8897 | 6679 | 0 | 0 | 0.00% | 0.00% | 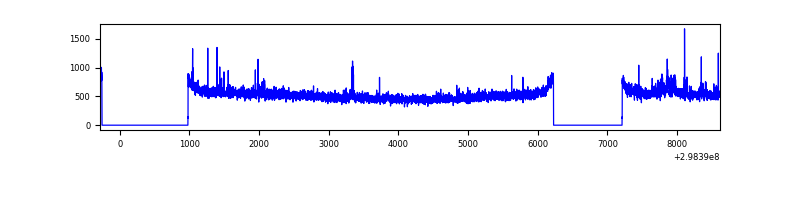 |
| C | 8897 | 6679 | 17 | 17 | 0.19% | 0.25% |  |
| D | 8897 | 6679 | 9 | 9 | 0.10% | 0.13% | 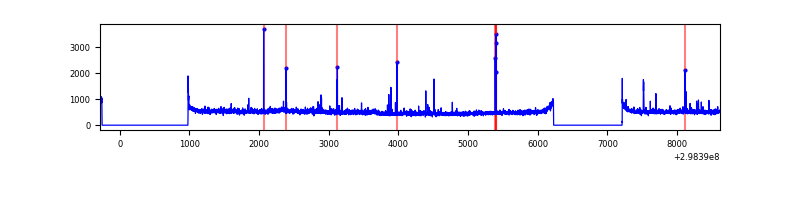 |
Top three noisy pixels from each quadrant. If the there are fewer than three noisy pixels in the level2.evt file, extra rows are filled as -1
| Pixel properties | Quadrant properties | ||||||
|---|---|---|---|---|---|---|---|
| Quadrant | DetID | PixID | Counts | Sigma | Mean | Median | Sigma |
| A | 14 | 238 | 1139535 | 6706.73 | 845 | 831 | 169.8 |
| A | 14 | 254 | 678245 | 3989.83 | 845 | 831 | 169.8 |
| A | 14 | 237 | 52287 | 303.07 | 845 | 831 | 169.8 |
| B | 0 | 183 | 49122 | 291.12 | 874 | 856 | 165.8 |
| B | 0 | 214 | 28091 | 164.27 | 874 | 856 | 165.8 |
| B | 12 | 111 | 19454 | 112.18 | 874 | 856 | 165.8 |
| C | 4 | 254 | 222815 | 1132.98 | 841 | 850 | 195.9 |
| C | 14 | 238 | 133562 | 677.4 | 841 | 850 | 195.9 |
| C | 3 | 233 | 21464 | 105.22 | 841 | 850 | 195.9 |
| D | 1 | 52 | 60586 | 284.71 | 864 | 843 | 209.8 |
| D | 2 | 184 | 52370 | 245.55 | 864 | 843 | 209.8 |
| D | 12 | 218 | 45860 | 214.53 | 864 | 843 | 209.8 |
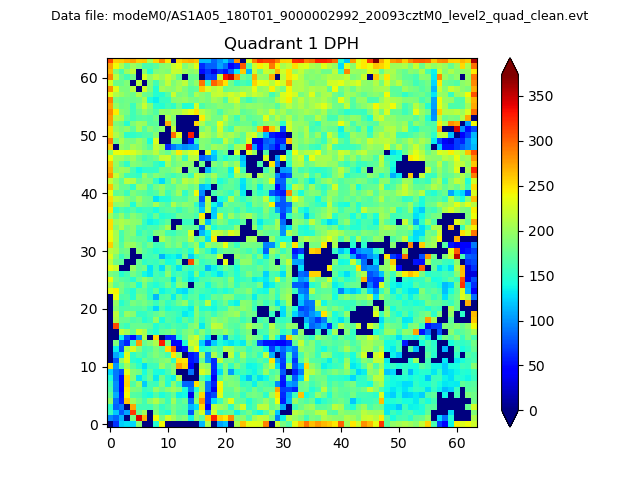
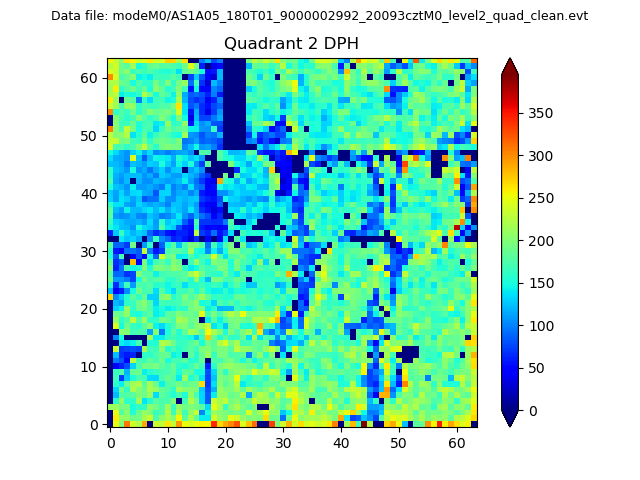
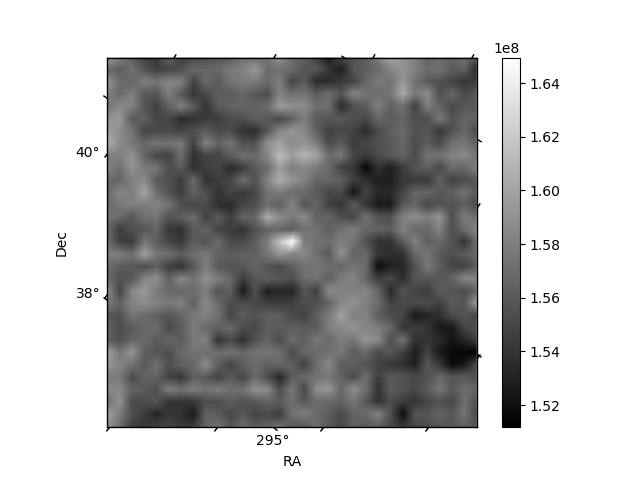
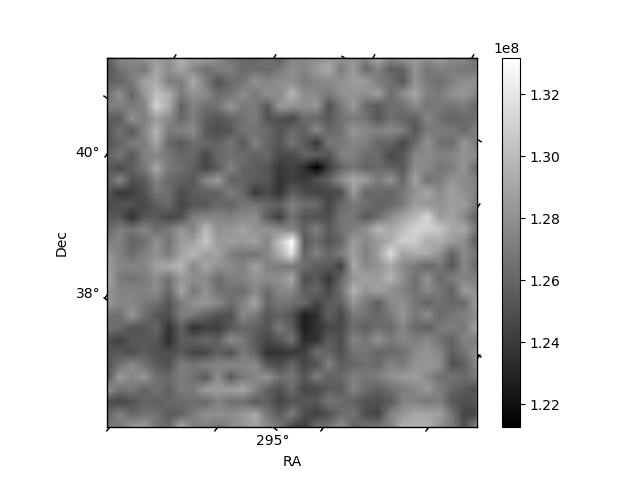
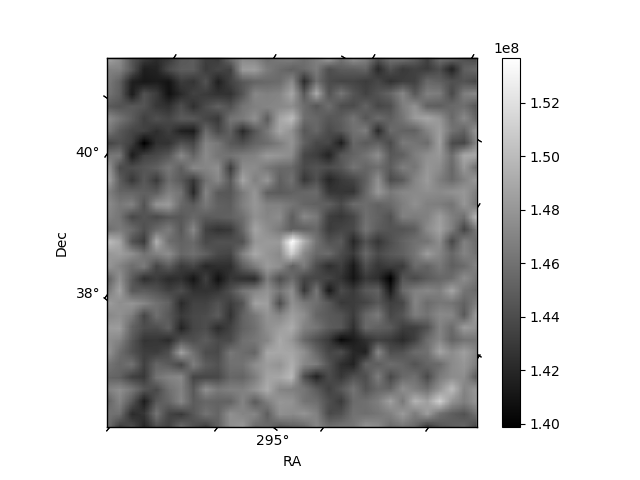
Histogram calculated using DETX and DETY for each event in the final _common_clean file
| Quadrant A | 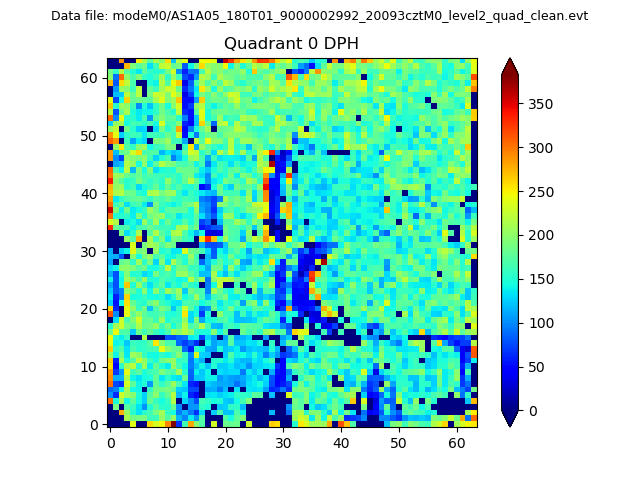 |
 |
Quadrant B |
|---|---|---|---|
| Quadrant D | 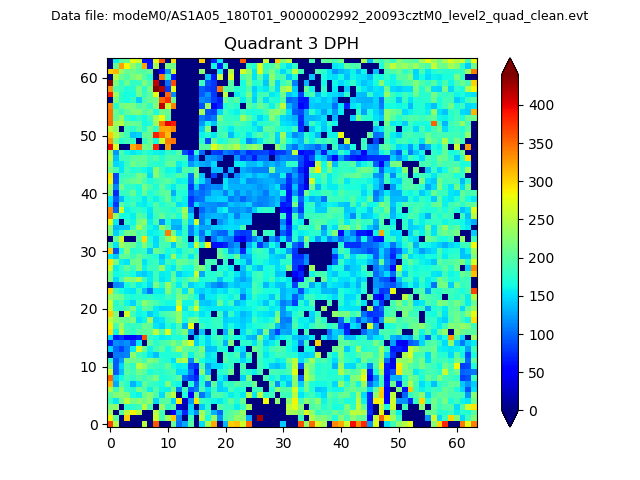 |
 |
Quadrant C |
| Plot type | Count rate plots | Images |
|---|---|---|
| Comparison with Poisson distribution Blue bars denote a histogram of data divided into 1 sec bins. Red curve is a Poisson curve with rate = median count rate of data. |
 |
 |
| Quadrant-wise count rates Data is divided into 100 sec bins |
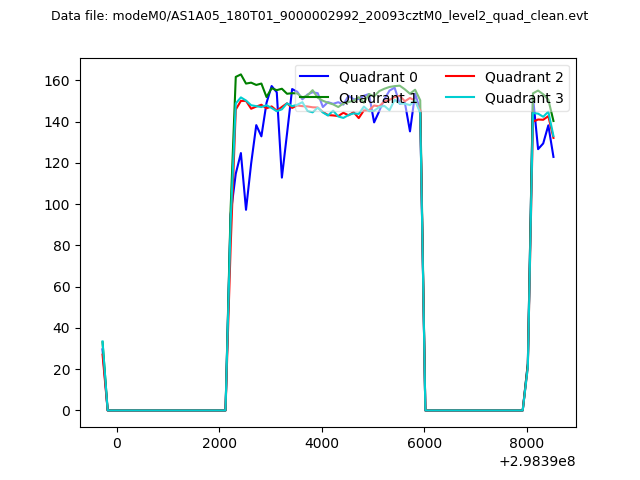 |
|
| Module-wise count rates for Quadrant A Data is divided into 100 sec bins |
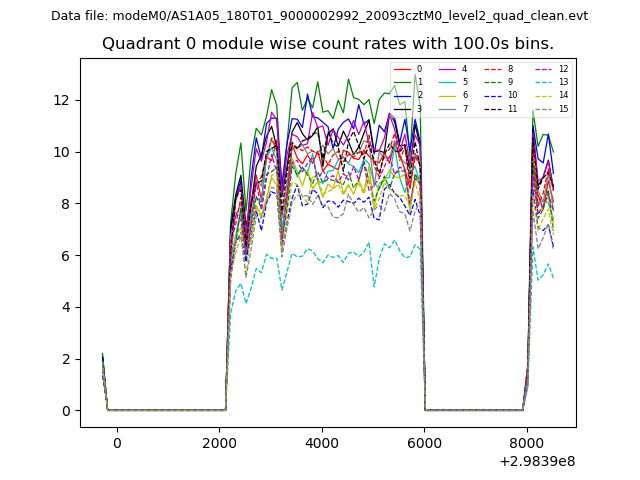 |
 |
| Module-wise count rates for Quadrant B Data is divided into 100 sec bins |
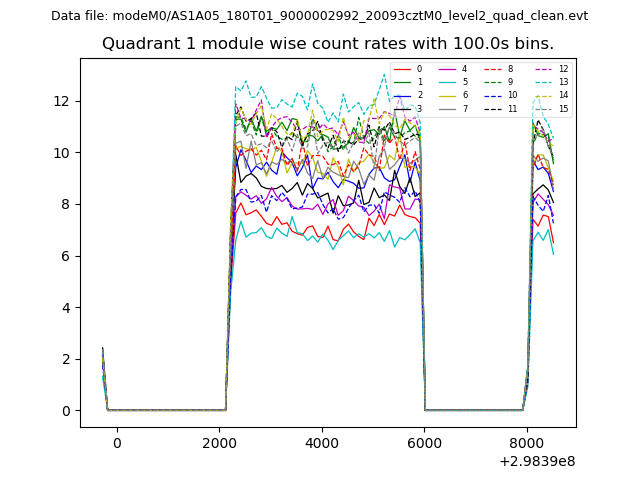 |
 |
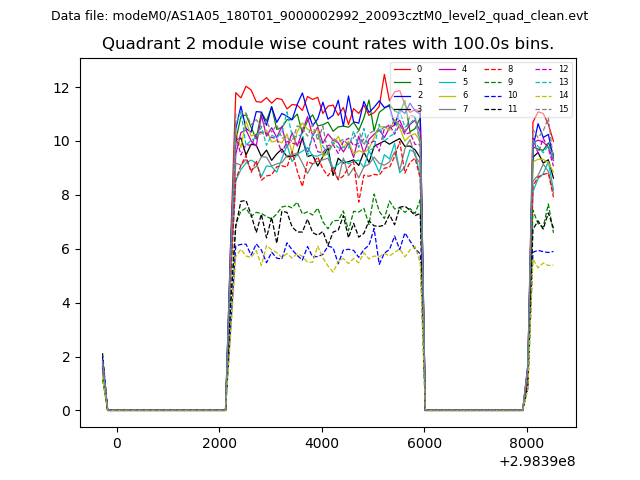
| Module-wise count rates for Quadrant C Data is divided into 100 sec bins |
 |
 |
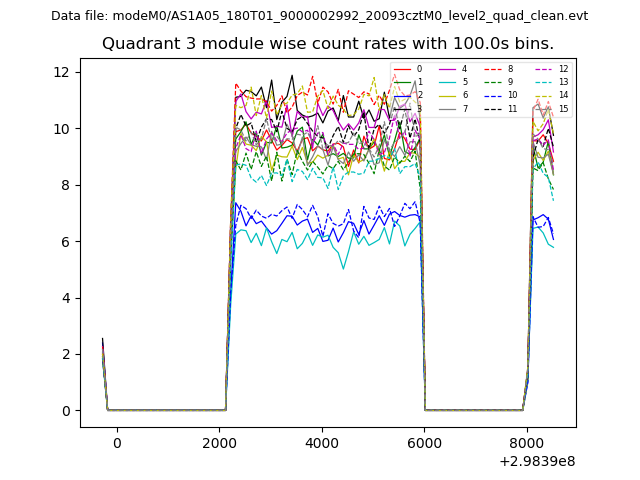
| Module-wise count rates for Quadrant D Data is divided into 100 sec bins |
 |
 |
| Parameter | Plot |
|---|---|
| CZT HV Monitor | 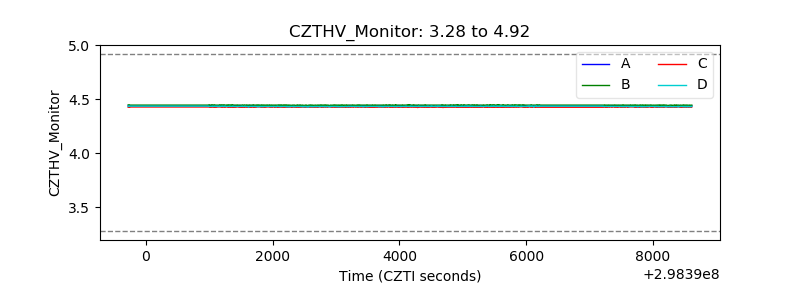 |
| D_VDD | 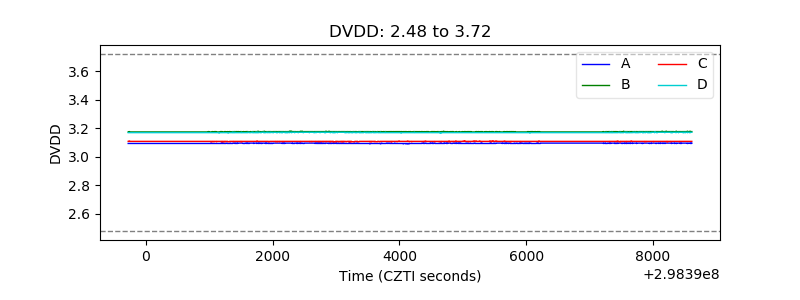 |
| Temperature 1 | 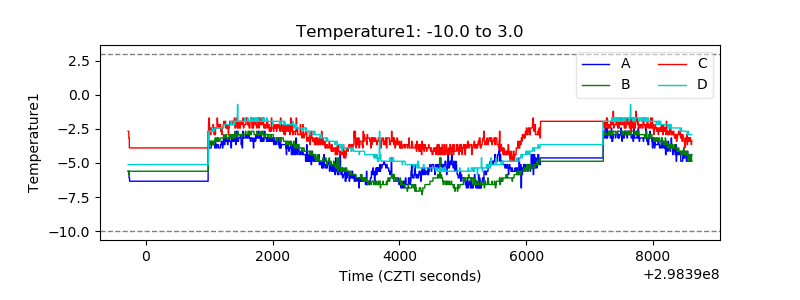 |
| Veto HV Monitor | 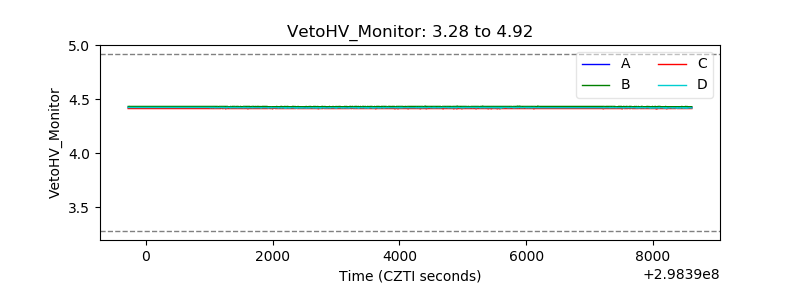 |
| Veto LLD | 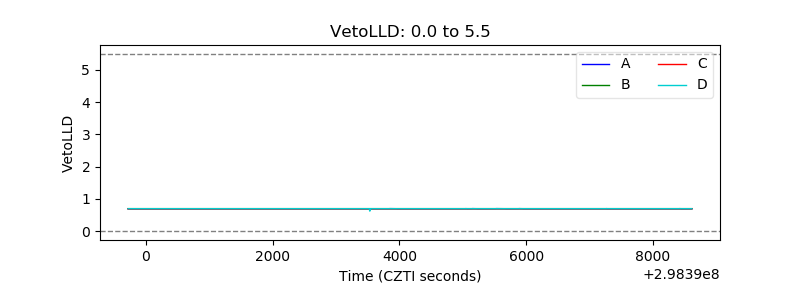 |
| Alpha Counter | 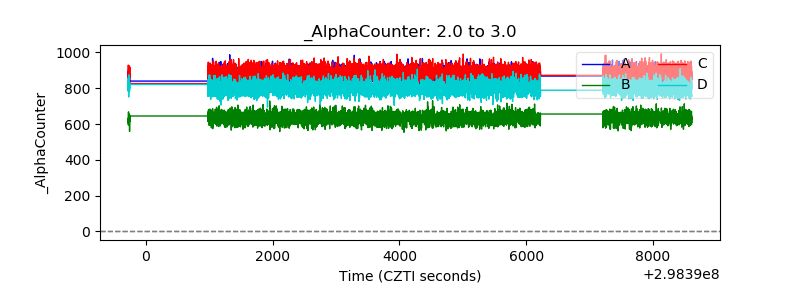 |
| _CPM_Rate | 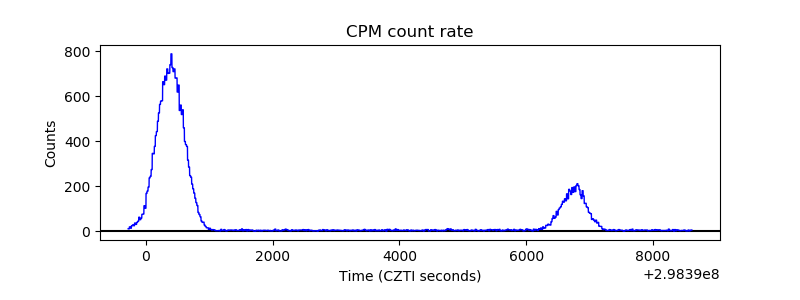 |
| CZT Counter | 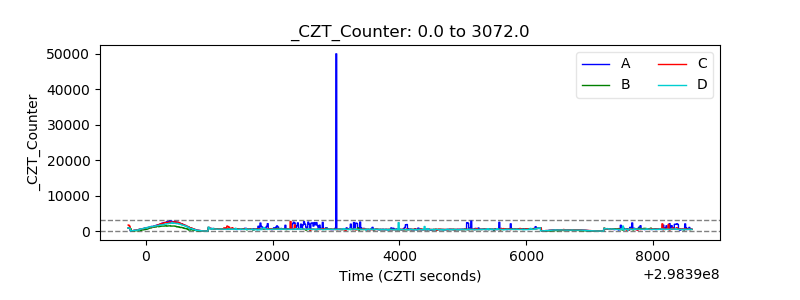 |
| +2.5 Volts monitor | 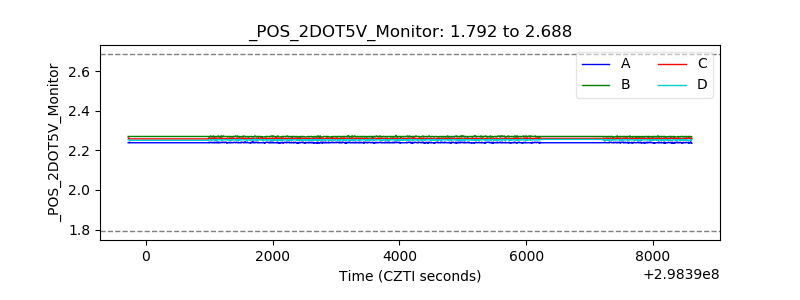 |
| +5 Volts monitor |  |
| _ROLL_ROT | 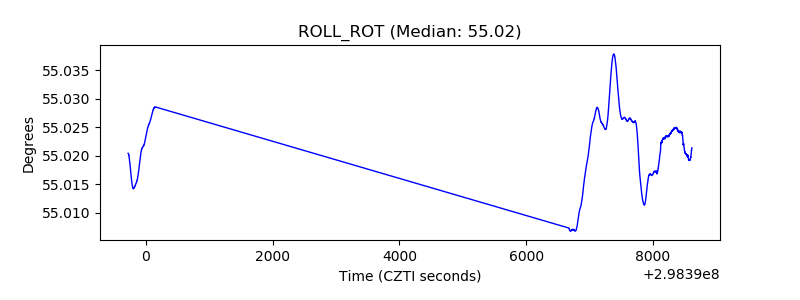 |
| _Roll_DEC | 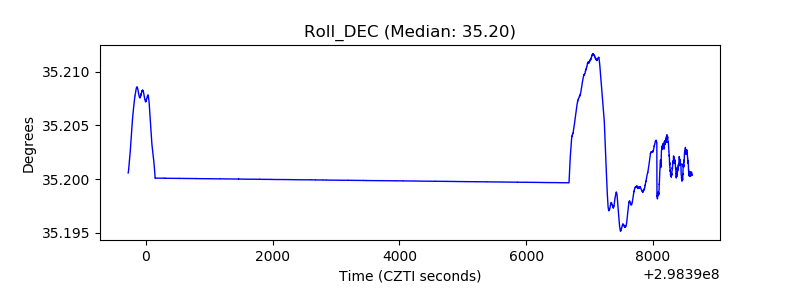 |
| _Roll_RA | 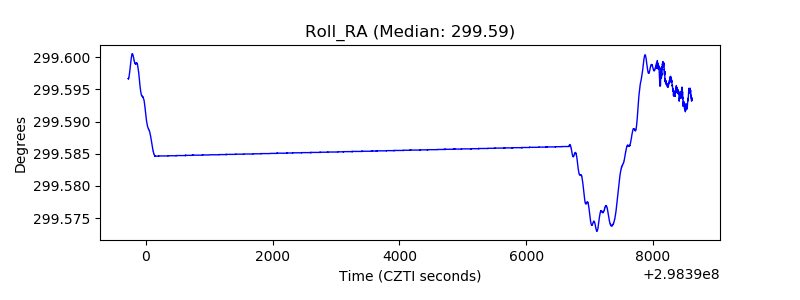 |
| Veto Counter | 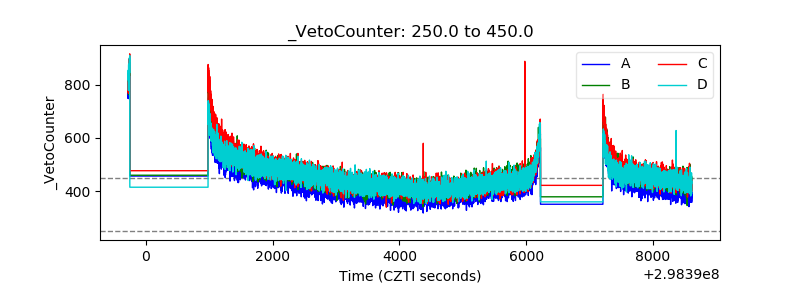 |