| Param | Original file | Final file |
|---|---|---|
| Filename | modeM0/AS1A05_180T01_9000002992_20095cztM0_level2.evt | modeM0/AS1A05_180T01_9000002992_20095cztM0_level2_quad_clean.evt |
| Size (bytes) | 802,284,480 | 111,925,440 |
| Size | 765.1 MB | 106.7 MB |
| Events in quadrant A | 5,984,947 | 714,850 |
| Events in quadrant B | 7,153,261 | 724,784 |
| Events in quadrant C | 5,429,830 | 703,341 |
| Events in quadrant D | 5,187,119 | 689,035 |
| Mode M9 | |||
|---|---|---|---|
| Quadrant | BADHDUFLAG | Total packets | Discarded packets |
| A | 0 | 7 | 0 |
| B | 0 | 7 | 0 |
| C | 0 | 7 | 0 |
| D | 0 | 7 | 0 |
| Mode M0 | |||
|---|---|---|---|
| Quadrant | BADHDUFLAG | Total packets | Discarded packets |
| A | 0 | 22893 | 2 |
| B | 0 | 26713 | 2 |
| C | 0 | 21187 | 2 |
| D | 0 | 20666 | 2 |
| Mode SS | |||
|---|---|---|---|
| Quadrant | BADHDUFLAG | Total packets | Discarded packets |
| A | 0 | 166 | 0 |
| B | 0 | 166 | 0 |
| C | 0 | 166 | 0 |
| D | 0 | 166 | 0 |
| Quadrant | Total seconds | Saturated seconds | Saturation percentage |
|---|---|---|---|
| A | 8016 | 828 | 10.329341% |
| B | 8017 | 1371 | 17.101160% |
| C | 8017 | 674 | 8.407135% |
| D | 8017 | 423 | 5.276288% |
Noise dominated data is calculated using 1-second bins in cleaned event files. If a bin has >2000 counts, and if more than 50% of those come from <1% of pixels, then it is considered to be noise-dominated and hence unusable.
| Quadrant | # 1 sec bins | Bins with >0 counts | Bins with >2000 counts | High rate bins dominated by noise | Noise dominated (total time) | Noise dominated (detector-on time) | Marked lightcurve |
|---|---|---|---|---|---|---|---|
| A | 8726 | 8019 | 431 | 431 | 4.94% | 5.37% |  |
| B | 8727 | 8020 | 626 | 626 | 7.17% | 7.81% |  |
| C | 8727 | 8020 | 302 | 302 | 3.46% | 3.77% | 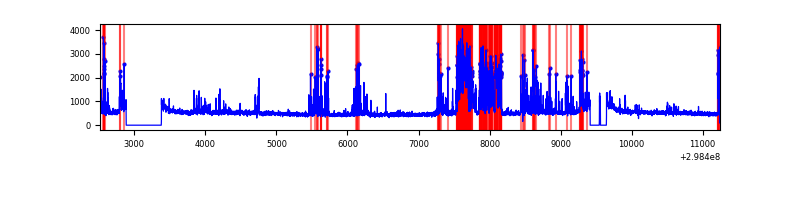 |
| D | 8727 | 8019 | 253 | 253 | 2.90% | 3.16% | 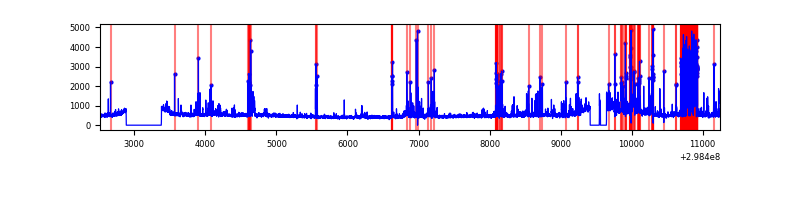 |
Top three noisy pixels from each quadrant. If the there are fewer than three noisy pixels in the level2.evt file, extra rows are filled as -1
| Pixel properties | Quadrant properties | ||||||
|---|---|---|---|---|---|---|---|
| Quadrant | DetID | PixID | Counts | Sigma | Mean | Median | Sigma |
| A | 14 | 238 | 1858212 | 9175.14 | 992 | 973 | 202.4 |
| A | 14 | 254 | 243657 | 1198.91 | 992 | 973 | 202.4 |
| A | 9 | 143 | 31028 | 148.48 | 992 | 973 | 202.4 |
| B | 10 | 245 | 3210555 | 17432.91 | 960 | 934 | 184.1 |
| B | 7 | 220 | 47137 | 250.95 | 960 | 934 | 184.1 |
| B | 0 | 244 | 37442 | 198.29 | 960 | 934 | 184.1 |
| C | 4 | 254 | 1495541 | 6594.92 | 966 | 976 | 226.6 |
| C | 14 | 238 | 151547 | 664.41 | 966 | 976 | 226.6 |
| C | 3 | 233 | 14867 | 61.3 | 966 | 976 | 226.6 |
| D | 1 | 52 | 1229795 | 5196.52 | 982 | 956 | 236.5 |
| D | 12 | 218 | 88137 | 368.67 | 982 | 956 | 236.5 |
| D | 7 | 96 | 64128 | 267.14 | 982 | 956 | 236.5 |
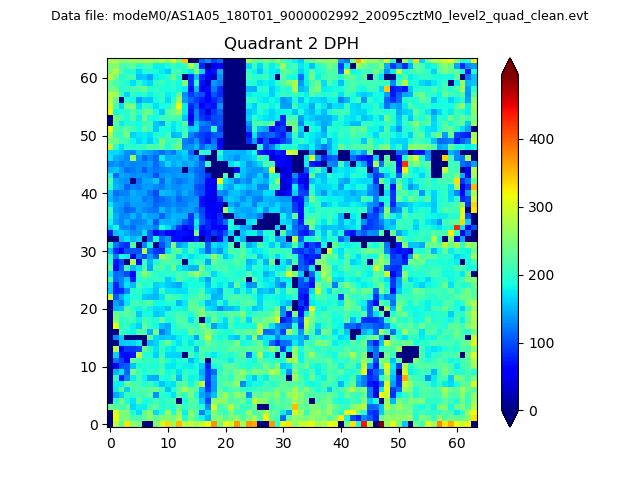
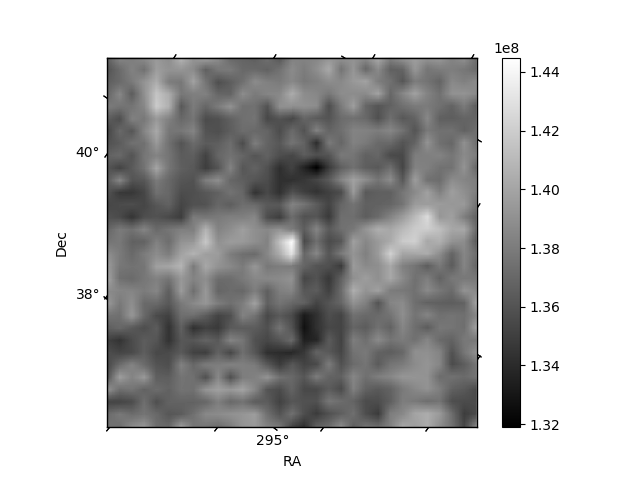
Histogram calculated using DETX and DETY for each event in the final _common_clean file
| Quadrant A | 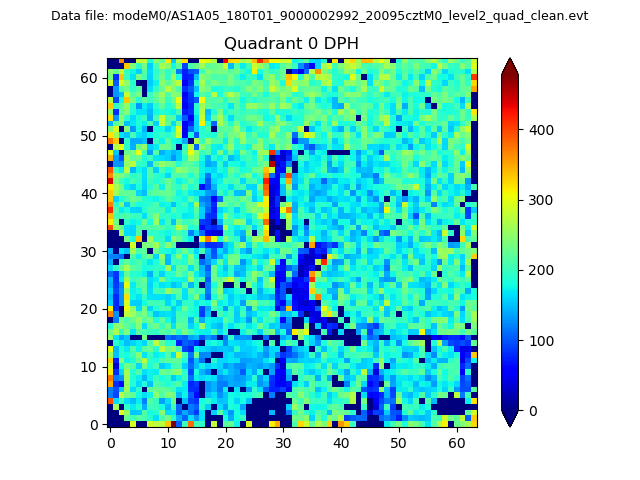 |
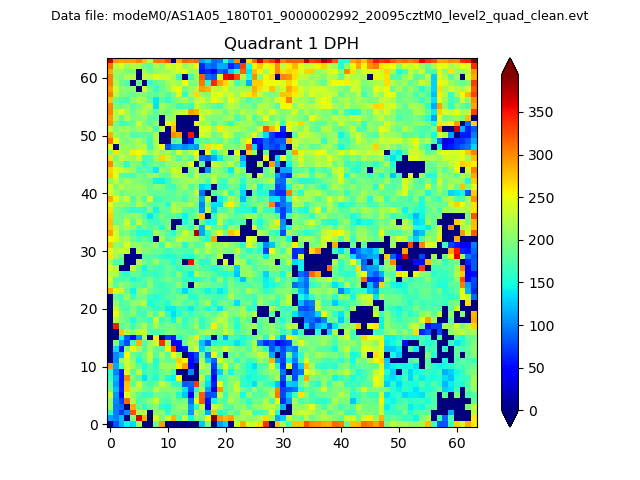 |
Quadrant B |
|---|---|---|---|
| Quadrant D | 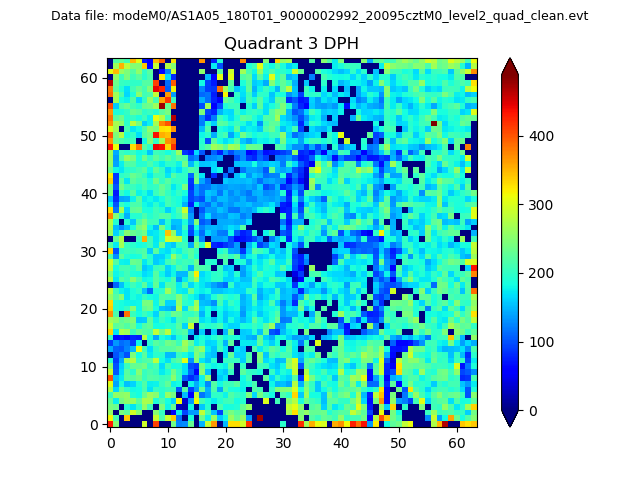 |
 |
Quadrant C |
| Plot type | Count rate plots | Images |
|---|---|---|
| Comparison with Poisson distribution Blue bars denote a histogram of data divided into 1 sec bins. Red curve is a Poisson curve with rate = median count rate of data. |
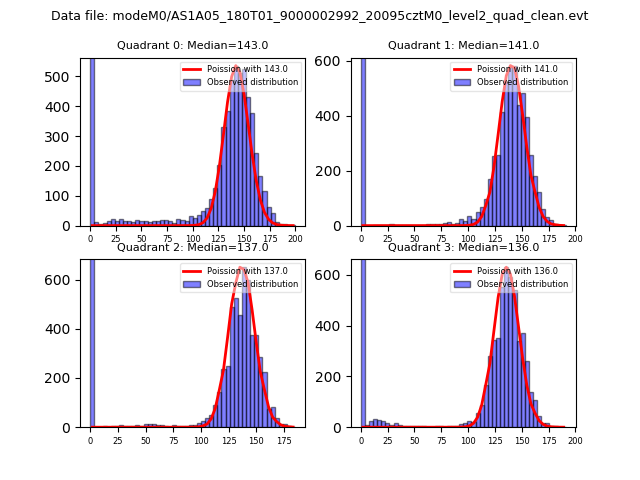 |
 |
| Quadrant-wise count rates Data is divided into 100 sec bins |
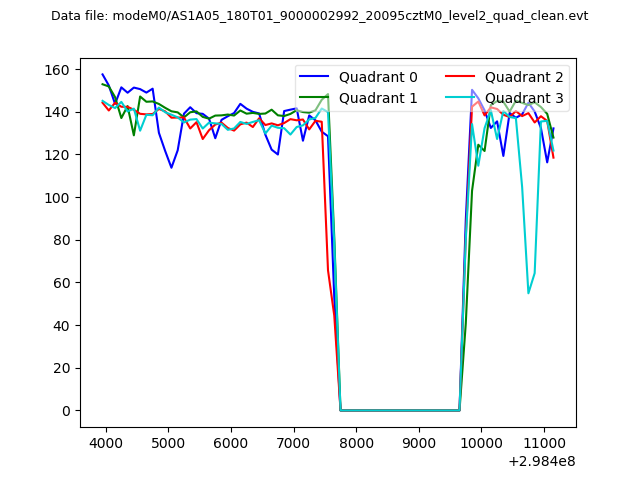 |
|
| Module-wise count rates for Quadrant A Data is divided into 100 sec bins |
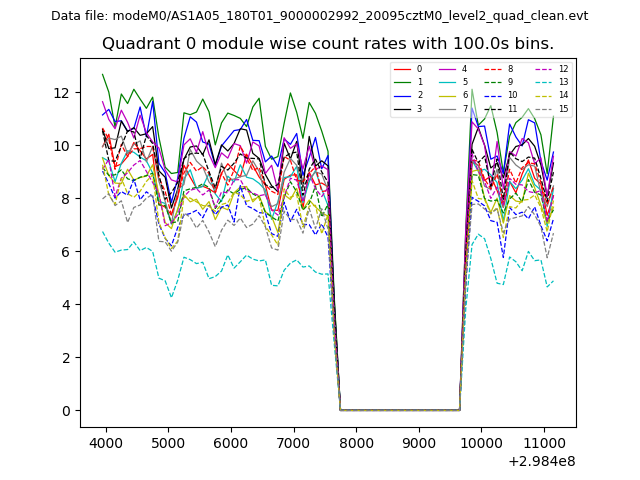 |
 |
| Module-wise count rates for Quadrant B Data is divided into 100 sec bins |
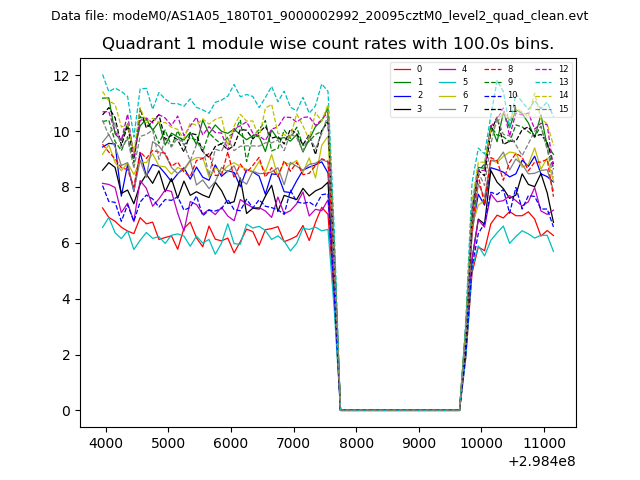 |
 |
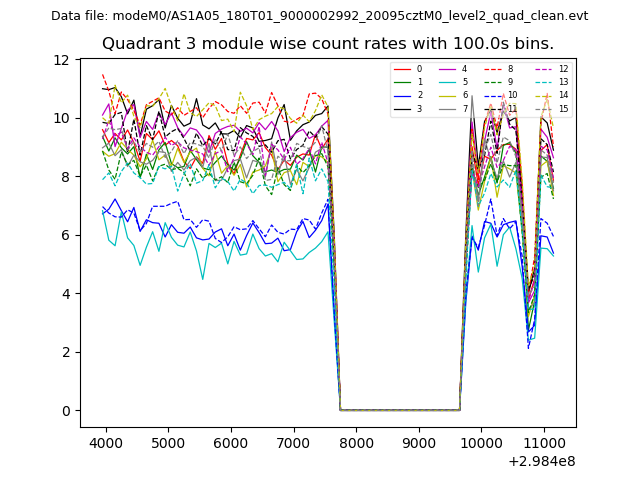
| Module-wise count rates for Quadrant C Data is divided into 100 sec bins |
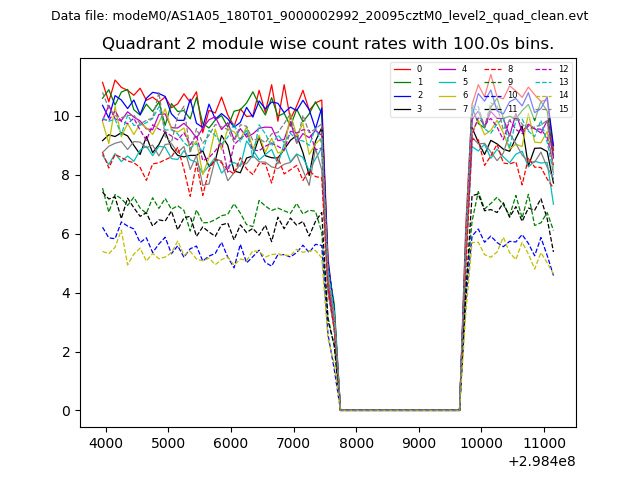 |
 |
| Module-wise count rates for Quadrant D Data is divided into 100 sec bins |
 |
 |
| Parameter | Plot |
|---|---|
| CZT HV Monitor | 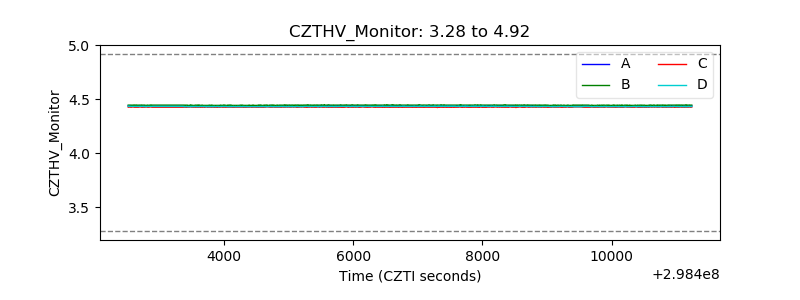 |
| D_VDD | 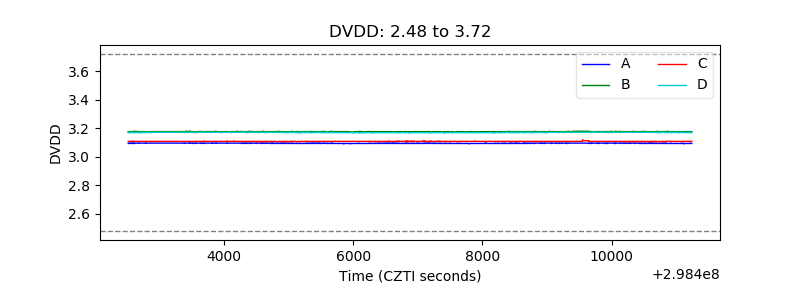 |
| Temperature 1 | 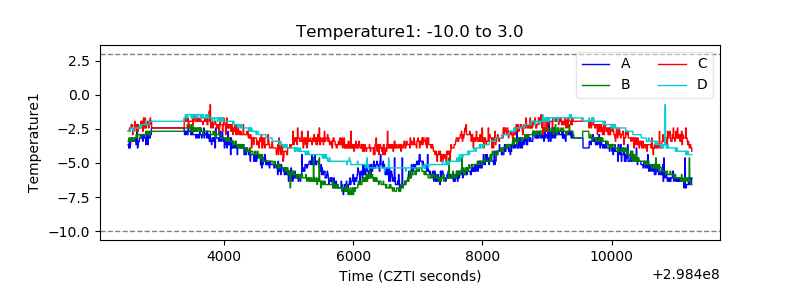 |
| Veto HV Monitor | 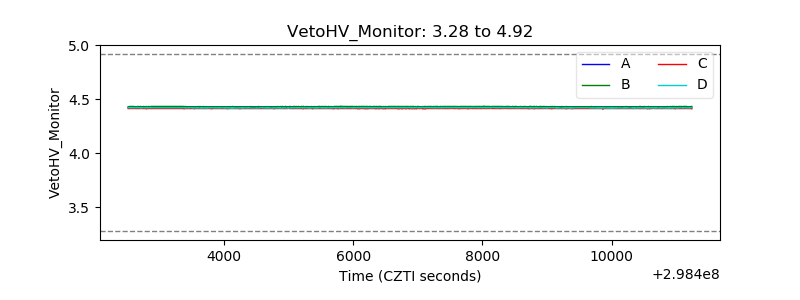 |
| Veto LLD | 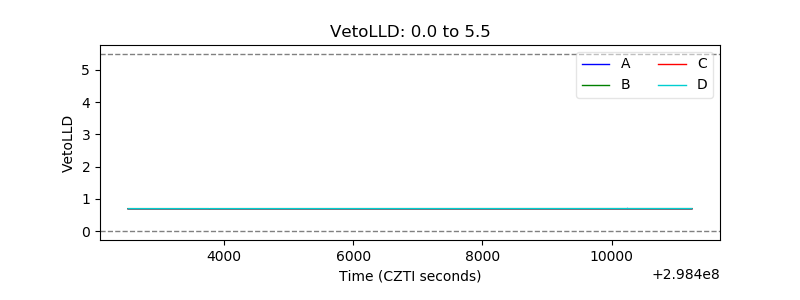 |
| Alpha Counter | 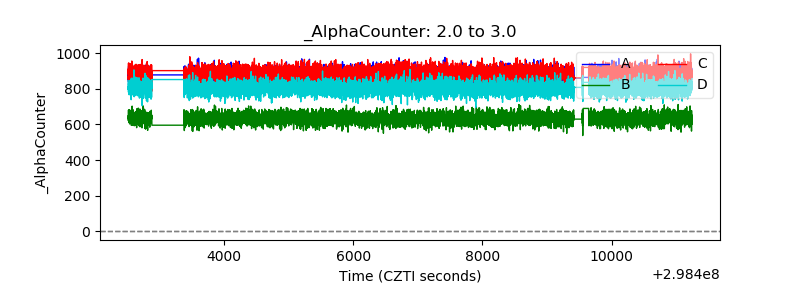 |
| _CPM_Rate | 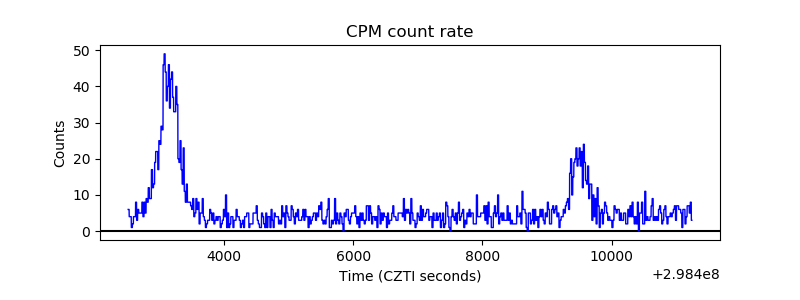 |
| CZT Counter | 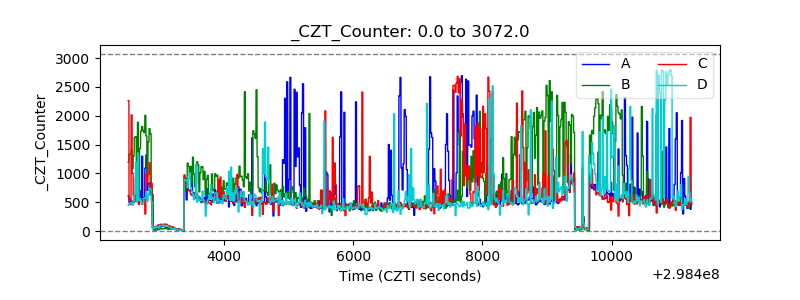 |
| +2.5 Volts monitor |  |
| +5 Volts monitor | 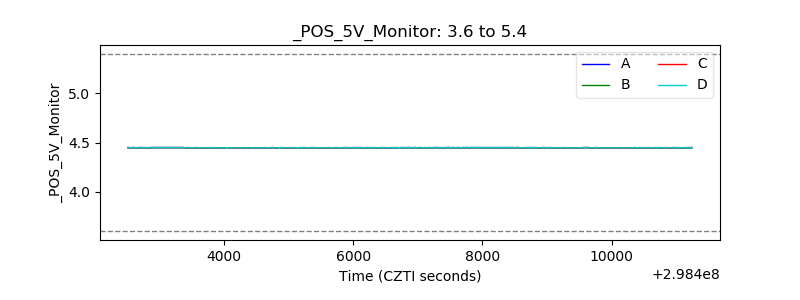 |
| _ROLL_ROT | 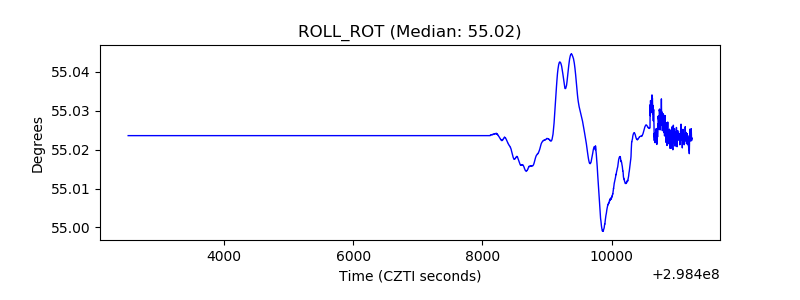 |
| _Roll_DEC | 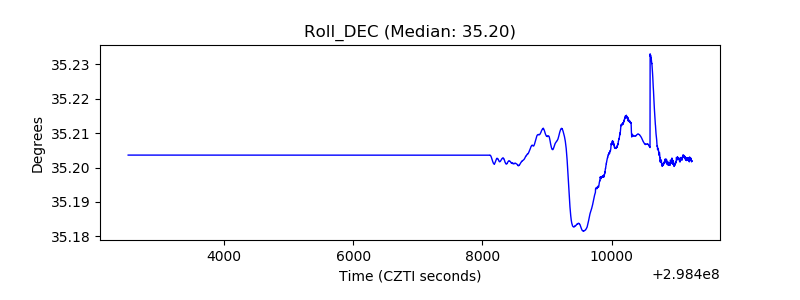 |
| _Roll_RA | 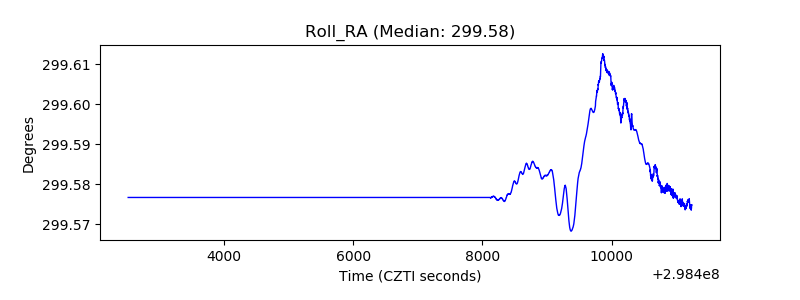 |
| Veto Counter | 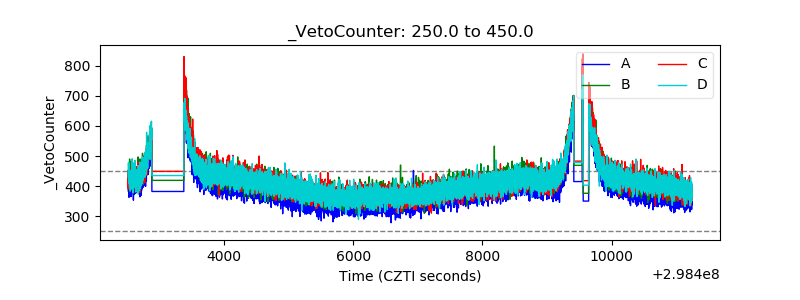 |