| Param | Original file | Final file |
|---|---|---|
| Filename | modeM0/AS1A05_180T01_9000002992_20096cztM0_level2.evt | modeM0/AS1A05_180T01_9000002992_20096cztM0_level2_quad_clean.evt |
| Size (bytes) | 1,194,546,240 | 190,327,680 |
| Size | 1.1 GB | 181.5 MB |
| Events in quadrant A | 9,263,479 | 1,223,614 |
| Events in quadrant B | 9,380,426 | 1,250,890 |
| Events in quadrant C | 7,681,857 | 1,213,836 |
| Events in quadrant D | 8,976,040 | 1,179,696 |
| Mode M9 | |||
|---|---|---|---|
| Quadrant | BADHDUFLAG | Total packets | Discarded packets |
| A | 0 | 5 | 0 |
| B | 0 | 5 | 0 |
| C | 0 | 5 | 0 |
| D | 0 | 5 | 0 |
| Mode M0 | |||
|---|---|---|---|
| Quadrant | BADHDUFLAG | Total packets | Discarded packets |
| A | 0 | 35916 | 2 |
| B | 0 | 36553 | 2 |
| C | 0 | 31055 | 2 |
| D | 0 | 35266 | 2 |
| Mode SS | |||
|---|---|---|---|
| Quadrant | BADHDUFLAG | Total packets | Discarded packets |
| A | 0 | 266 | 0 |
| B | 0 | 266 | 0 |
| C | 0 | 266 | 0 |
| D | 0 | 266 | 0 |
| Quadrant | Total seconds | Saturated seconds | Saturation percentage |
|---|---|---|---|
| A | 12961 | 1157 | 8.926780% |
| B | 12961 | 1220 | 9.412854% |
| C | 12962 | 653 | 5.037803% |
| D | 12961 | 799 | 6.164648% |
Noise dominated data is calculated using 1-second bins in cleaned event files. If a bin has >2000 counts, and if more than 50% of those come from <1% of pixels, then it is considered to be noise-dominated and hence unusable.
| Quadrant | # 1 sec bins | Bins with >0 counts | Bins with >2000 counts | High rate bins dominated by noise | Noise dominated (total time) | Noise dominated (detector-on time) | Marked lightcurve |
|---|---|---|---|---|---|---|---|
| A | 13476 | 12964 | 651 | 651 | 4.83% | 5.02% | 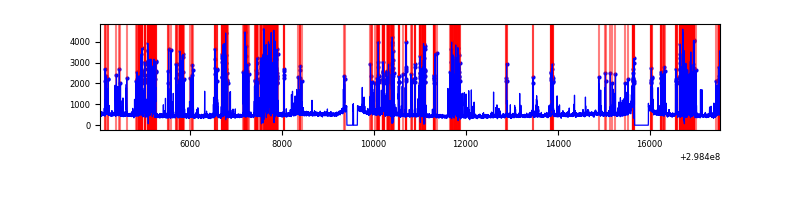 |
| B | 13476 | 12964 | 619 | 619 | 4.59% | 4.77% | 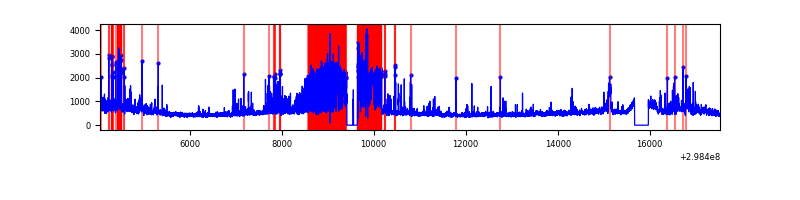 |
| C | 13477 | 12965 | 295 | 295 | 2.19% | 2.28% | 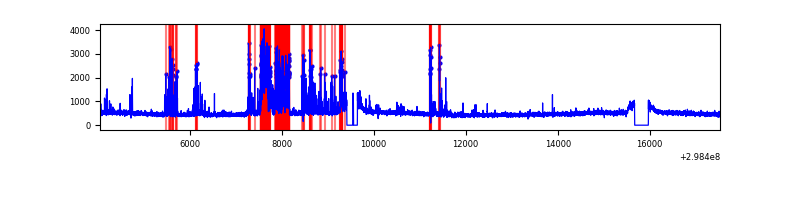 |
| D | 13476 | 12963 | 488 | 488 | 3.62% | 3.76% | 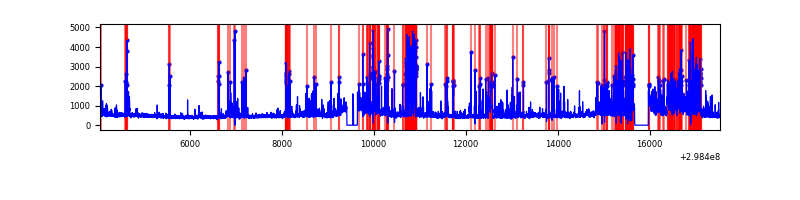 |
Top three noisy pixels from each quadrant. If the there are fewer than three noisy pixels in the level2.evt file, extra rows are filled as -1
| Pixel properties | Quadrant properties | ||||||
|---|---|---|---|---|---|---|---|
| Quadrant | DetID | PixID | Counts | Sigma | Mean | Median | Sigma |
| A | 14 | 238 | 2953903 | 9364.24 | 1557 | 1527 | 315.3 |
| A | 14 | 254 | 226438 | 713.36 | 1557 | 1527 | 315.3 |
| A | 9 | 143 | 51556 | 158.68 | 1557 | 1527 | 315.3 |
| B | 10 | 245 | 3087226 | 10468.89 | 1546 | 1506 | 294.8 |
| B | 7 | 220 | 45326 | 148.67 | 1546 | 1506 | 294.8 |
| B | 4 | 80 | 43701 | 143.15 | 1546 | 1506 | 294.8 |
| C | 4 | 254 | 1452838 | 4051.09 | 1529 | 1544 | 358.2 |
| C | 14 | 238 | 240093 | 665.88 | 1529 | 1544 | 358.2 |
| C | 3 | 233 | 31984 | 84.97 | 1529 | 1544 | 358.2 |
| D | 1 | 52 | 2486512 | 6677.22 | 1530 | 1489 | 372.2 |
| D | 12 | 218 | 390376 | 1044.93 | 1530 | 1489 | 372.2 |
| D | 2 | 184 | 162314 | 432.13 | 1530 | 1489 | 372.2 |
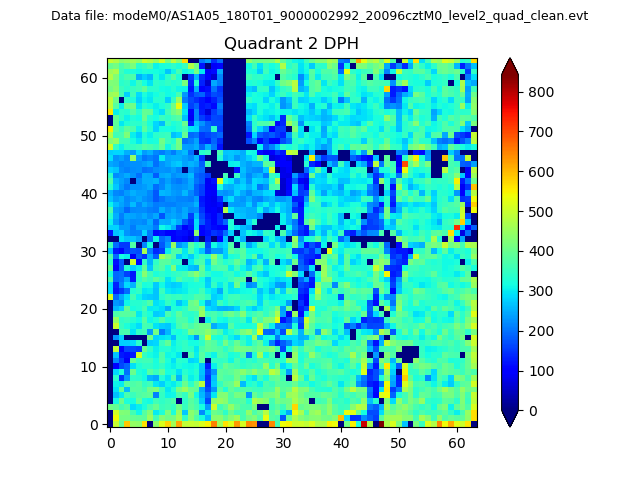
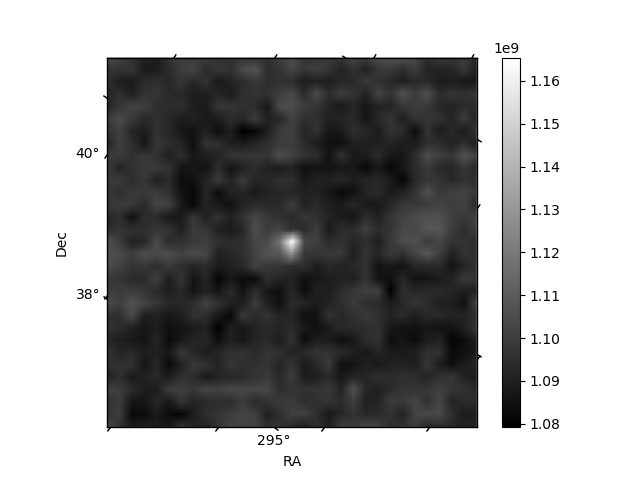
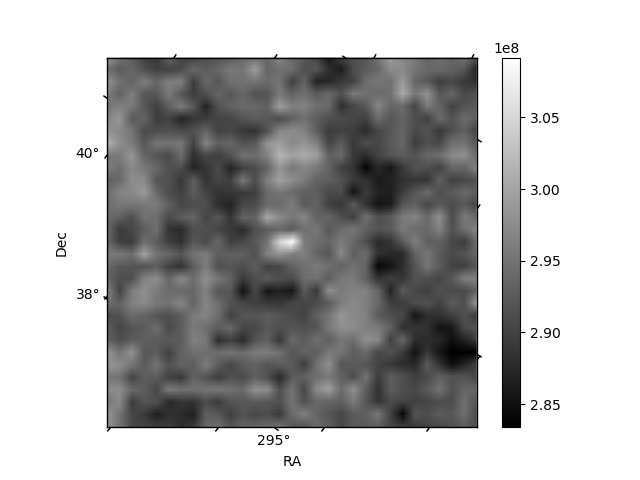
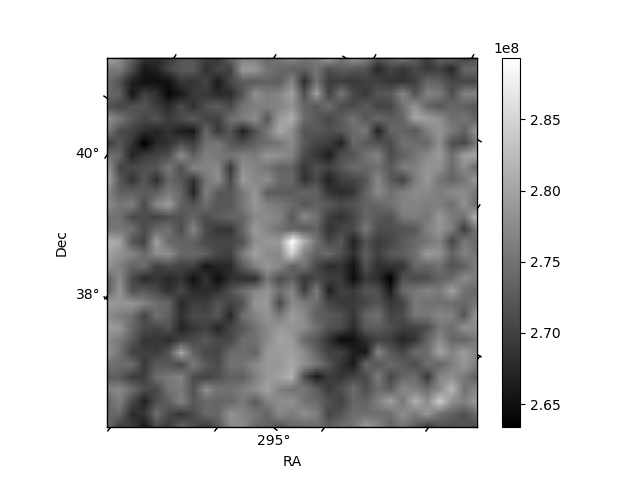
Histogram calculated using DETX and DETY for each event in the final _common_clean file
| Quadrant A | 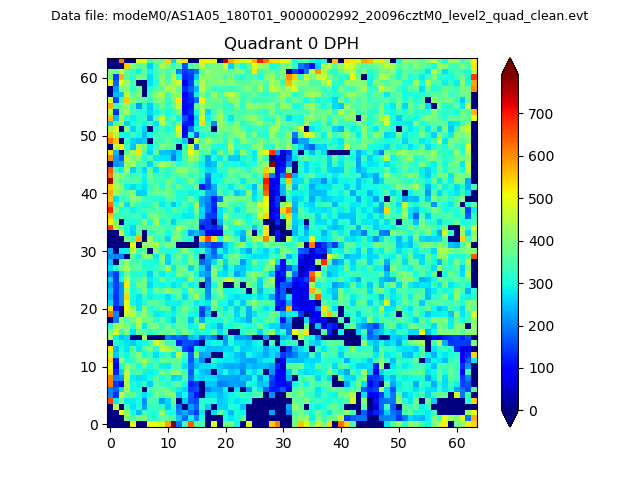 |
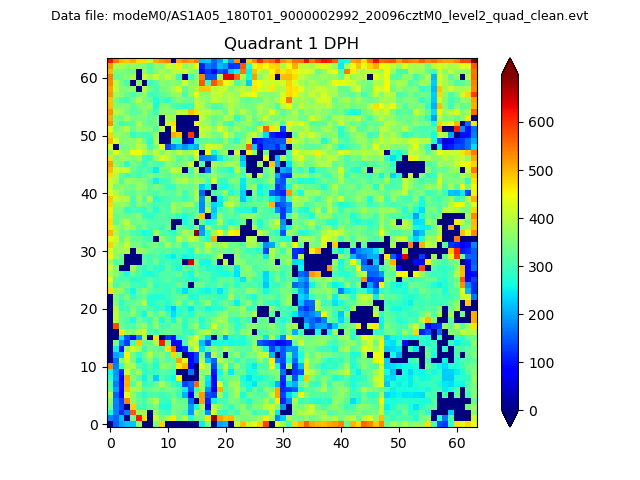 |
Quadrant B |
|---|---|---|---|
| Quadrant D | 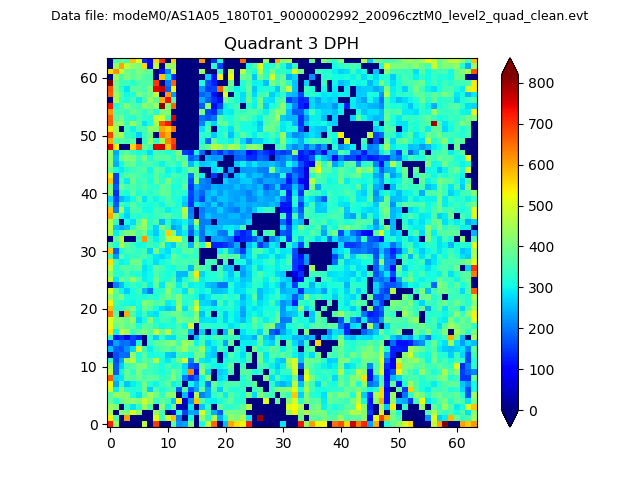 |
 |
Quadrant C |
| Plot type | Count rate plots | Images |
|---|---|---|
| Comparison with Poisson distribution Blue bars denote a histogram of data divided into 1 sec bins. Red curve is a Poisson curve with rate = median count rate of data. |
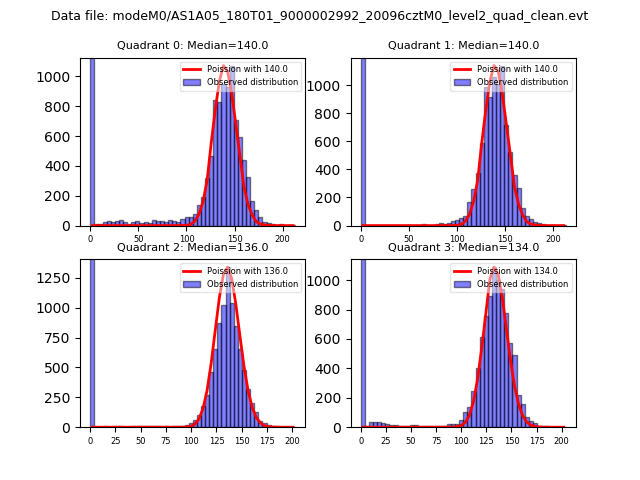 |
 |
| Quadrant-wise count rates Data is divided into 100 sec bins |
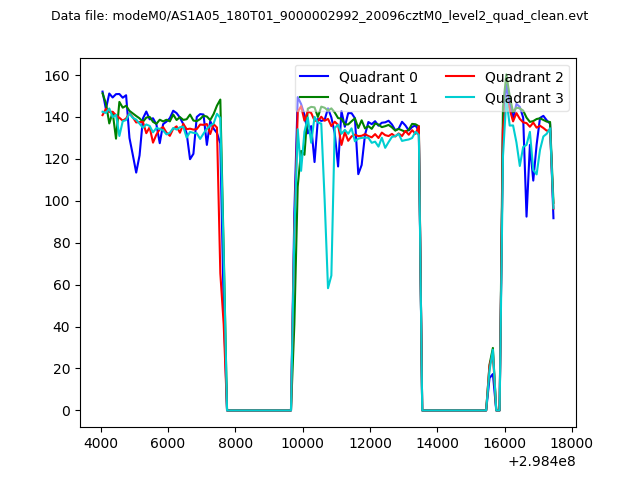 |
|
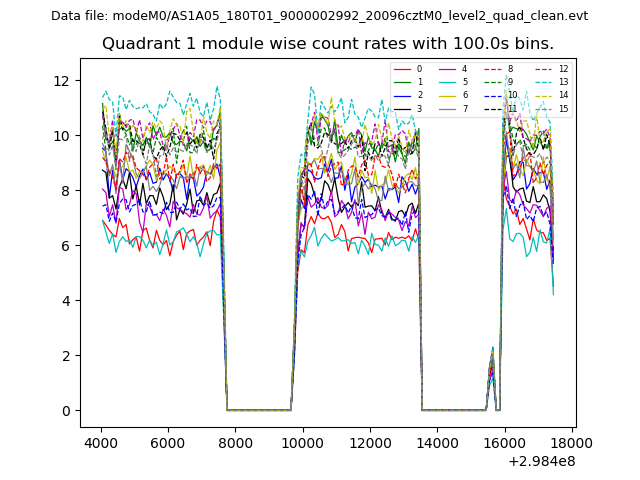
| Module-wise count rates for Quadrant A Data is divided into 100 sec bins |
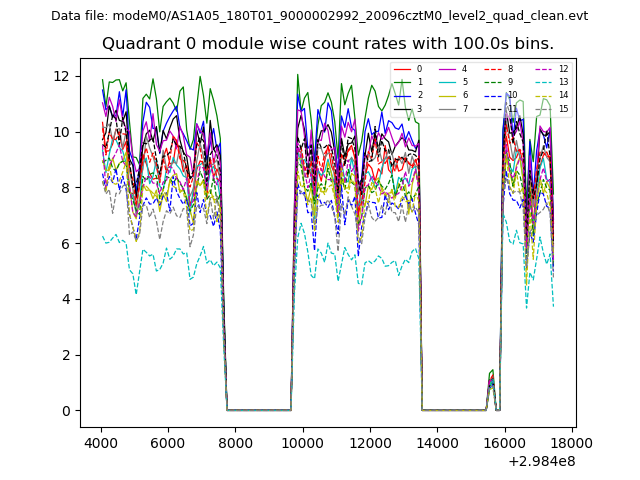 |
 |
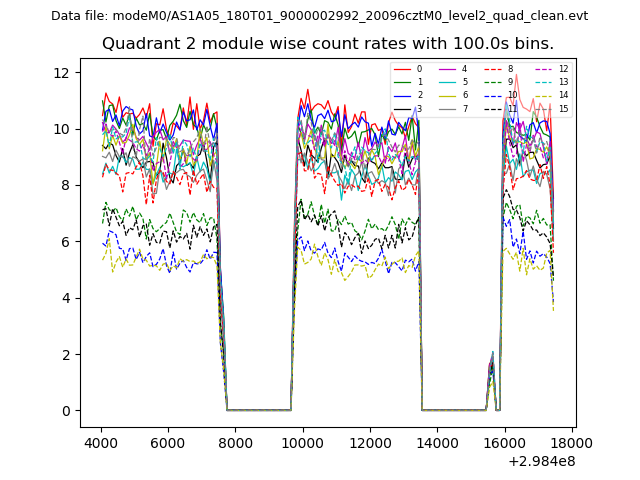
| Module-wise count rates for Quadrant B Data is divided into 100 sec bins |
 |
 |
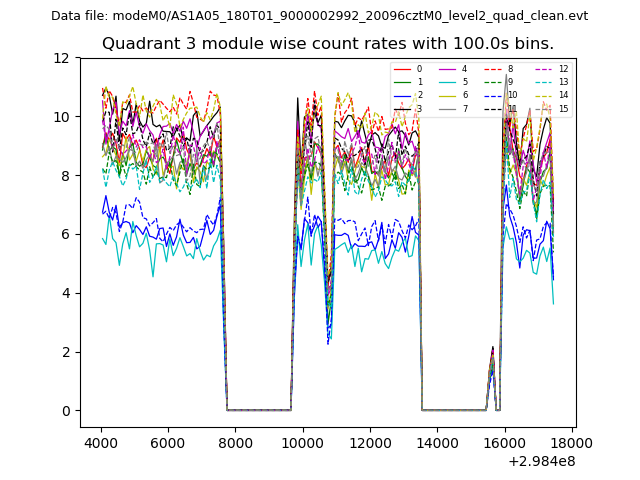
| Module-wise count rates for Quadrant C Data is divided into 100 sec bins |
 |
 |
| Module-wise count rates for Quadrant D Data is divided into 100 sec bins |
 |
 |
| Parameter | Plot |
|---|---|
| CZT HV Monitor | 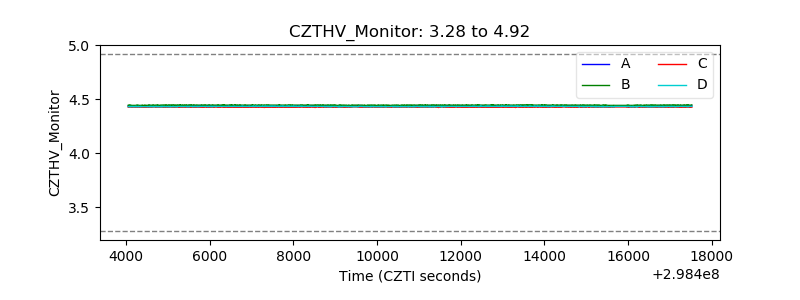 |
| D_VDD | 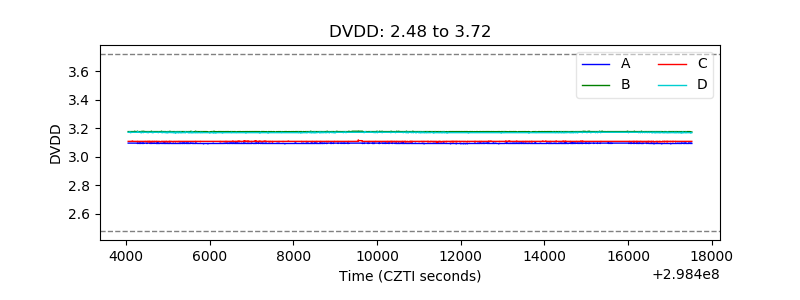 |
| Temperature 1 | 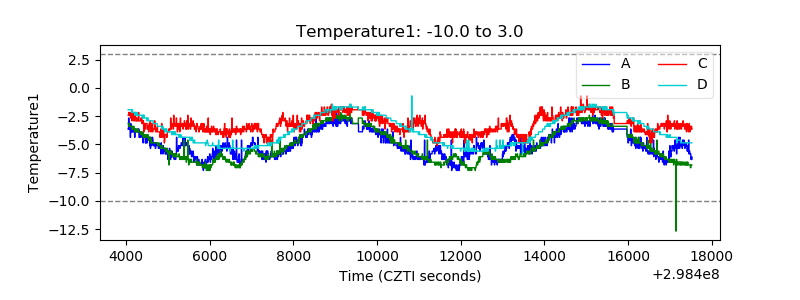 |
| Veto HV Monitor |  |
| Veto LLD | 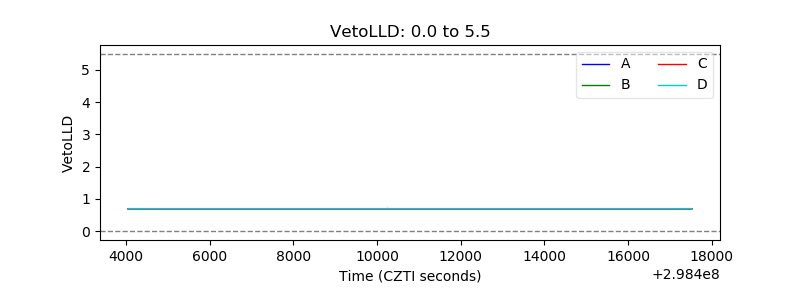 |
| Alpha Counter | 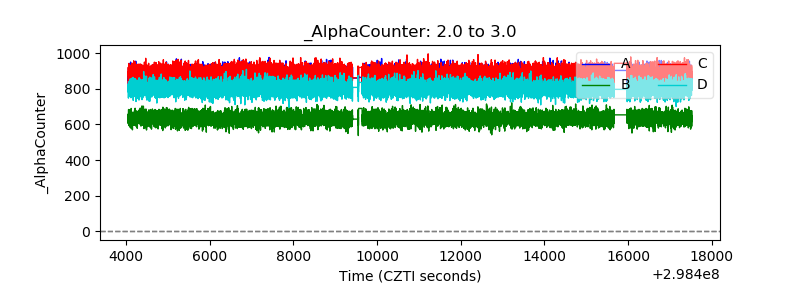 |
| _CPM_Rate | 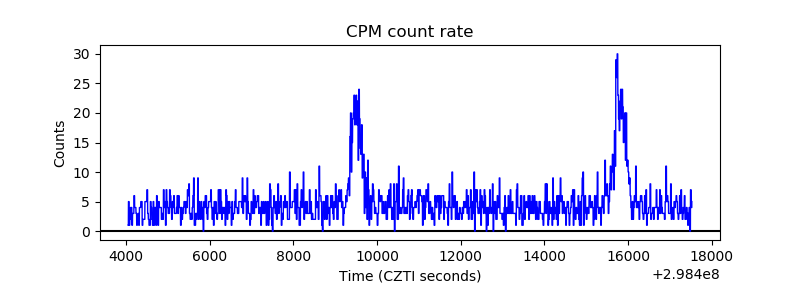 |
| CZT Counter | 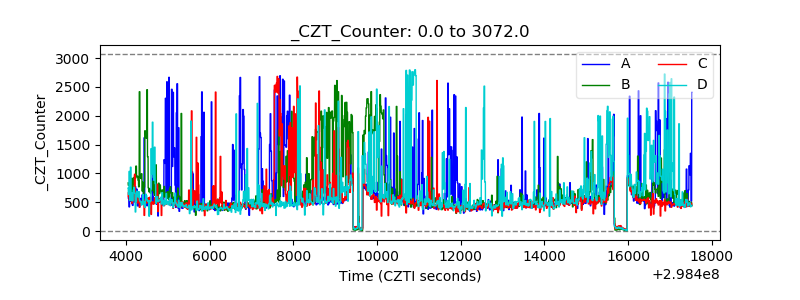 |
| +2.5 Volts monitor |  |
| +5 Volts monitor |  |
| _ROLL_ROT | 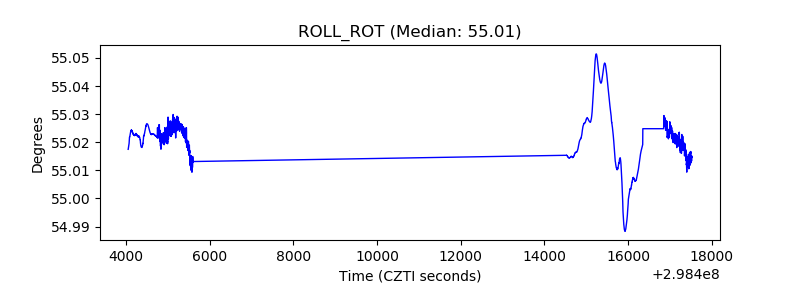 |
| _Roll_DEC | 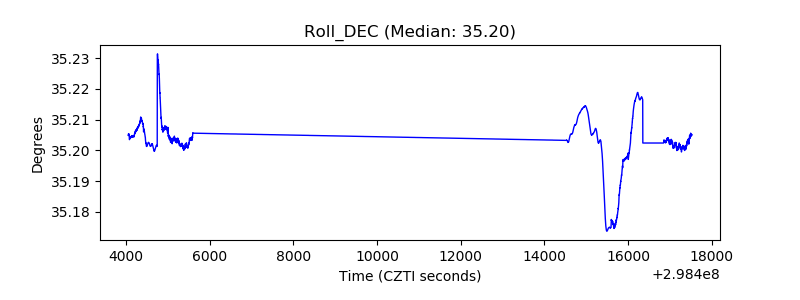 |
| _Roll_RA | 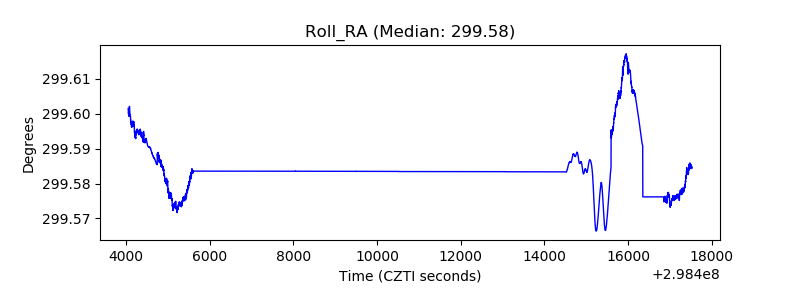 |
| Veto Counter | 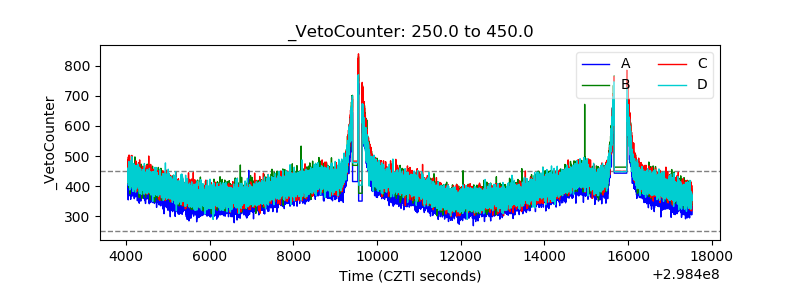 |